Climate Change Politics Post-Paris. Miranda A. Schreurs Environmental Policy Research Center Freie Univ. Berlin
|
|
|
- Stephen Cannon
- 5 years ago
- Views:
Transcription
1 Climate Change Politics Post-Paris Miranda A. Schreurs Environmental Policy Research Center Freie Univ. Berlin

2 ions/sustain.jpg

3 Nasa: FINAL.png

4 Source: Global Carbon Project, 2013 data

5
6 CO2 Emissions Per Cap in Top 5 Emitters Source: EDGAR 4.2 UNDP, 2010: Oliver et al. 2012,
7 Share Global CO 2 Emissions (2013) Source: Global Carbon Project 1. China 29% 2. United States 15% 3. European Union 10% 4. India 7.1% 5. Russian Federation 5.3% 6. Japan 3.7% 7. Germany 2.2% 8. Republic of Korea 1.8% 9. Iran 1.8% 10. Saudia Arabia 1.8% Top 3 (China, US, EU) = 54% global total Top 6 (China, US, EU, India, Russian Fed., Japan = 70.1%)

8 The Paris Climate Accord _30_Nov_2015_% %29.jpg
9 Main Achievements Agreements on: Keeping temperature increase below 2 C, and strive for 1.5 C Nationally determined contributions (NDCs) (annual reports on progress with international review) new NDCs after 5 years (with expectation they will represent a progression beyond previous ones) Increasing aid for developing countries to more than US$100 billion per year
10 Decarbonization of Energy Industry Shift away from lignite, hard coal, oil, and eventually natural gas Future of fossil fuel use is time limited! Energy efficiency will be crucial Renewable energy will be a major part of the future global energy economy Nuclear energy will be pushed by industry, but also strongly resisted. Probably too expensive.
11 Major Economies
12 EU Goals set in 2008: 20, 20, 20 by % reduction in CO 2 emissions 20% energy efficiency improvements 20% renewable energy in final energy mix1990
13 EU s 2030 Framework for Climate and Energy Policy Council decision (October 23, 2014): By 2030: At least 40% ghg emission reductions (compared to 1990 levels) 27% share of renewables in energy consumed 27% (minimum) energy efficiency improvements (with possible increase to 30% after 2020 review)

14 Renewables Primary Production EU _599x393.jpg

15 Renewable share of the EU energy mix for electricity, transport and heating and cooling. Source: Eurostat, Chart by Carbon Brief
16 Energiewende Targets set in 2010 Climate Renewables Efficiency Green house gases (vs. 1990) power Primary energy consum ption Primary energy power Energy productivity transport buildings % 35% 18% - 20% -10% -10 % Double % % 50% 30% - 70 % 65% 45% increase to 2,1%/a Refurbisment p.a % 80% 60% - 50% -25% - 40 %

17 China

18

19 China s Primary Energy Mix

20
21 China: National Climate Change Programme (June 2007) 1. Climate change visible in China 2. Emission intensity improving (5.47kgC02/$US in kgC02/$US in 2004) 3. Developed countries have primary responsibility 4. Develop low carbon and renewable energy 5. Nation-wide tree planting 6. Family planning 7. New institutions and laws 8. Climate change research and capacity building

22 Twelfth Five Year Plan: Renewables 16% reduction in energy intensity (energy consumption per unit of GDP) Increase non-fossil energy to 11.4% of total energy use in 2015 and 15% in % reduction in carbon intensity (carbon emissions per unit of GDP).


23 China: Climate Negotiations Cap on carbon emissions: around Renewables 20% of final energy by 2030
24 China under Xi Jinping calls for creation of ecological civilization Revamping of 1989 environmental law Fight on air pollution Introduction of 7 pilot CO 2 emissions trading systems. National system to be established in 2016.
25 China under Xi Jinpeng calls for creation of ecological civilization Revamping of 1989 environmental law Fight on air pollution Introduction of emissions trading system Cap on carbon emissions: around Renewables 20% of final energy by 2030

26 United States

27 U.S. Crude Energy Imports,


28 Energy Policy Act focus is on how to meet growing energy demands linked to rising population -how to assure energy security -provides numerous incentives to oil, coal, gas industries -also has some focus on renewable energies and energy efficiency improvements

29
30 Barack Obama, 2009 $150 Billion over 10 Years in Clean Energy Double Energy Research and Development Funding Develop and Deploy Clean Coal Technology Increase Fuel Economy Standards 50 Percent by 2030 (Jan 26, 2009 announced plans to set 35 mpg requirement by 2020)
31 Obama 2012 Car Efficiency Standards In August 2012, the Obama administration issued new rules that require auto companies to meet an average of 54.5 miles/gallon for 2025 (average efficiency of fleet)
32 30% cut in US power plant emissions Covers the approx plants of at least 1MW size. Different goals to be set for each state. Flexibility for meeting targets (through efficiency, more natural gas, renewables, cap and trade...). Plan expected to save $48-82 billion by 2030 in health and climate benefits
33 India Reduce emissions intensity of CO2 by 33-35% of 2005 levels by % non-fossil fuels by 2030 (also includes nuclear, 175 GW solar and wind) 33% forest cover


34 U.S. on Paris Climate Negotiations 26-28% cut by 2025 compared to 2005 US bilateral negotiating with China and India on climate
35 Japan At time of Fukushima 54 nuclear reactors All except one currently off-grid. 48 operable nuclear reactors. Climate policy will hinge on decision about nuclear. Paris: -26% of FY 2013 levels by 2030 (25.4% compared to 2005 levels; 18% below 1990 levels)

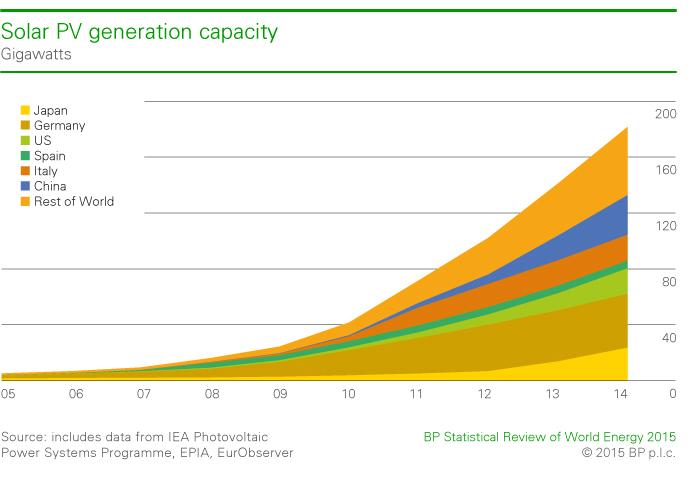
36 Renewables Growth in Japan Post Fukushima
37

38
39 Renewables 22.8% of world electricity production in 2014 (nuclear 10.8% in 2013)
40 International Renewable Energy Agency Founded in (Idea first proposed in 1981) Established as global hub for renewable energy information exchange and cooperation (143 states plus the EU) Welcomes Paris Accord as: Watershed for the Global Energy Transition

41
42

43
44

45
46

47

48
49
50 Global Solar Council, launched at founding members Applied Materials Dow Corning DuPont First Solar Lanco Solar Phoenix Solar Suntech COP21 in Paris

51
52 Israel s INDC an economy-wide unconditional target of reducing its per capita greenhouse gas emissions to 7.7 tco2e by 2030 (a reduction of 26% below the level in 2005 of 10.4 tco2e per capita.) An interim target of 8.8 tco2e per capita is expected by 2025.