VILLAGE OF LIONS BAY DRINKING WATER QUALITY ANNUAL REPORT
|
|
|
- Jodie Harrell
- 5 years ago
- Views:
Transcription

1 VILLAGE OF LIONS BAY DRINKING WATER QUALITY ANNUAL REPORT FY 2014
2 TABLE OF CONTENTS Contents INTRODUCTION 1 GENERAL DESCRIPTION 2 LICENSES 2 SOURCE WATER 3 ISSUES 3 CHALLENGES 3 TESTING & RESULTS 4 WATER TREATMENT 6 CHALLENGES & TURBIDITY EVENT RESPONSE 6 TESTING & RESULTS 7 DISTRIBUTION SYSTEM 8 TESTING & RESULTS 8 WORK PROGRAM WORK PROGRAM OPERATOR TRAINING 12 Appendices APPENDIX A: WATER QUALITY SAMPLING SITE LOCATIONS AND TEST FREQUENCY APPENDIX B: SOURCE & DISTRIBUTION WATER TESTING RESULTS APPENDIX C: 3-YEAR COMPARISON GRAPHS TURBIDITY AND CHLORINE RESIDUALS APPENDIX D: METALS & WATER CHEMISTRY TEST RESULTS APPENDIX E: BOIL WATER ADVISORIES ISSUED APPENDIX F: EMERGENCY RESPONSE PLAN APPENDIX G: VANCOUVER COASTAL HEALTH PERMIT TO OPERATE APPENDIX H: EOCP FACILITY CLASSIFICATION APPENDIX I: EOCP OPERATOR CERTIFICATES
3 INTRODUCTION INTRODUCTION This report comprises the 2014 Drinking Water Quality Annual Report prepared by the Village of Lions Bay. It provides pertinent information about the Village s drinking water to support the Village s application for its annual Operating Permit, issued by the Medical Health Officer. The purpose of the report is to provide Village water consumers with drinking water sampling test results for 2014, as well as to present background information on Village-specific issues concerning water supply, treatment, and measures being taken to protect and enhance drinking water quality as per requirements under the Drinking Water Protection Regulation and the Drinking Water Protection Act. Although the Village is a member of Metro Vancouver, its water supply is not sourced from the Greater Vancouver Water District (GVWD). The Village of Lions Bay owns and operates its own water supply, treatment, and distribution system, and has the water from its system analyzed for the presence of microbiological pathogens (and other indicator organisms), metals, and chlorine residuals by laboratories approved by the Medical Health Officer. 1
4 GENERAL DESCRIPTION GENERAL DESCRIPTION The Village of Lions Bay supplies potable water to its customers via a waterworks system comprised of 2 intakes located on Harvey and Magnesia Creeks, 2 water treatment plants (which provide UV disinfection and chlorination) located downstream from the respective intakes, 5 storage tanks, 13 PRV stations, and 13 kilometers of water mains. A population of approximately 1,348 is served through 591 service connections. LICENSES The Village of Lions Bay held 6 water licenses (5 utilized) in 2014, issued by the Ministry of Environment. Table 1 lists the licenses and quantity of water associated with each. Table 1. Village Water Licenses License No Imperial Quantity Metric Quantity Stream Name C ,000, gal/year 45, m3/year Magnesia Creek C ,380, gal/year 19, m3/year Magnesia Creek C ,300, gal/year 33, m3/year Magnesia Creek C ,250, gal/year 82, m3/year Alberta Creek * C ,125, gal/year 41, m3/year Harvey Creek C ,750, gal/year 248, m3/year Harvey Creek *Alberta Creek is not utilized by the Village In 2014, 772, m3 of water was supplied to residents from Magnesia and Harvey creeks. As such, the Village s annual water consumption far exceeded its licenses. 2
5 SOURCE WATER SOURCE WATER The Village of Lions Bay s watershed areas include Magnesia Creek drainage (421 hectares), Harvey Creek drainage (635 hectares), Alberta Creek drainage (51 hectares), and Rundle Creek drainage (20 hectares). All Village water is drawn from 2 intakes located on Magnesia and Harvey Creeks, and the Village is responsible for water acquisition, supply, treatment, and distribution to its residents. The Village is systematically working toward a 4-barrier approach to mitigate source water quality issues that include the potential for waterborne disease, seasonal raw water turbidity fluctuations, and bacterial regrowth in its distribution system. The barriers are as follows: primary (UV) and secondary (chlorine) treatment, water quality monitoring (daily, weekly, and monthly), water main cleaning/flushing (bi-annually), and watershed protection (in progress). ISSUES Adequate supply for both residential consumption and fire protection is the primary issue for the Village, as both creek flow levels vary throughout the year. Harvey Creek flow levels are the more volatile of the two, ranging from gallons per minute (January 13 to gallons per minute (September 16) in Conversely, Magnesia Creek flow levels averaged around 218 gallons per minute virtually year-round. CHALLENGES The Village draws all of its water from surface sources that are subject to fluctuating turbidity levels, and are designated as unstable terrain upslope. This fluctuation in raw water turbidity presents many challenges for the treatment of the water to ensure that turbidity and chlorine residuals throughout the entire supply system are not adversely affected. The water treatment plants are monitored remotely via a SCADA system, and are checked daily (work days) by crews; each intake is checked at least weekly. The watershed areas for the intakes are contained by steep, rocky, unstable terrain upslope on one side, and steep flowing creeks subject to debris torrents on the other. Access to the intakes is via narrow gravel roads which are subject to rock fall and tree throw hazards from above. Strict safe working guidelines for unstable terrain upslope prohibit crews from entering the watershed areas and water intakes if rainfall parameters are exceeded. This 3
6 SOURCE WATER prevents crews from being able to investigate decreased water flow or increased raw water turbidity levels during periods of heavy rain the exact times most likely to cause either event. Considerable rainfall and windstorm events have created further challenges for the Village. In late 2014, two separate debris slides in October (affecting Harvey) and December (affecting Magnesia) effectively shut down the respective intakes completely, necessitating boil water advisories to be issued, and strict conservation measures to be undertaken in an effort to ensure the Village did not run out of water completely in December. TESTING & RESULTS The Village tests raw source water for turbidity from both creeks daily (work days). More extensive testing is undertaken bi-annually for general water chemistry, hardness, metals, and other contaminants including organic compounds. Table 2 presents the Village s raw water turbidity test results for Table Raw Water Turbidity Results Harvey Creek Magnesia Creek Count Maximum result (NTU) Minimum result (NTU) Average (NTU) Number >5 NTU 0 2 Percentage > 5 NTU 0% 0.84% Section 3.3 of the 2003 Guidelines for Canadian Drinking Water Quality Supporting Documentation titled Turbidity, Criteria for Exclusion of Filtration in Waterworks Systems contains a provision for exemption from its recommendation of filtration for all surface water supplies if the system s average daily source water turbidity levels measured immediately prior to where disinfection is applied, are around 1.0 NTU but do not exceed 5.0 NTU for more than 2 days in a 12-month period. As indicated in Table 1, raw water 4
7 SOURCE WATER turbidity did not exceed 5 NTUs from Harvey Creek during the year, and exceeded 5 NTUs twice from Magnesia. Elevated turbidity levels caused by debris slides and stream scouring upslope of the Village s intakes resulted in 3 separate boil water advisories issued by Vancouver Coastal Health in Boil water advisories were in effect for the following timeframes: Issued March 6; lifted March 13 Issued October 22; lifted November 13 Issued December 11; lifted December 29 Appendix B contains all source raw water test results for 2014, and Appendix E contains copies of all boil water advisories issued in The Village further tests twice a year for metals and general chemistry of its treated and raw water, including hardness, ph, total suspended solids, turbidity, alkalinity, organic carbon, biochemical oxygen demand (BOD), and trihalomethanes. Appendix D contains the 2014 raw water metals and general chemistry test results. 5
8 WATER TREATMENT WATER TREATMENT The Village of Lions bay does not have a filtration system. Raw water from Harvey and Magnesia Creek intakes is treated via a 2-stage process within their respective treatment plants the primary stage is disinfection utilizing ultraviolet radiation (UV), and the secondary stage is chlorine injection. This 2-stage process is required because although UV is very effective at inactivating Giardia and Cryptosporidium, it does not introduce any disinfectant residual to the water, rendering it incapable of protecting the distribution system against contamination. Therefore, chlorination is used as the secondary stage of disinfection in order to establish a residual throughout the system. The Village tests samples which are taken daily (workdays) for turbidity and chlorine residuals from 6 sampling stations located in the middle and ends of the distribution system, in addition to those taken from the 2 reservoir tanks located at the treatment plants. Once a week, further samples are taken from the 2 reservoir tanks and sent to a Vancouver Coastal Health approved testing laboratory and tested for E. coli and total coliforms. The Drinking Water Protection Regulation s water quality standards for potable water indicate that there can be no detectable E. coli per 100ml; and that total coliform bacteria samples (for more than 1 sample taken per month) must have at least 90% of samples with no detectable total coliform bacteria per 100ml and no 1 sample can have more than 10 total coliform bacteria per 100ml. No test samples taken weekly from the Village s 2 reservoir tanks exceeded these parameters in CHALLENGES & TURBIDITY EVENT RESPONSE The challenges outlined in the Source Water Section of this report also impact the Village s water treatment plants. The performance of the primary UV treatment is affected by increased turbidity because water that that has higher turbidity absorbs a significant amount of UV light, and will therefore have a correspondingly low UV transmittance (UVT) rate. The UV system automatically increases lamp intensity to counter the lower UVT. If turbidity exceeds 5 NTUs entering the plants, the UV system will send an alarm through SCADA to notify the Water Operator, and the UV reactor shuts down. During turbidity events in excess of 5 NTU, microbiological sampling and testing is increased at all sampling locations; chlorine residual sampling and testing is likewise increased; and the Village will 6
9 WATER TREATMENT contact Vancouver Coastal Heath, who may issue a Boil Water Advisory. contains the Village s Emergency Response Plan. Appendix F In times of severe weather, the Water Operator increases the frequency of testing and adjusts chlorine injection rates to compensate for any fluctuating chlorine demand caused by varying turbidity levels. As chlorine residual levels increase, so do resident complaints about taste and/or odor, especially at the beginning of the distribution system. The generally agreed minimum acceptable residual chlorine level for treated drinking water at all points in the distribution system is 0.2ppm; and the maximum is 4ppm. TESTING & RESULTS Table 3 presents an overview of the Village s treated water turbidity results at Harvey and Magnesia reservoir storage tanks located directly downstream of their respective treatment plants. Table 4 presents an overview of the chlorine residuals at the same reservoir storage tanks. Appendix C contains 3-year comparison graphs of turbidity and chlorine residual test results. Table Village Treated Water Turbidity at Reservoir Tanks Harvey reservoir tank Magnesia reservoir tank Count Maximum NTU Minimum NTU Average NTU Number >5 NTU 0 0 Percentage >5 NTU 0% 0% Table Village Chlorine Residuals at Reservoir Tanks Harvey reservoir tank Magnesia reservoir tank Count Maximum ppm Minimum ppm Average ppm Number <0.2 ppm 2 1 Percentage <0.2 ppm 0.79% 0.40% 7
10 DISTRIBUTION SYSTEM DISTRIBUTION SYSTEM The Village of Lions Bay s distribution system serves a population of approximately 1,348 residents accounting for essentially 100% of the Village s annual water consumption. As the Village is located on a mountainside, water pressure within the Village s 13km of water mains is controlled by 13 PRV stations; 7 of which are located on the Harvey Creek supplied system, and 6 on the Magnesia Creek supplied system. These mains are constructed primarily of ductile iron (DI), however a variety of materials, including asbestos cement (AC), cast iron (CI), and PVC also exist within the Village. The oldest pipes in the Village s distribution system were installed between 1970 and There are 8 storage tanks located on the system, 5 of which were in use in The 5 in use were Harvey reservoir tank (400,000 imperial gallon), Magnesia reservoir tank (100,000 imperial gallon), Phase 4 tank (20,000 imperial gallon), Phase 5 tank (25,000 imperial gallon), and the Highway tank (21,000 imperial gallon). In 2014, 772, m3 of water was supplied to the Village from Magnesia and Harvey creeks through 591 service connections. This equates to a rough average of 465,400 imperial gallons consumed by the Village per day. TESTING & RESULTS The Village tests samples which are taken daily (workdays) for turbidity and chlorine residuals from 6 sampling stations located in the middle and ends of the distribution system, in addition to those taken from the 2 reservoir tanks located at the treatment plants, to ensure all meet the generally accepted minimum residual of 0.2ppm for chlorine residual and are less than 5 NTU for turbidity. Once a week, further samples are sent to a Vancouver Coastal Health approved testing laboratory and tested for E. coli and total coliforms. The Drinking Water Protection Regulation s water quality standards for potable water indicate that there can be no detectable E. coli per 100ml; and that total coliform bacteria samples (for more than 1 sample taken per month) must have at least 90% of samples with no detectable total coliform bacteria per 100ml and no 1 sample can have more than 10 total coliform bacteria per 100ml. No test sample results taken weekly from the Village s distribution and storage system exceeded these parameters in
11 DISTRIBUTION SYSTEM Table 5 presents an overview of the Village s treated water turbidity results on the Harvey system and Table 6 presents the same overview on the Magnesia system. Tables 7 and 8 present an overview of the Village s chlorine residual results on the Harvey and Magnesia distribution systems respectively. Appendix A lists all sample site locations, the tests performed, and the frequency of testing at each. Appendix B contains all Village treated water test results for Table Turbidity Results in Harvey Distribution System PRV-3 CAFÉ LIONS BAY AVE KELVIN GROVE Count Maximum NTU Minimum NTU Average NTU Number >5 NTU Percentage >5 NTU 0% 0.79% 0.40% 0% Table Turbidity Results in Magnesia Distribution System PRV-5 BRUNSWICK BEACH Count Maximum NTU Minimum NTU Average NTU Number >5 NTU 1 0 Percentage >5 NTU 0.40% 0% As indicated in Tables 5 and 6 above, the Village s treated water turbidity on both distribution systems was on average less than ½ of 1 NTU; and was in excess of 5 NTU in less than 1% of any samples taken in Table Chlorine Residual Results in Harvey Distribution System PRV-3 CAFÉ LIONS BAY AVE KELVIN GROVE Count Maximum ppm
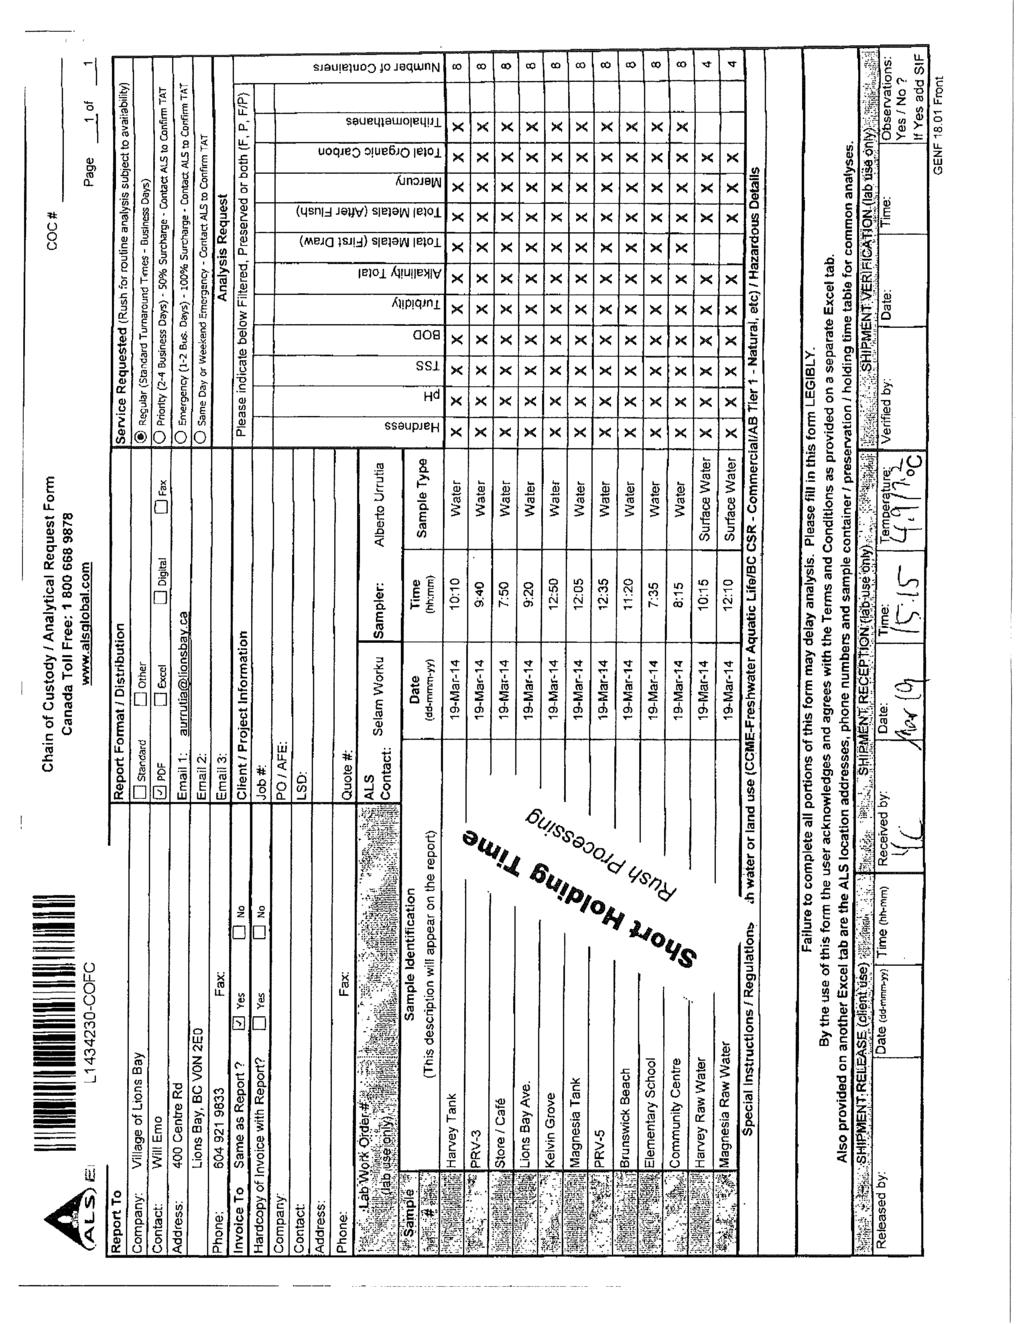
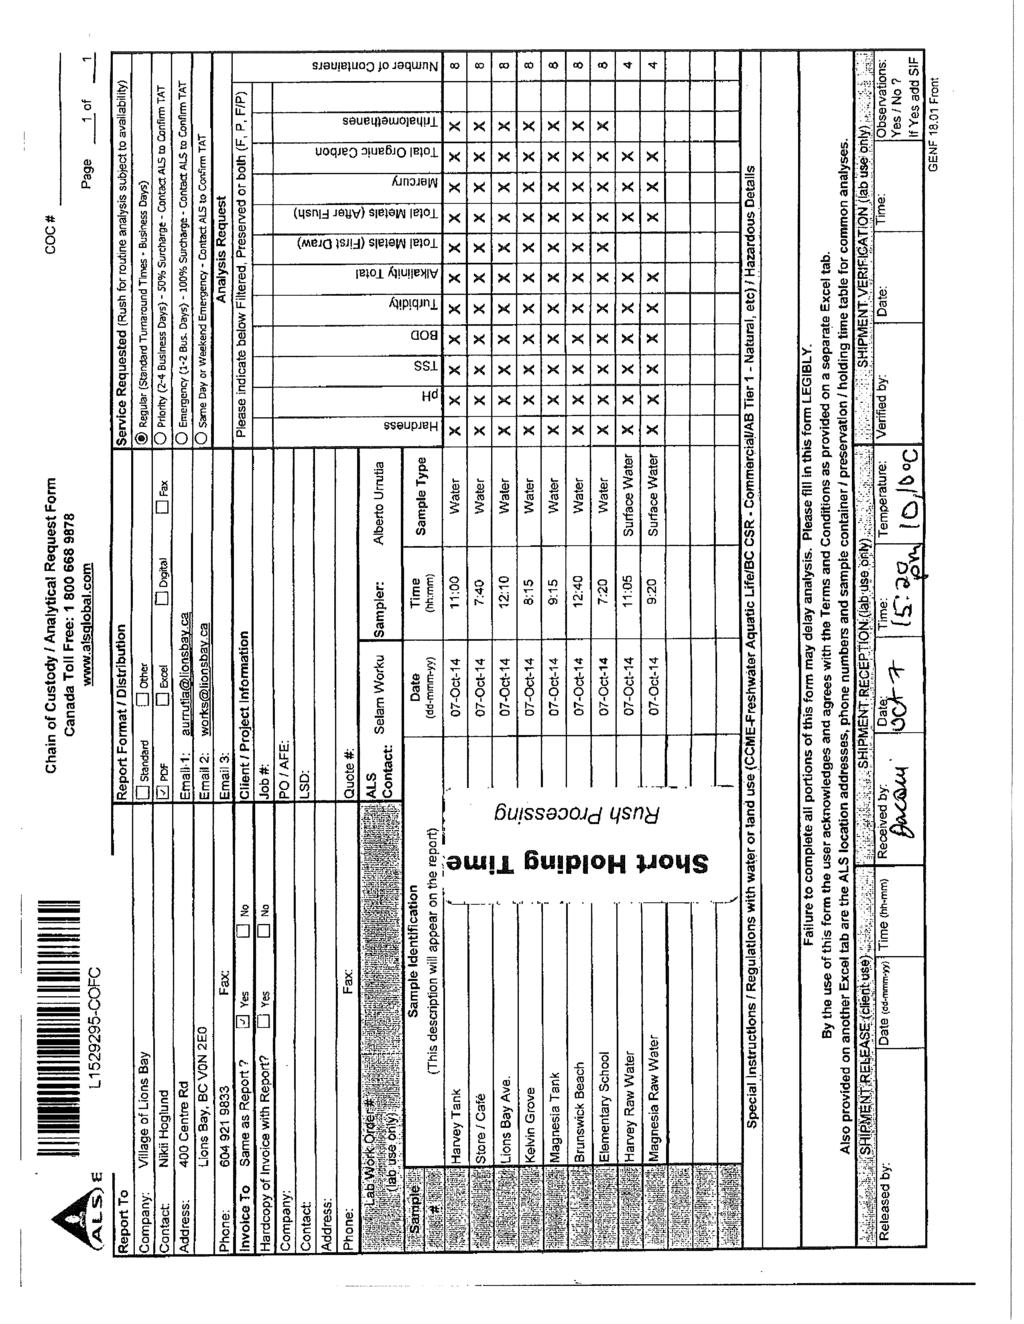
12 DISTRIBUTION SYSTEM Minimum ppm Average ppm Number >0.2 ppm Percentage >0.2 ppm 0% 0% 0.40% 0.40% Table Chlorine Residual Results in Magnesia Distribution System PRV-5 BRUNSWICK BEACH Count Maximum ppm Minimum ppm Average ppm Number >0.2 ppm 0 2 Percentage >0.2 ppm 0% 0.79% As indicated in Tables 7 and 8 above, the Village s treated water chlorine residuals on both distribution systems was on average less than 1 ppm; and was below 0.2 ppm in less than 1% of any samples taken in As indicated in the Water Treatment Section of this report, the Water Operator adjusts chlorine injection rates to compensate for any fluctuating chlorine demand caused by varying turbidity levels, and must ensure that all points in the system show minimum residuals. The generally agreed minimum acceptable residual chlorine level for treated drinking water at all points in the distribution system is 0.2ppm; the maximum is 4ppm. Appendix C contains 3-year comparison graphs of turbidity and chlorine residual test results. The Village further tests 10 locations twice a year for metals and general chemistry of its treated and raw water, including hardness, ph, total suspended solids, turbidity, alkalinity, organic carbon, biochemical oxygen demand (BOD), and trihalomethanes. First draw test results from samples taken in March for lead exceeded the limits set in the Guidelines for Canadian Drinking Water Quality of a maximum acceptable concentration of mg/l measured at the tap in 3 locations at the Works Yard, at the elementary school, and at the Village Community Centre. Given that lead test results have been consistently low in the distribution system, the most likely sources of lead found in these locations would be from lead in the private-side service lines, lead solder in plumbing, or brass fittings such as 10
13 DISTRIBUTION SYSTEM faucets. All 3 locations tested well below the acceptable limit after flushing. In October, the Works Yard location s first draw test was above the acceptable limit; it again tested well below the acceptable limit after flushing. Appendix D contains metals and general chemistry test results for WORK PROGRAM The Village performed a Village-wide soft water main flush in 2014; however the scheduled hard water main flush scheduled for October did not take place due to a combination of low creek flows and debris slides that impacted critical infrastructure at first one, then the other water intake. No capital water main replacement work was scheduled for Several capital projects scheduled for 2014 were put forward for potential grant funding, and are now itemized in 2015 s work program below. WORK PROGRAM Village-wide hard water main flushing programs are scheduled for April and October of The Village will also commission an overall Infrastructure Master Plan, of which the Village s water infrastructure is a key component, in It is anticipated that this plan will identify and recommend future required capital improvements and policies, ranked by priority, to ensure that the water system as a whole is efficiently managed and responsibly operated. The Village has applied for improvements to both Harvey and Magnesia water intakes via the New Build Canada Fund: Small Communities Fund (NBCF-SCF). These improvements include the following: an new infiltration intake design to be retrofitted to the existing Magnesia and Harvey Creek intakes to mitigate the impact of sediment debris that enters the system and reduces the amount of time staff must spend at the intake itself to manually clean out debris; installation of a PRV upstream of the Magnesia water treatment plant to mitigate infrastructure and safety concerns for staff working on or near this main and in the treatment plant; and the installation of a bypass at the Magnesia water treatment plant to ensure that regular maintenance or emergency work to the water plant can be undertaken without shutting down the entire supply system. 11
14 OPERATOR TRAINING OPERATOR TRAINING The BC Drinking Water Protection Regulation outlines water system operator qualification standards. Water systems are classified by the Environmental Operators Certification Program (EOCP), based on the population served and the complexity of the system. The chief operator(s) of the system must, in turn, be certified by the EOCP at the matching classification level of the system. The Village s water treatment and distribution system has been evaluated as a Level 2 classification. The Village currently has one water distribution system operator (Alberto Urrutia) with Level 2 certification from the EOCP. The Village recognizes the inherent value that operator education training and education provides; and ensures that its operator participates annually in a variety of product orientation, workshops, and technical courses that become available annually. In 2014, the courses undertaken to maintain the year s mandatory Continuing Education Units (CEUs) were Reservoir Maintenance, Unidirectional Flushing, Transportation of Dangerous Goods, and Confined Space Awareness Entrant Training. Appendices H and I respectively contain the Village s EOCP facility classification and operator certification. 12
15 APPENDIX A: WATER QUALITY SAMPLING SITE LOCATIONS AND TEST FREQUENCY APPENDIX A: WATER QUALITY SAMPLING SITE LOCATIONS AND TEST FREQUENCY
16 SAMPLE STATIONS AND TESTS SAMPLE STATIONS AND TESTS Tests Location Source Frequency Chlorine Residual & Turbidity PRV-3 Harvey Creek Daily (workdays) (Treated Water) Harvey Reservoir Tank Harvey Creek Daily (workdays Lions Bay Cafe Harvey Creek Daily (workdays) Lions Bay Avenue Harvey Creek Daily (workdays Kelvin Grove Harvey Creek Daily (workdays) PRV-5 Magnesia Creek Daily (workdays Magnesia Reservoir Tank Magnesia Creek Daily (workdays) Brunswick Beach Magnesia Creek Daily (workdays) Test Location Source Frequency Raw Water Turbidity Harvey Intake Harvey Creek Daily (workdays) Magnesia Intake Magnesia Creek Daily (workdays Tests Location Source Frequency Treated Water Bacteriological PRV-3 Harvey Creek weekly (E. coli & total coliforms) Harvey Reservoir Tank Harvey Creek weekly Lions Bay Cafe Harvey Creek weekly Lions Bay Avenue Harvey Creek weekly Kelvin Grove Harvey Creek weekly PRV-5 Magnesia Creek weekly Magnesia Reservoir Tank Magnesia Creek weekly Brunswick Beach Magnesia Creek weekly Test Location Source Frequency Raw Water Turbidity Harvey Intake Harvey Creek Daily (workdays) Magnesia Intake Magnesia Creek Daily (workdays
17 SAMPLE STATIONS AND TESTS Tests Location Source Frequency Treated Water Metals & Chemical PRV-3 Harvey Creek 2x annually Composition Harvey Reservoir Tank Harvey Creek 2x annually Lions Bay Cafe Harvey Creek 2x annually Lions Bay Avenue Harvey Creek 2x annually Kelvin Grove Harvey Creek 2x annually Community Centre Harvey Creek 2x annually Magnesia Reservoir Tank Magnesia Creek 2x annually Brunswick Beach Magnesia Creek 2x annually Elementary School Magnesia Creek 2x annually PRV-5 Magnesia Creek 2x annually Test Location Source Frequency Raw Water Metals & Chemical Harvey Intake Harvey Creek 2x annually Composition Magnesia Intake Magnesia Creek 2x annually
18 APPENDIX B: SOURCE & DISTRIBUTION WATER TESTING RESULTS APPENDIX B: SOURCE & DISTRIBUTION WATER TESTING RESULTS
19 RAW WATER JANUARY 2014 HARVEY CREEK MAGNESIA CREEK Date Time 24 Hr Flow NTU Time 24 Hr Flow NTU
20 RAW WATER FEBRUARY 2014 HARVEY CREEK MAGNESIA CREEK Date Time 24 Hr Flow NTU Time 24 Hr Flow NTU
21 RAW WATER MARCH 2014 HARVEY CREEK MAGNESIA CREEK Date Time 24 Hr Flow NTU Time 24 Hr Flow NTU
22 RAW WATER APRIL 2014 HARVEY CREEK MAGNESIA CREEK Date Time 24 Hr Flow NTU Time 24 Hr Flow NTU
23 RAW WATER MAY 2014 HARVEY CREEK MAGNESIA CREEK Date Time 24 Hr Flow NTU Time 24 Hr Flow NTU
24 RAW WATER JUNE 2014 HARVEY CREEK MAGNESIA CREEK Date Time 24 Hr Flow NTU Time 24 Hr Flow NTU
25 RAW WATER JULY 2014 HARVEY CREEK MAGNESIA CREEK Date Time 24 Hr Flow NTU Time 24 Hr Flow NTU
26 RAW WATER AUGUST 2014 HARVEY CREEK MAGNESIA CREEK Date Time 24 Hr Flow NTU Time 24 Hr Flow NTU
27 RAW WATER SEPTEMBER 2014 HARVEY CREEK MAGNESIA CREEK Date Time 24 Hr Flow NTU Time 24 Hr Flow NTU
28 RAW WATER OCTOBER 2014 HARVEY CREEK MAGNESIA CREEK Date Time 24 Hr Flow NTU Time 24 Hr Flow NTU N/A N/A N/A N/A N/A N/A N/A N/A 0.82
29 RAW WATER NOVEMBER 2014 HARVEY CREEK MAGNESIA CREEK Date Time 24 Hr Flow NTU Time 24 Hr Flow NTU N/A N/A N/A N/A N/A N/A N/A N/A N/A N/A N/A N/A N/A
30 RAW WATER DECEMBER 2014 HARVEY CREEK MAGNESIA CREEK Date Time 24 Hr Flow NTU Time 24 Hr Flow NTU N/A N/A N/A N/A N/A N/A N/A N/A N/A N/A N/A N/A N/A N/A N/A
31 TREATED WATER JANUARY 2014 HARVEY MAGNESIA 400 HAR. TANK PRV-3 STORE/CAFÉ LIONS BAY AVE. KELVIN GROVE 100 MAG. TANK PRV-5 BRUNSWICK B. DATE Turbidity CL2 Res. Turbidity CL2 Res. Turbidity CL2 Res. Turbidity CL2 Res. Turbidity CL2 Res. Turbidity CL2 Res. Turbidity CL2 Res. Turbidity CL2 Res. (NTU) (ppm) (NTU) (ppm) (NTU) (ppm) (NTU) (ppm) (NTU) (ppm) (NTU) (ppm) (NTU) (ppm) (NTU) (ppm)
32 TREATED WATER FEBRUARY 2014 HARVEY MAGNESIA 400 HAR. TANK PRV-3 STORE/CAFÉ LIONS BAY AVE. KELVIN GROVE 100 MAG. TANK PRV-5 BRUNSWICK B. DATE Turbidity CL2 Res. Turbidity CL2 Res. Turbidity CL2 Res. Turbidity CL2 Res. Turbidity CL2 Res. Turbidity CL2 Res. Turbidity CL2 Res. Turbidity CL2 Res. (NTU) (ppm) (NTU) (ppm) (NTU) (ppm) (NTU) (ppm) (NTU) (ppm) (NTU) (ppm) (NTU) (ppm) (NTU) (ppm) N/A N/A N/A N/A N/A N/A
33 TREATED WATER MARCH 2014 HARVEY MAGNESIA 400 HAR. TANK PRV-3 STORE/CAFÉ LIONS BAY AVE. KELVIN GROVE 100 MAG. TANK PRV-5 BRUNSWICK B. DATE Turbidity CL2 Res. Turbidity CL2 Res. Turbidity CL2 Res. Turbidity CL2 Res. Turbidity CL2 Res. Turbidity CL2 Res. Turbidity CL2 Res. Turbidity CL2 Res. (NTU) (ppm) (NTU) (ppm) (NTU) (ppm) (NTU) (ppm) (NTU) (ppm) (NTU) (ppm) (NTU) (ppm) (NTU) (ppm)
34 TREATED WATER APRIL 2014 HARVEY MAGNESIA 400 HAR. TANK PRV-3 STORE/CAFÉ LIONS BAY AVE. KELVIN GROVE 100 MAG. TANK PRV-5 BRUNSWICK B. DATE Turbidity CL2 Res. Turbidity CL2 Res. Turbidity CL2 Res. Turbidity CL2 Res. Turbidity CL2 Res. Turbidity CL2 Res. Turbidity CL2 Res. Turbidity CL2 Res. (NTU) (ppm) (NTU) (ppm) (NTU) (ppm) (NTU) (ppm) (NTU) (ppm) (NTU) (ppm) (NTU) (ppm) (NTU) (ppm)
35 TREATED WATER MAY 2014 HARVEY MAGNESIA 400 HAR. TANK PRV-3 STORE/CAFÉ LIONS BAY AVE. KELVIN GROVE 100 MAG. TANK PRV-5 BRUNSWICK B. DATE Turbidity CL2 Res. Turbidity CL2 Res. Turbidity CL2 Res. Turbidity CL2 Res. Turbidity CL2 Res. Turbidity CL2 Res. Turbidity CL2 Res. Turbidity CL2 Res. (NTU) (ppm) (NTU) (ppm) (NTU) (ppm) (NTU) (ppm) (NTU) (ppm) (NTU) (ppm) (NTU) (ppm) (NTU) (ppm)
36 TREATED WATER JUNE 2014 HARVEY MAGNESIA 400 HAR. TANK PRV-3 STORE/CAFÉ LIONS BAY AVE. KELVIN GROVE 100 MAG. TANK PRV-5 BRUNSWICK B. DATE Turbidity CL2 Res. Turbidity CL2 Res. Turbidity CL2 Res. Turbidity CL2 Res. Turbidity CL2 Res. Turbidity CL2 Res. Turbidity CL2 Res. Turbidity CL2 Res. (NTU) (ppm) (NTU) (ppm) (NTU) (ppm) (NTU) (ppm) (NTU) (ppm) (NTU) (ppm) (NTU) (ppm) (NTU) (ppm)
37 TREATED WATER JULY 2014 HARVEY MAGNESIA 400 HAR. TANK PRV-3 STORE/CAFÉ LIONS BAY AVE. KELVIN GROVE 100 MAG. TANK PRV-5 BRUNSWICK B. DATE Turbidity CL2 Res. Turbidity CL2 Res. Turbidity CL2 Res. Turbidity CL2 Res. Turbidity CL2 Res. Turbidity CL2 Res. Turbidity CL2 Res. Turbidity CL2 Res. (NTU) (ppm) (NTU) (ppm) (NTU) (ppm) (NTU) (ppm) (NTU) (ppm) (NTU) (ppm) (NTU) (ppm) (NTU) (ppm)
38 TREATED WATER AUGUST 2014 HARVEY MAGNESIA 400 HAR. TANK PRV-3 STORE/CAFÉ LIONS BAY AVE. KELVIN GROVE 100 MAG. TANK PRV-5 BRUNSWICK B. DATE Turbidity CL2 Res. Turbidity CL2 Res. Turbidity CL2 Res. Turbidity CL2 Res. Turbidity CL2 Res. Turbidity CL2 Res. Turbidity CL2 Res. Turbidity CL2 Res. (NTU) (ppm) (NTU) (ppm) (NTU) (ppm) (NTU) (ppm) (NTU) (ppm) (NTU) (ppm) (NTU) (ppm) (NTU) (ppm)
39 TREATED WATER SEPTEMBER 2014 HARVEY MAGNESIA 400 HAR. TANK PRV-3 STORE/CAFÉ LIONS BAY AVE. KELVIN GROVE 100 MAG. TANK PRV-5 BRUNSWICK B. DATE Turbidity CL2 Res. Turbidity CL2 Res. Turbidity CL2 Res. Turbidity CL2 Res. Turbidity CL2 Res. Turbidity CL2 Res. Turbidity CL2 Res. Turbidity CL2 Res. (NTU) (ppm) (NTU) (ppm) (NTU) (ppm) (NTU) (ppm) (NTU) (ppm) (NTU) (ppm) (NTU) (ppm) (NTU) (ppm)
40 TREATED WATER OCTOBER 2014 HARVEY MAGNESIA 400 HAR. TANK PRV-3 STORE/CAFÉ LIONS BAY AVE. KELVIN GROVE 100 MAG. TANK PRV-5 BRUNSWICK B. DATE Turbidity CL2 Res. Turbidity CL2 Res. Turbidity CL2 Res. Turbidity CL2 Res. Turbidity CL2 Res. Turbidity CL2 Res. Turbidity CL2 Res. Turbidity CL2 Res. (NTU) (ppm) (NTU) (ppm) (NTU) (ppm) (NTU) (ppm) (NTU) (ppm) (NTU) (ppm) (NTU) (ppm) (NTU) (ppm)
41 TREATED WATER NOVEMBER 2014 HARVEY MAGNESIA 400 HAR. TANK PRV-3 STORE/CAFÉ LIONS BAY AVE. KELVIN GROVE 100 MAG. TANK PRV-5 BRUNSWICK B. DATE Turbidity CL2 Res. Turbidity CL2 Res. Turbidity CL2 Res. Turbidity CL2 Res. Turbidity CL2 Res. Turbidity CL2 Res. Turbidity CL2 Res. Turbidity CL2 Res. (NTU) (ppm) (NTU) (ppm) (NTU) (ppm) (NTU) (ppm) (NTU) (ppm) (NTU) (ppm) (NTU) (ppm) (NTU) (ppm) N/A N/A
42 TREATED WATER DECEMBER 2014 HARVEY MAGNESIA 400 HAR. TANK PRV-3 STORE/CAFÉ LIONS BAY AVE. KELVIN GROVE 100 MAG. TANK PRV-5 BRUNSWICK B. DATE Turbidity CL2 Res. Turbidity CL2 Res. Turbidity CL2 Res. Turbidity CL2 Res. Turbidity CL2 Res. Turbidity CL2 Res. Turbidity CL2 Res. Turbidity CL2 Res. (NTU) (ppm) (NTU) (ppm) (NTU) (ppm) (NTU) (ppm) (NTU) (ppm) (NTU) (ppm) (NTU) (ppm) (NTU) (ppm) N/A N/A
43 APPENDIX C: 3-YEAR COMPARISON GRAPHS TURBIDITY AND CHLORINE RESIDUALS APPENDIX C: 3-YEAR COMPARISON GRAPHS TURBIDITY AND CHLORINE RESIDUALS
44 Harvey Reservoir Tank Turbidity January February March April May June July August September October November December
45 Harvey Reservoir Tank Chlorine Residual January February March April May June July August September October November December
46 PRV-3 Turbidity January February March April May June July August September October November December
47 PRV-3 Chlorine Residual January February March April May June July August September October November December
48 Lions Bay Cafe Turbidity January February March April May June July August September October November December
49 Lions Bay Cafe Chlorine Residual January February March April May June July August September October November December
50 Lions Bay Avenue Turbidity January February March April May June July August September October November December
51 Lions Bay Avenue Chlorine Residual January February March April May June July August September October November December
52 Kelvin Grove Turbidity January February March April May June July August September October November December
53 Kelvin Grove Chlorine Residual January February March April May June July August September October November December
54 Magnesia Reservior Tank Turbidity January February March April May June July August September October November December
55 Magnesia Reservoir Tank Chlorine Residual January February March April May June July August September October November December
56 PRV-5 Turbidity January February March April May June July August September October November December
57 PRV-5 Chlorine Residual January February March April May June July August September October November December
58 Brunswick Beach Turbidity January February March April May June July August September October November December
59 Brunswick Beach Chlorine Residual January February March April May June July August September October November December
60 Harvey Creek Raw Source Water Turbidity January February March April May June July August September October November December
61 Magnesia Creek Source Water Turbidity January February March April May June July August September October November December
62 APPENDIX D: METALS & WATER CHEMISTRY TEST RESULTS APPENDIX D: METALS & WATER CHEMISTRY TEST RESULTS
63
64
65
66
67
68
69
70
71
72
73
74
75
76
77
78
79
80
81
82
83
84
85
86