A landscape perspective of stream food webs: Exploring cumulative effects and defining biotic thresholds
|
|
|
- Cassandra Richard
- 5 years ago
- Views:
Transcription

1 A landscape perspective of stream food webs: Exploring cumulative effects and defining biotic thresholds
2 Objectives To better understand how stream food webs are embedded in their landscapes To quantify stream food webs across the watershed Explore the effects of watershed characteristics on stream food webs and energy fluxes at different spatial scales To identify thresholds below which critical habitat coupling mechanisms are disabled and stream food webs become compromised
3 Experimental Approach Mica Creek Beaver Creek North Fork of Clearwater Elk Creek East Fork of Potlatch? Systematic sampling n=7 per watershed Nested experimental design incorporating three spatial scales: upper watershed, mid + upper watershed, and entire watershed

4
5
6


7 20x bankfull 40m 600m

8 Food Webs & Energy Exchange riparian timber vegetation harvest drainage area riparian channel geometry road density stream water temperature energy exchange climate change forest type water quality habitat condition sedimentation elevation/lat-long watershed


9 Harvest blocks extent and age Percent wetlands within watershed Road density Temperature and precipitation Mean stand age of forested area % conifer/% deciduous Riparian buffer extent and age Width of riparian zone Stream order Sediment loading Drainage area Elevation Latitude and longitude Watershed Scale
 Flow mapping Bankfull width DO, ph, Conductivity Bankfull depth Buffer vegetation layers Channel canopy Buffer % conifers/% deciduous LWD/Leaf")
10 Reach Scale Stream slope Substrate characteristics Buffer dominant tree species Stream temperature Age of buffer dominant tree species Rapid geomorphic condition assessment Rapid habitat assessment (RBP/RHA) Flow mapping Bankfull width DO, ph, Conductivity Bankfull depth Buffer vegetation layers Channel canopy Buffer % conifers/% deciduous LWD/Leaf cover
11 Biological Data Collection of biota will serve to: characterize and compare riverine faunal assemblages model stream food webs trace habitat-coupling linkages To accomplish this, we are surveying fish, macro, and bird assemblages; investigating focal species; and sampling potential food sources to isolate isotopic signatures.
12 Food Webs advantages: integrate stream ecosystem target interruptions in functional mechanisms pattern vs. process productivity energy exchanges
13 Riparian-Stream Food Web Connectivity Baxter et al from Baxter et a. 2005
14 Riparian-Stream Food Web Connectivity Baxter et al. 2005

15
16 Macroinvertebrates Across-community comparisons Food web analysis Stable isotopes Terrestrial invertebrate fall into the stream at each reach will be also be quantified Quantitative analysis of benthic CPOM storage and epilithic algae
17 Riparian-Stream Food Web Connectivity Baxter et al. 2005


18
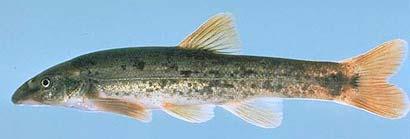
19 Fish Species Bull trout Brook trout Cutthroat trout Rainbow trout Cutbow trout Kokanee salmon Mountain whitefish Northern pikeminnow Speckled dace Longnose dace Torrent sculpin Slimy sculpin Shorthead sculpin Mottled sculpin Salvelinus confluentus Salvelinus frontinalis Oncorhynchus clarkii Oncorhynchus mykiss Oncorhynchus mykiss x clarkii Oncorhynchus nerka Prosopium williamsoni Ptychocheilus oregonensis Rhinichthys osculus Rhinichthys cataractae Cottus rhotheus Cottus cognatus Cottus confusus Cottus bairdi

20 Fish Across-community community comparisons Food web analysis using brook trout Stable isotope and gut-content analyses


21 terrestrial plant material terrestrial invertebrates stream invertebrates

22 Riparian-Stream Food Web Connectivity Baxter et al. 2005


23


24 Bird Guilds terrestrial invertebrates aerial insects stream invertebrates emergent aquatic insects fish
25 Preliminary Results differences across sites in: complexity of trophic structure across sites cross-ecosystem food subsidies American Dippers and Swallows dietary shift fish community native vs. non-native native species community diversity relative dominance of feeding guilds riparian condition and heterogeneity local characteristics & conditions temperature regime

26 07 lab work and analysis 1-22 additional watersheds model building thresholds cumulative effects
27 < 2 nd Order, Ephemeral 2 nd -3 rd Order Flumes 1, 2, Watershed: GIS/Remote Sensing Only GIS/Remote Sensing and Field Sampling Scale A: Upper Watershed Flumes 1, 2, 3 Flumes 1, 2, 3 Flumes 5,6 Flumes 5, 6 Scale B: Middle and Upper Watershed Flume 7 or below Scale C: Entire Watershed
28 Analysis A variety of statistical methods will be used to address our objectives. Contrasts in aquatic fish and bird assemblages across the three scales will be explored using non-metric multidimensional scaling (NMS). Comparisons of species richness, abundance, and biomass between the three scales will be made using analysis of variance (ANOVA). Habitat and food resource data will be compared among reach type and stream order using multivariate analysis of variance (MANOVA), followed by univariate ANOVA s when significant differences are detected. To quantify the effects of watershed characteristics, stream habitat, and food resources on stream food webs at different spatial scales; we will create a series of models (based on information theoretic approach), one set for each increasing spatial scale. These models will then be compared across spatial l scales to determine if the same factors exert similar cumulative influences s on stream food webs across spatial scales. First, we will create a set of a priori models, having selected independent. Alternatively, we may use principal components analysis (PCA) to extract gradients in watershed characteristics, stream habitat, and food resources, and a follow this with multiple regression. Finally, we will use changepoint analysis to look for physical conditions that effect threshold responses in stream food web structure across the watershed.
29 Non-metric Multi-dimensional Scaling: Ordination on Fish Communities in Lake Superior Streams NMDS Axis 3 Brook stickleback %embedded %fines %clay %undercut bank depth of fines C. %riparian meadow %detritus shiner Trout-perch chub Brown fragmentation %storage trout %mature water J. Brook Slimy forest temp. darter trout sculpin Ln. maximum dace Rainbow %riparian trout rock dissolved %algae % boulder oxygen %cobble region %rocky substrate %riffle Original vs. Ordination Distance Axis r 2 Increment Cumulative fish % boulder cover Environmental and Fish Vectors - r > 0.5 NMDS Axis 1
30 Changepoint Analysis Response Y mean Predictor X Courtesy of Naomi Detenbeck, US EPA Mid-Continent Ecology Division