Demand Response as a Power Sector Resource
|
|
|
- Ginger Melton
- 5 years ago
- Views:
Transcription


1 Demand Response as a Power Sector Resource Richard Cowart Director, European Programmes Energy Savings Coalition July 4, 2013 The Regulatory Assistance Project rue de la Science 23 B Brussels Belgium Phone: web:
2 Regulatory Assistance Project (RAP) RAP is a global, non-profit team of experts providing technical and policy assistance to government officials on energy and environmental issues. RAP has advised governments in more than 30 countries and 50+ provinces and states, and now has major programmes in the US, China, India and Europe. Our European offices and staff are in Brussels, Berlin, Warsaw, and the UK. Richard Cowart is the Director of European Programmes for RAP, based in Brussels. A member of the IEA DSM Executive Committee, he served 12 years as Chair of the Vermont PSB (utilities regulator), Chaired the US regulators' Committee on Energy & Environment, and the National Council on Competition and the Electric Industry. He is an advisor to the New York Independent System Operator, and Chair of the Electricity Advisory Committee of the US Department of Energy. Contacts : rcowart@raponline.org
3 Major points today 1. What is Demand Response (DR)? Types of DR resources 2. Why DR? Multiple values of efficiency and flexible resources 3. New challenge -- Integrating growing fractions of renewables 4. New opportunity?: Smart Grids, Dynamic Pricing, and DR 5. How to capture DR? Market options and regulatory reforms that can tap DR resources 3
4 (1) What Is Demand Response? Much more than traditional peak load management
5 Traditional DR: Peak Shaving Source: 5
6 Demand Response Definitions evolve Changes in electric usage by end-use customers from their normal consumption patterns in response to changes in the price of electricity over time, or to incentive payments designed to induce lower electricity use at times of high wholesale market prices or when system reliability is jeopardized. US FERC 2008 Demand Response Assessment Demand response -- Customer loads that can be modulated up or down in real time in response to wholesale market conditions, expressed either in wholesale prices, via frequency or voltage fluctuations, or through arrangements allowing direct control by the system operator or third party aggregator. -- RAP, Beyond Capacity Markets

7 Using Demand Response to Shape Load Source: 7

8 Demand Response: Change in Load Relative to Baseline in Response to System Needs 8

9 How is DR actually delivered?

10 Electric Heat Pumps as DR Demand response with thermal storage is an untapped resource for flexible response Can quickly absorb unexpected changes in load and renewable energy generation Commercially available technologies exist that add communication and control capability to enable and disable electric water and space heaters for fast response Requires high-speed, two-way communication infrastructure 10


11 Industrial DSM now over 27,000 MW US Data: Pike Research


12 . EV costs $.76 per gallon at average power rates in PJM and $.60 if charged off-peak 12


13 Uncontrolled EV charging: no price signals or automated control technology Controlled EV charging: price signal plus automated control technology 13
14 (2) Why DR? Multiple Values of Efficiency and Flexible Resources
, building durability, health & safety 14 12 10 8 6 4 2 0 Avoided Reserves Line Losses Distribution Capacity Transmission")
15 Cents per kwh Efficiency and DR Have Many Power System Benefits Production Energy Production Capacity Avoided Emissions Transmission Capacity Distribution Capacity Line Loss Reduction Avoided Reserves Plus Non-Energy Benefits including: Add l resource benefits (water), building durability, health & safety Avoided Reserves Line Losses Distribution Capacity Transmission Capacity Avoided Emissions Production Energy Production Capacity * Note: numbers presented in graph are Illustrative
16 Different views of the absence of demand. 16

17 Efficiency and Load Management Walking hand-in-hand 17
18 Benefits of Demand Response: Emergency Reserves Demand response can provide ancillary services that include various reserve services, dynamic system regulation, and load-following capabilities that can deliver value to the grid during any hour of the year. Demand Response Deployment of Emergency Reserves in Texas on August 4, 2011 Source: ERCOT EILS Deployment. QMWG
")
19 Benefits of DR: Managing peak power costs (in this case, 16% of annual costs arise in 1% of the hours of the year) 19
20 DR lowers power prices for everyone 20

21 Demand Response via Thermal Storage
22 Low-Tech Storage: Water Heaters Can Provide Rapid Response Frequency Regulation
23 Benefits of Demand Response: Avoiding T&D Upgrades Con Edison in New York City Seeking local distribution peak reductions Goal was to eliminate 149 MW across several areas by 2012 Decided to use demand resources - estimated to be less expensive and would avoid major disruptions in city (e.g. digging up streets) Employed EE, DG, thermal storage, fuel-switching Used competitive bidding by ESCOs to deliver Extensive M&V Costs born by all customers thru regulated (e.g., distribution network operator) tariffs Utility reports savings of over $1 Billion! 23

24 Benefits of Demand Response Demand Response Can Reduce Grid Investments and Minimize Curtailment of Low-Carbon Resources Source: European Climate Foundation, Roadmap
25 (3) New Challenge: Integrating Variable Renewables Theme: DR and EE are essential partners with RES for a low-emissions, affordable power sector
26 The Declining Market Value of Variable Renewable Energy with Penetration: Why Current Discussions on Integration Costs Are Incomplete Ryan H. Wiser Regulatory Assistance Project June 19, 2013 Environmental Energy Technologies Division Energy Analysis Department
 Effective Marginal Capacity Credit (%) 0% -> 5% 2.8 5.8 48% 15% -> 20% 0.4 5.9 7% Environmental Energy Technologies Division Energy Analysis Department")
27 Investment and dispatch decisions with increasing PV penetration PV Penetration Incremental Reduction in Non-PV Capacity (GW) Incremental Increase in Nameplate PV (GW) Effective Marginal Capacity Credit (%) 0% -> 5% % 15% -> 20% % Environmental Energy Technologies Division Energy Analysis Department
28 Marginal value of variable generation varies with technology and penetration Declining Capacity Value Declining Energy Value Declining Capacity Value Declining Energy Value Declining Capacity Value Declining Energy Value Declining Capacity Value: System becomes increasingly energy-limited in winter Environmental Energy Technologies Division Energy Analysis Department
 +37 (120) +34 (110) +27 (82) +13 (39) +8 (24) +4 (11) + Energy Value +54 +53 +52 +49 +45 +41 +27 + DA Forecast")
29 PV PV Marginal value of PV is high at low penetration due to high capacity value Component ($/MWh) 0% PV 2.5% PV 5% PV 10% PV 15% PV 20% PV 30% PV + Capacity Value (Capacity Value in $/kw-yr) +37 (120) +34 (110) +27 (82) +13 (39) +8 (24) +4 (11) + Energy Value DA Forecast Error Ancillary Services (4) = Marginal Economic Value Single-axis PV and CSP without TES have similar relative magnitude of different components and similar changes in value of components with increasing penetration. Environmental Energy Technologies Division Energy Analysis Department
30 These effects are not an artifact of this specific study s modeling approach Source: Hirth (2013) Environmental Energy Technologies Division Energy Analysis Department

31 The Challenge of Renewables Variability Net demand: gross demand minus demand effectively served by lowmarginal-cost, uncontrollable supply. 31

32 Net demand: more volatile than overall demand, lacking a repeatable pattern. Demand and availability of variable renewables can be moving in opposite directions 24/7/365 A challenging week for West Connect, USA, assuming 35% wind penetration 32

33 Net Demand Projected for Germany, 24 th calendar week in 2020 Source: Deutsche Umwelthilfe 33
34 (4) New Opportunity: Smart Grids, Dynamic Pricing, and Demand Response
35 Smart grid introduces new pricing possibilities and more opportunity for DR Flat energy rates Rates do not vary by time or wholesale market cost and include an insurance premium to protect customers from volatility (supplier bears price risk in absence of FAC). Tiered rates (inclining or declining blocks) The cost per unit of electricity increases/decreases at defined consumption thresholds Time of use (TOU) rates (time of day, seasonal). Divides the period (day) into time periods and provides a schedule of rates for each period (e.g., peak, off-peak, shoulder). Critical peak pricing (CPP) Typically an overlay on TOU pricing. During times of system stress or high cost (i.e., critical peak [CP] events), price rises to a very high level (either administratively set or market-determined) to reflect the very high but short-term cost of generating or purchasing electricity at times of shortage or peak demand. Customers are notified in advance of a CP event and the number of events per year is typically capped. Peak-time rebate (PTR, also critical peak rebate or CPR) Participants are paid for load reductions (relative to what they would have otherwise used) during critical peak events. Real-time pricing (RTP) rates Prices may change as often as hourly. Price signal is provided to the user in advance (or at the beginning) of the period to which it applies, and it reflects the actual time- and circumstance-dependent cost of generating or purchasing electricity. Variable peak pricing (VPP) is a combination of TOU and RTP, wherein periods and the off-peak price are set, but the peak period price varies with the (day-ahead) market. 35

36 France -- EDF Tempo Tariff Customers are told day-ahead what color tomorrow s rates will be (note peak period is 6am to 10 pm; focus is winter heating period) Since 1996, now 400,000 customers Total reduction 450MW (45% reduction on red days, 10% white days On average enrolled customers save 10% Customer options for automatic controls on some appliances 36

37 Smart Grid Opens the Door to New DR Options 37

38 Source: Faruqui, et al. (2012). Time-Varying and Dynamic Rate Design. Montpelier, VT: RAP. 38
39 Source: Faruqui, et al. (2012). Time-Varying and Dynamic Rate Design. Montpelier, VT: RAP. 39

40 40

41 Traditional vs. Smart Grid Demand Response 41

42 California Source: Faruqui, et al. (2012). Time-Varying and Dynamic Rate Design. Montpelier, VT: RAP. 42
43 Some Lessons Learned from Pilots Enabling technology enhances the beneficial impacts of time-varying rates Peak savings in some pilots persisted for several years Low-income customers can respond to price signals, although not necessarily to the degree or in the numbers that other customer classes can 43
44 (4) Capturing the value of DR: market options and regulatory reforms

45 Types of DR Programs 45
46 Examples of Regulatory Barriers to Demand Response across the EU (Source: SEDC Snapshot 2011) A 24/7 resource availability requirement for peak consumption programs (Austria) A 16 hour load reduction duration requirement (Slovenia) Lack of regulation or applicability of load reduction measurements (most markets) Minimal single bid requirements ranging from 4 MW in Ireland to 25 MW or even 50MW (France) Lack of appropriate base load measurement requirements (GB & other) Lack of clear payment and contract structures for demand reductions (most markets) Lack of information on intraday prices making it impossible to calculate the value of a Demand Response bid causing investment and payment uncertainty (Nordpool) Demand side resources barred from existing capacity markets (Poland, Greece) The aggregation of Commercial/Industrial loads is not allowed (Italy) 46
47 Markets that value what is needed (1) Recognize the value of efficiency Allow energy efficiency to participate in capacity markets Standardize M&V procedures and capacity values for a menu of common EE measures Consider location-specific EE as a competitive alternative to transmission 47
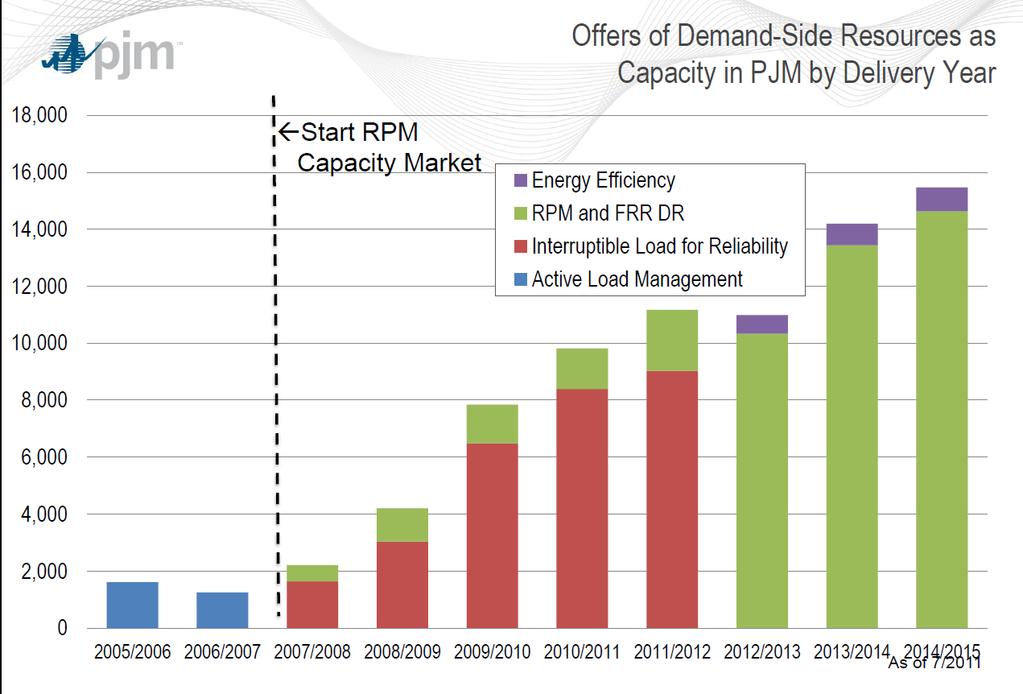
48 Competitive example: EE & DR Bidding in Regional Capacity Markets Issue: Power system needs reliable capacity on a forwards basis (to avoid future capacity crisis) Generator proposal: Pay for Generator capacity in advance, for 10-year forward period Better solution: Let supply and demand-reduction also bid to meet growth needs First auction (New England ISO) 2007: demand resources including EE won 2/3rds of the bids for new capacity & lowered the clearing price PJM auction (for 2012/2013) DSM bids lowered the clearing price by 90% (from ~$179MW/day to $16.46 per MW/day) Demand-side winners include utilities, ESCOs and state programs

49 Growth of Demand Response Resources in New England Hurley, et al. (2013). Demand Response as a Power System Resource: Program Designs, Performance, and Lessons Learned in the United States. Montpelier, VT: RAP. 49
50

51
52 Markets that value what is needed (2) Update system operations to unlock flexibility in the short term Upgrade scheduling, dispatch and weather forecasting processes Consolidate/integrate balancing areas Access dispatchability of renewable energy assets Employ day-ahead markets for current ancillary services; Expand the role of demand response 52
53 Markets that value what is needed (3) Create investment incentives to ensure flexibility in the long term Develop tools to better forecast net demand and forward value of critical capabilities Adapt forward mechanisms to send investment signals that will capture the value of flexible resources (demand and supply) Encourage DR aggregators, flexible generation providers and similar new entrants wherever possible consistent with overall market structure 53


54 DR is Flexible and Fast New Entrant Example ENBALA Power Network Client Pool beginning to respond to ISO signal. 54
55 55
56 56

57 The aggregate response of each resource in the network is compiled to form a unified regulation response. 57
 Many other reports on DR, EE,")
58 Questions? See Beyond Capacity Markets Delivering Capability Resources to Europe s Decarbonised Power System (Gottstein and Skillings, RAP-2012) Many other reports on DR, EE, and Power Market Design on the RAP website Richard Cowart, Regulatory Assistance Project Posted at questions to rcowart@raponline.com