The Chesapeake Bay TMDL
|
|
|
- Lizbeth Blankenship
- 5 years ago
- Views:
Transcription


1 The Chesapeake Bay TMDL Introduction to a Pollution Diet for 17 Million Chesapeake Bay Watershed Residents Rich Batiuk Associate Director for Science U.S. EPA Region 3 Chesapeake Bay Program Office March 29,


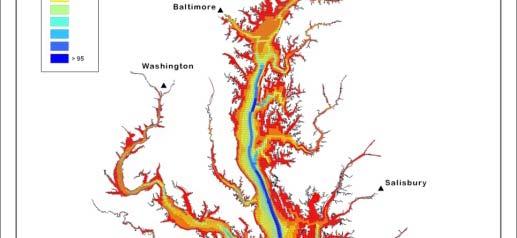
2 Low to no dissolved oxygen in the Bay and tidal rivers every summer 2


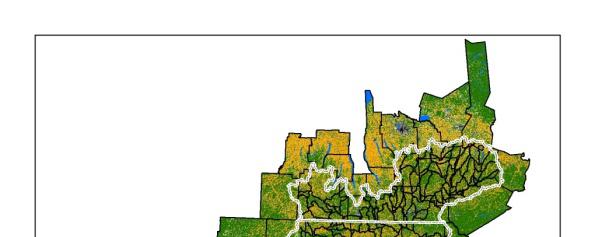
3 Chesapeake Bay and Watershed Water Quality Monitoring Networks


4


5
6 WV 3% Nutrient Loads by State DE 3% DC 1% WV 4% DE 2% DC 1% VA 26% PA 41% MD 20% NY 6% VA 45% MD 19% PA 24% NY 5% Nitrogen* Phosphorus 6
7


8 Setting the Pollution Diet 8
9 TMDL and WIP Development Schedule: Oct 2009 Major basin jurisdiction loading targets November- Final WIPs December 2010 Final November- December TMDL December Bay TMDL Public 2010 Established Meetings 2009 Phase II Provide Local Planning Targets Draft Phase I Local Program Watershed Capacity/Gap for smaller Watershed Implementation Evaluation Watersheds, Implementation Plans: Starting Counties, Plans: November 2009 Sept Sources 2-year July 1 and August 13 Allocations Starting milestones, reporting, Draft TMDL 2011 modeling, Public monitoring Sept. 24, 2010 Review (45 days) And Comment % of Practices in Place - 9 Phase III WIPs to meet 2025 Goal
10


11 Chesapeake Bay Airshed Model Chesapeake Bay Land Change Model Chesapeake Bay Watershed Model Chesapeake Bay Water Quality and Sediment Transport Model


12 Bay Dissolved Oxygen Criteria Migratory Fish Spawning & Nursery Areas 6 Shallow and Open Water Areas Minimum Amount of Oxygen (mg/l) Needed to Survive by Species 5 4 Striped Bass: 5 6 American Shad: 5 White Perch: 5 Yellow Perch: 5 Hard Clams: 5 Deep Water 3 Alewife: Crabs: 3 Bay Anchovy: 3 Deep Channel 1 Spot: 2 0 Worms: 1
13 Dissolved Oxygen Criteria Attainment 45 Num mber of Segments in DO Violation Basin wide load is 190 N and 12.7 P (MPY) Open Water Violations Deep Water Violations Deep Channel Violations Base 2009 Target Tributary Loading Loading Loading E3 All Scenario Calibration Scenario Load A Strategy Scenario Scenario Scenario Scenario Forest 342TN 309TN 248TN 200TN 191TN 190TN 179TN 170TN 141TN 58TN 24.1TP 19.5TP 16.6TP 15.0TP 14.4TP 12.7TP 12.0TP 11.3TP 8.5TP 4.4TP


14 Relative Effect of a Pound of Pollution on Bay Water Quality 14
15 Relative effectiveness (Riverine * Estuarine Delivery) Major River Basin by Jurisdiction Relative Impact on Bay Water Quality UpES, MD UpES, DE MidES, MD Susq, MD LowES, MD Wsh, MD UpES, PA LowES, DE Susq, PA PxtB, MD EshVA, VA PotB, DC MidES, DE PotA, DC PotB, MD PotB, VA Susq, NY RapB, VA PotA, MD YrkB, VA PotA, VA Wsh, PA PotA, WV PotA, PA PxtA, MD JmsB, VA RapA, VA YrkA, VA JmsA, VA JmsA, WV 15
16 Pre-decisional not for release under FOIA
17 17
18 18


19 Pollution Diet by River Pollution Diet by State
20 Jurisdictions Watershed Implementation Plans 92 Individual TMDLs
21 Phase I WIP Phase II WIP


22

23 Overview of Accountability Process Federal Actions Watershed if insufficient Watershed Model and Monitor Implementation Implementation Plans or 2-year to assess progress Plans identify milestones nutrient and sediment targets that meet water quality standards. Plans include: 1. Evaluation of Program Capacity necessary to fully restore water quality Chesapeake Bay TMDL: Set Pollution Reduction Goals for Point and Non-point Sources to Meet Bay Water Quality Standards 2-Year Milestones with program enhancements and nutrient and sediment reduction commitments 2. Identification of Gaps between needed and existing program capacity 3. Schedule and Strategies t to enhance programs and reduce nutrients and sediment Year
24 Three Tiers of EPA Oversight and Actions Remaining Backstops, Allocations & Actions EPA reduced or removed most federal backstop measures in the final Bay TMDL with just a few exceptions Ongoing Oversight for ALL Chesapeake Bay Jurisdictions ongoing program and permit reviews and assessments of TMDL and WIP implementation through Phased II and III WIPs and 2 year milestones (most Sectors fall here) Enhanced doversight Indication that t EPA may consider backstop allocations and adjustments if Phase II WIPs don t show progress (VA urban stormwater, PA agriculture and wastewater, WV urban stormwater and wastewater) Backstop Allocations & Adjustments These backstops were included in the final Bay TMDL (NY wastewater; PA urban stormwater; and WV agriculture) 24
25 No Backstop Allocation Backstop Allocations, Adjustments, and/or Actions NY Agriculture Stormwater Wastewater Ongoing Oversight Enhanced Oversight Backstop Adjustments Backstop Allocations and and dactions and dactions and dactions Actions PA Agriculture Possible future backstop adjustments VA Stormwater Wastewater Agriculture Stormwater Wastewater Individual allocations; Possible future backstop allocations Possible future backstop adjustments Shift 50% stormwater from LA to WLA WV Agriculture Shift 75% AFOs from LA to WLA Stormwater Possible future backstop adjustments Reduce wastewater WLA to meet statewide allocation Wastewater t Individual id allocations; Possible future backstop allocations 25 **Note: Jurisdictions not included in table have ongoing oversight for all agriculture, urban stormwater and wastewater.


26 Website 26


27 Questions 27
28 Rich Batiuk Associate Director for Science U.S. Environmental Protection Agency Chesapeake Bay Program Office