Session 2: Key contributions from observational campaigns: CalNEX/IONS, DISCOVER-AQ, San Joaquin Valley APCD-funded Chews Ridge research, etc.
|
|
|
- Thomasina Sibyl Gaines
- 5 years ago
- Views:
Transcription

1 Session 2: Key contributions from observational campaigns: CalNEX/IONS, DISCOVER-AQ, San Joaquin Valley APCD-funded Chews Ridge research, etc. Owen R. Cooper CIRES, University of Colorado, Boulder NOAA Earth System Research Laboratory, Boulder
2 U. of Colorado/NOAA


3 The second DISCOVER-AQ campaign occurred in the California s San Joaquin valley in January-February, The focus was on particulate matter pollution. Final results are not yet available.
4


5 NOAA P3 flight off the California coast, May 11, 2002

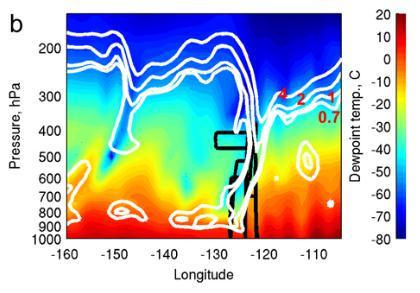
6 Observations from the TOPAZ airborne ozone lidar aboard the NOAA Twin Otter on May 29. Shown is a north-south transect 10 km west of Joshua Tree National Park. The solid black curve shows the May 29 ozonesonde profile.


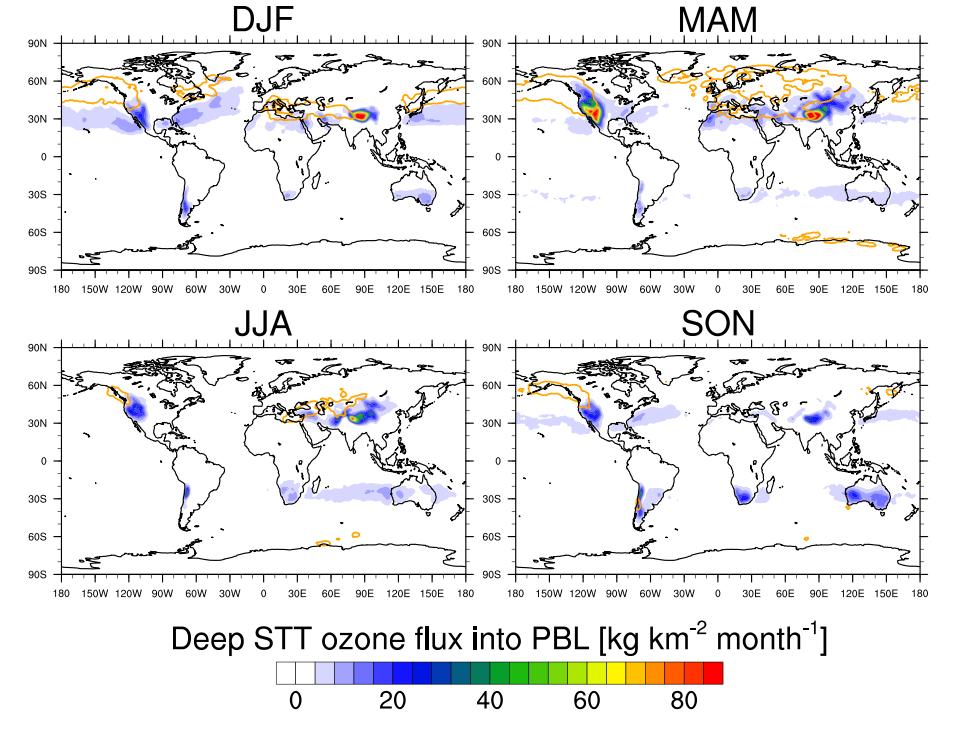
7 Continental U.S. distributions of median stratospheric contribution to MDA8 surface ozone from April June 2010 as estimated by the NOAA GFDL AM3 model.


8
9 Tracer correlations from aircraft measurements can be used to identify times when TAO reaches the surface. During CALNEX free tropospheric ozone was identified in: LA Basin surface (required a surface site) San Joaquin Valley planetary boundary layer High desert planetary boundary layer Challenges to this approach: - Aircraft observations are expensive and require several chemical tracers - Instrumented ground sites are also required - Still difficult to distinguish between TAO and locally produced ozone

10 Tropospheric ozone monitoring in western North America Routine in situ ozone measurements from Earth s surface to the tropopause are made at only 5 ozonesonde sites in western North America Only Trinidad Head on the west coast is representative of baseline ozone. baseline ozone - ozone measured at a location with no recent influence from local pollution sources [WMO GAW definition]. Science Questions: 1) Is Trinidad Head representative of baseline ozone at other coastal sites? 2) What are the anthropogenic NOx emission sources associated with baseline ozone? 3) Once baseline ozone comes ashore, where does it go?


11 IONS ozonesonde networks (Intercontinental Chemical Transport Experiment Ozonesonde Network Study) Experiment Season Location Reference IONS Summer eastern N. America IONS Spring Central N. America IONS Summer Central N. America ARCIONS Spring/ Summer northern N. America IONS Late spring western N. America A. M. Thompson et al., JGR 2007 A. M. Thompson et al, ACP 2008 O. R. Cooper et al., JGR 2007 S. J. Oltmans et al., Atmos Environ. 2010
![California s coastal topography affects ozone transport: Coastal mountains impede the transport of marine boundary layer air into California at Trinidad Head and Pt. Sur [Parrish et al., 2010].](/docs-images/85/91698604/images/12-0.jpg "Relatively low topography allows air at Pt. Reyes to enter the Central Valley in the vicinity of The Carquinez Strait [Bao et al.")
12 California s coastal topography affects ozone transport: Coastal mountains impede the transport of marine boundary layer air into California at Trinidad Head and Pt. Sur [Parrish et al., 2010]. Relatively low topography allows air at Pt. Reyes to enter the Central Valley in the vicinity of The Carquinez Strait [Bao et al., 2008]. Bao, J.-W. et al. (2008), Observed and WRFsimulated low-level winds in a high-ozone episode during the Central California Ozone Study, J. Applied Met. Clim., 47, Parrish, D. et al. (2010), Impact of transported background ozone inflow on summertime air quality in a California ozone exceedance area, Atmos. Chem. Phys., 10,
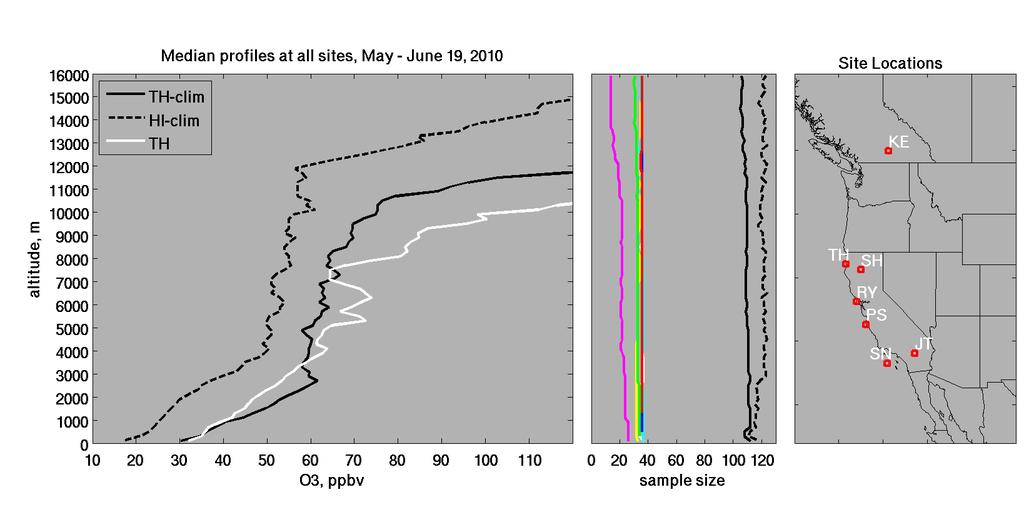
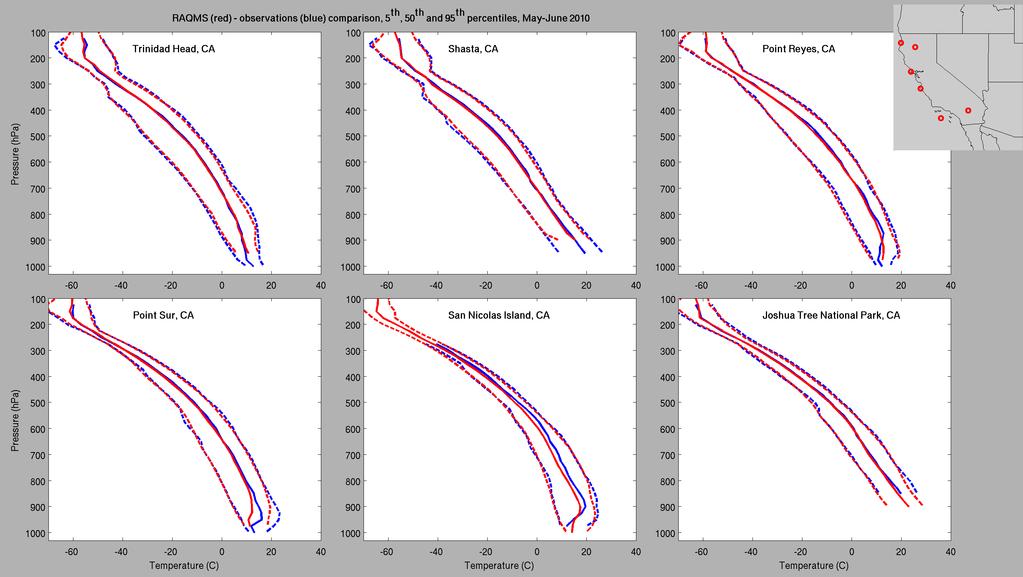
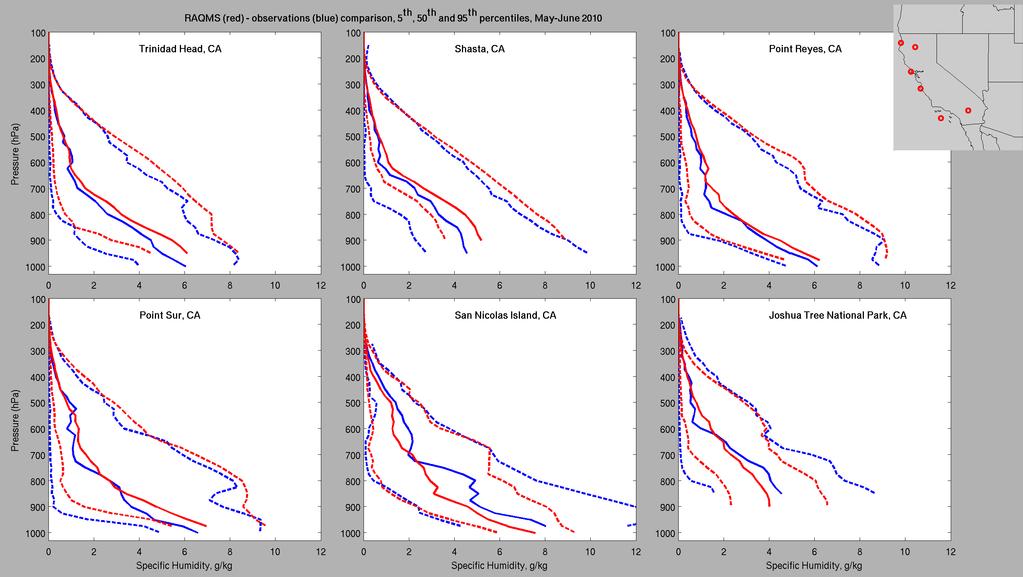
13 IONS-2010 ozonesonde network Near daily ozonesondes were launched from 7 sites between May 10 - June 19, A total of 230 sondes were launched, the most in any western North America field campaign. Funding, operations and support provided by: NOAA ESRL Health of the Atmosphere Program NASA Tropospheric Chemistry Program U. S. Navy Environment Canada NOAA National Weather Service National Park Service California State Parks Naval Postgraduate School (Monterey) Federal Aviation Administration
14
15
16
17
18
19
20
21
22 -9% +2% +4% Percent difference in total mass of ozone per km (0-8 km), for southern sites compared to Trinidad Head.
, for southern sites compared to Trinidad")
23 +14% +18% +9% Percent difference in total mass of ozone per km (0-2 km), for southern sites compared to Trinidad Head.

24 Baseline ozone determined by removing all measurements with a 5-day North America NO x tracer > 350 pptv. -4% -3% -1% 0% Decrease in baseline ozone is calculated in units of: mpa O3 km -1.
25 ozone, ppbv ozone, ppbv
26 ozone, ppbv ozone, ppbv Percent difference in total mass of ozone per km (0-5 km), for inland sites in comparison to coastal sites at similar latitude. +19% +3% +6% +1%
27 ozone, ppbv ozone, ppbv Percent difference in total mass of ozone per km (0-2.5 km), for inland sites in comparison to coastal sites at similar latitude. +28% +11% +19% +4%

28 ozone, ppbv ozone, ppbv Percent difference in total mass of ozone in the lowest km of the atmosphere, for inland sites in comparison to coastal sites at similar latitude. +31% +29% +37% +14%
29 +33% +23% Percent difference in total mass of ozone per km (0-3.4 km a.s.l.) for: LA Basin and Joshua Tree compared to San Nicolas Island.

30 ozone, ppbv +42% +31% Percent difference in total mass of ozone per km (0-1.0 km a.g.l.) for: LA Basin and Joshua Tree compared to San Nicolas Island.

31 Impact of baseline ozone on the surface of the United States
32 IONS-2010 ozonesondes
33 IONS-2010 ozonesondes
34 IONS-2010 ozonesondes

35
36
37 Ozone Network Design - Goal of providing observations to evaluate the models that estimate TAO at the surface - What observations are currently available? - What additional observations are required for California, while still being realistic in terms of funding?
38 Locations of current EPA ozone monitors, mainly urban
, Mt. Bachelor (D.")
39 Western North America: Routine O 3 measurements 21 Rural surface ozone sites: EPA CASTNET National Park Service, Trinidad Head (NOAA), Mt. Bachelor (D. Jaffe, U Washington) Chews Ridge (Ian Faloona, UC)
 weekly ozonesondes Table Mountain NASA JPL lidar, 3 km -")
40 Western North America: Routine meteorological measurements Hourly surface observations at dozens of sites 18 rawinsonde sites, launched twice daily at 4:00 and 16:00 PST Ozone profiles at: Trinidad Head (NOAA) weekly ozonesondes Table Mountain NASA JPL lidar, 3 km - stratosphere


41 One of TOLNet s goals: Advance our understanding of processes controlling regional background atmospheric composition (including STE and long range transport) and their effect on surface air quality to prepare for the GEO-CAPE era.


42 NOAA Earth System Research Lab Aircraft Program Greenhouse gases plus ozone up to 8 km

43 Scientific Aviation Dr. Stephen Conley CO2, CH4, and ozone among other trace gases up to 8 km

44
45


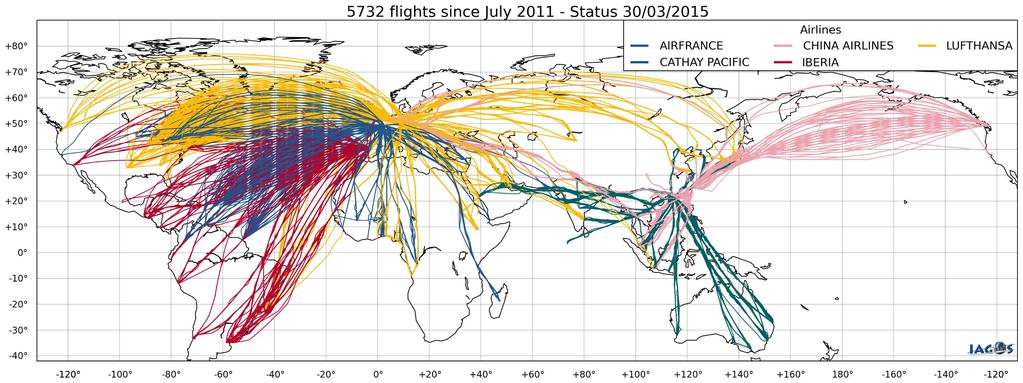
46 IAGOS equipment is designed for installation in the avionics compartment of Airbus A330 aircraft. Species that can be measured include: ozone carbon dioxide methane particulate matter carbon monoxide nitrogen oxides total reactive nitrogen water vapor cloud droplet backscatter Flight tracks and flight frequency during 2009 of all A330 aircraft based in the United States. Figure produced by S. D. Jacob, FAA.

47 An example of IAGOS CO profiles above Taipei, Taiwan Figure by Kuo-Ying Wang, National Central University, Taiwan California GDP in 2012: Taiwan GDP in 2012: 1,959 billion USD 465 billion USD

48 Ozone Network Design Surface monitoring: Take advantage of existing Trinidad Head MBL and Chews Ridge mountain top ozone monitors. Add MBL ozone monitors to Pt Reyes and Vandenburg AFB. Add a mountain top site west of Redding. Daily Vertical Profiles: Highest priority is an ozone lidar at Pt Reyes or Bodega Bay. Lidars at Trinidad Head and Vandenburg AFB are also needed. Launch ozonesondes on cloudy days
49

50 Impact of baseline ozone on the surface of the United States

51 Impact of baseline ozone on the surface of the United States

52 Passive 20-day anthropogenic NOx tracers above the individual coastal sites. ppbv or % ozone (ppbv): blue RH (%): green % from strat.: yellow sample size: white NO x tracer, ppbv Total: black N. America: yellow China: red Jap/Kor: blue SE Asia: green India: cyan Europe: magenta NH shipping: white