Is there need to collect routine ammonia/ammonium measurements in ambient air monitoring networks?
|
|
|
- Marshall Arnold
- 5 years ago
- Views:
Transcription

1 Is there need to collect routine ammonia/ammonium measurements in ambient air monitoring networks? Perspectives of a Data Analyst from a Small State Air Pollution Regulatory program
2 Is there need to collect routine ammonia/ammonium measurements in ambient air monitoring networks? State Air Program Perspectives Data Analyst: Yes, They re key unmeasured species. Modeler: and we need continuous data for all species Monitor: but we re already measuring NH4, OK? QA Skeptic: Current data quality is poor or Uncertain. Measurement Wiz: Possible, but labor/cost-intensive. Boss: Monitoring already eats > 60% of my budget! What will you give up to add NH4 & NH3?

3 NH3 & NH4+ are critical aerosol and precursor components which are not currently measured (or not measured well) in routine monitoring networks. They Should be! Direct relevance to current regulatory programs for PM 2.5 and Regional Haze and especially for future control plans. If / When / Where there s just enough NH 3 to fully neutralize SO 4, then SO 2 reductions may yield 2 moles of NH 4 NO 3 for each mole of (NH 4 )2SO 4 reduced resulting in a 50% increase in PM 2.5 mass and associated health & visibility effects.
4 STN (urban) network measures NH4 on Nylon filters with HNO3 denuder, IMPROVE (rural) measures NH4 on Nylon filters at some Southeastern sites with HNO3 & NH3 denuders (with support from NPS & VISTAS).
5 Regional Haze Regulatory Metrics are based on Reconstructed Extinction (Measurements + Assumptions) Ammonium is Assumed, Not Measured. So what could possibly go wrong?

6 Without knowing Ambient Ammonium Concentrations, We ll occasionally make big mistakes, especially on cleanest & dirtiest days
7
8
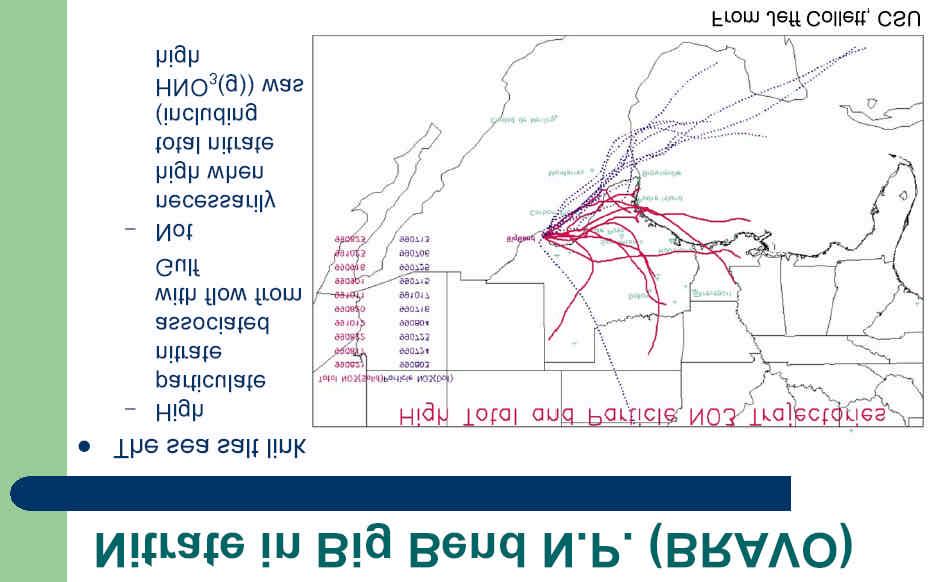
9 IMPROVE Ion Study Aerosol NO 3-, Cl -, SO 42, Na +, K +, NH 4+, Ca 2+, Mg 2+ Gaseous NH3, HNO3 Bondville, IL February, 2003 San Gregornio, CA March/April, 2003 Brigantine, NJ November, 2003 Sequoia NP, CA February, 2004 Grand Canyon NP, AZ April/May, 2004 From Jeff Collett, CSU
10
11
12 Molar Ratio NH4:SO4 at IMPROVE Sites Great Smoky Mtns, TN 2.0 Molar Ratio Jan-99 Apr-99 Jul-99 Oct-99 Jan-00 Apr-00 Jul-00 Oct-00 Jan-01 Apr-01 Jul-01 Oct-01 Molar Ratio Shenandoah, VA Jan-99 Apr-99 Jul-99 Oct-99 Jan-00 Apr-00 Jul-00 Oct-00 Jan-01 Apr-01 Jul-01 Oct-01 From Pat Brewer, VISTAS
13 From Pat Brewer, VISTAS
14 Hygroscopic Growth functions for Sulfate compounds and Organics, showing theoretical f(rh) & least squares regression results from GSRM Adapted from Malm et al. (2000) IMPROVE Report
15

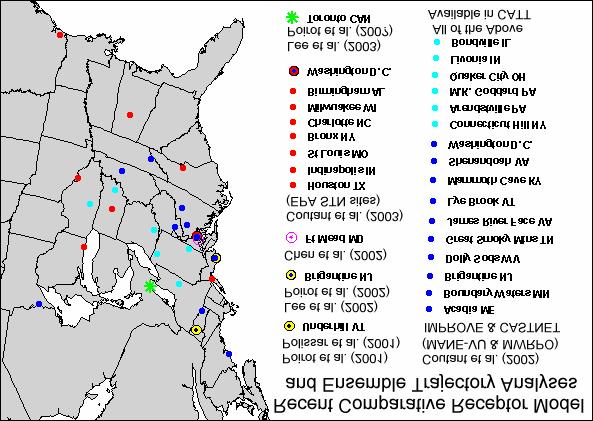
16 Evaluation of Sea Salt Source by Surface Met and Ensemble Back Trajectories confirms that Sea Salt comes from the sea shore, as she should PMF & UNMIX Receptor Model Results from Rutgers, Clarkson Battelle Labs & VT DEC all found similar Sea Salt Source at BRIG


17 Highest fine soil at Brigantine & other Eastern Sites is from Sahara Dust
")
18 But chemical composition of BRIG Salt & Soil sources shows substantial excess SO4 & NO3 associated with these (coarse mode) aerosols

19 Most of the NO 3 (67%) and SO 4 (70%) from Brigantine Unmix results was associated with 2 large secondary sources with strong, opposite seasonal patterns (winter NO 3 vs. summer SO 4 ). Trajectory-based upwind probability fields for high contributions from these sources suggest coal burning contributions for both, but also suggest importance of agricultural NH 3 for aerosol nitrates.

20
 Organic Acids: by Capillary Electrophoresis Sampling")
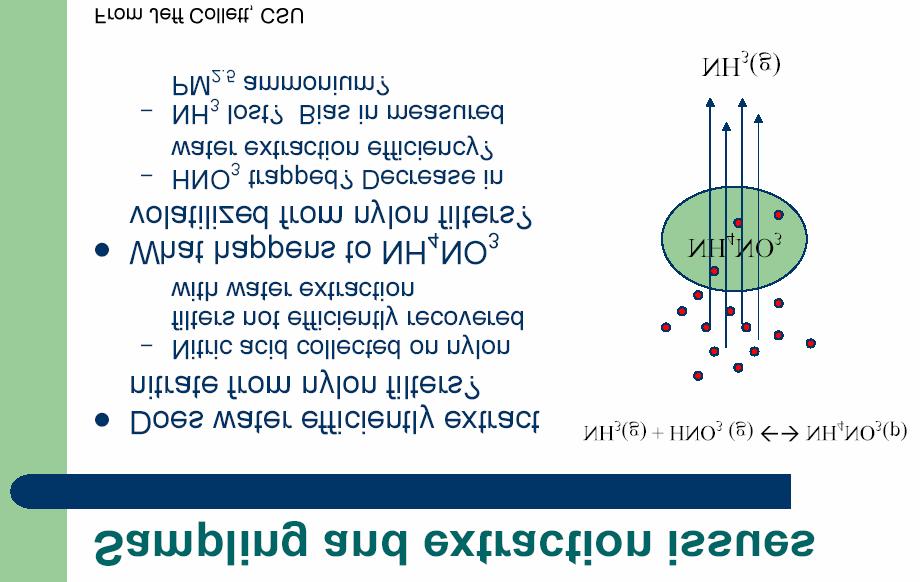
21 Daily PM 2.5 : Feb, 2000 Feb., 2001 Mass: by Partisol FRM Ions: SO4, NO3, NH4, K, Na, Cl, PO4 by IC Elements: by ICP-AES and ICP-MS Carbon by TOT (O1, O2, O3, O4, EC) Organic Acids: by Capillary Electrophoresis Sampling Schedule: 9 AM 9 AM (reduces volatile losses) Ions on (NH3 & HNO3-denuded) Teflon with backup Nylon for volatile NO3 (what happens to NH4 from NH4NO3 on nylon?) Carbon on quartz by modified TOT (NIOSH+TOR) and with OP quantified at each thermal stage on subset of samples, with ratios used to disaggregate OP among O1 O4 (& with no blank subtract?)
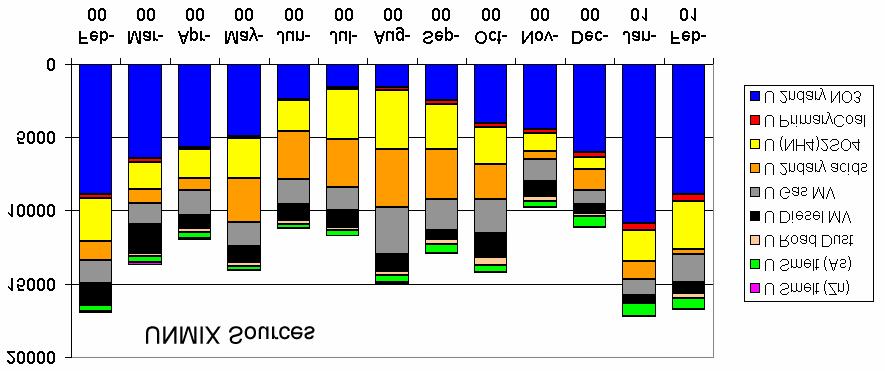
22

23 Compositions of Major Toronto UNMIX Sources Is this Acid Catalyzed SOA formation as in Jang et al. (2002)?
24 OC benefit from NOx/SOx`reductions? Yields from Teflon bag experiments non acid seed acid seed % yield isoprene isoprene/ decanol α-pinene acrolein acrolein/ decanol (Kamens and Jang)
 from the South HY-SPLIT trajectory-based upwind")

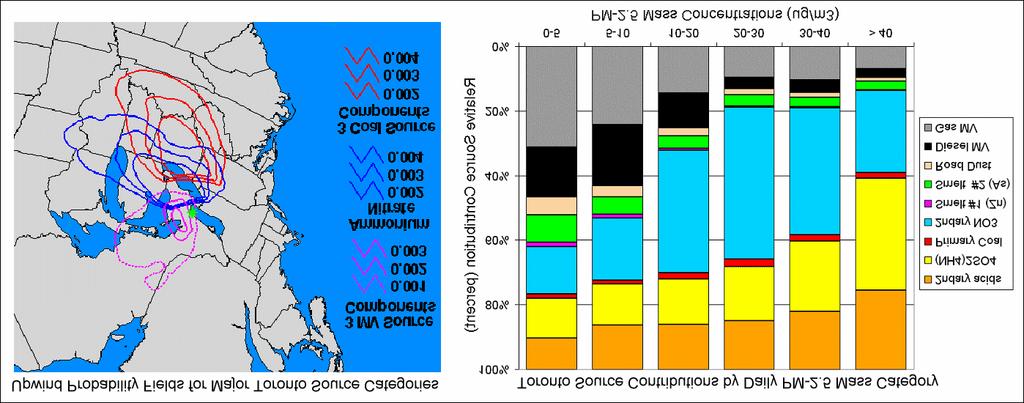
25 Contributions of 3 Coal-related sources increase as wind speed increases (red) from the South HY-SPLIT trajectory-based upwind probability fields indicate the 3 coal-related sources have similar regional origins, consistent with similar model results from other receptor sites.


26 NH 4 NO 3 shows more Westerly transport influence, consistent with NH 3 from US agricultural regions, But Weekday/ Weekend pattern also suggests local sources
27 8 Average PM-2.5 Species Concentrations at Washington DC and nearby Shenandoah NP 4 Species Concentration (ug/m3) Urban:Rural Ratio (WASH:SHEN) 0 SO4 OMC SOIL NO3 LAC Shenandoah NP Washington DC Urban/Rural 1 What is Urban aerosol Nitrate 3 x greater than Rural?

28 Reasons to measure NH3 and/or NH4 in routine monitoring networks Evaluation and Improvement of Ammonia Emission Inventories Evaluation and Improvement of Photochemical Aerosol Models Understanding Indoor vs. Outdoor NH 4 NO 3 Is NH 3 Transported and does NO 3 Assist? Improved Performance and Evaluation of Aerosol Receptor Models Understanding Acid Aerosol Health (direct or indirect) Effects Understanding Acid Aerosol Water uptake & associated Visibility Effects Understanding Acid Catalyst formation of Secondary Organic Aerosols Discerning Contributions and Effects of Fine & Coarse Mode Aerosols Understanding Where & When Less SO4 may result in More NO3 Developing and Tracking Efficient Pollutant Control Strategies