Additional information relevant to Section 7 is presented in Appendix D in Volume 2 of 3 of the EIS.
|
|
|
- Lisa Neal
- 5 years ago
- Views:
Transcription
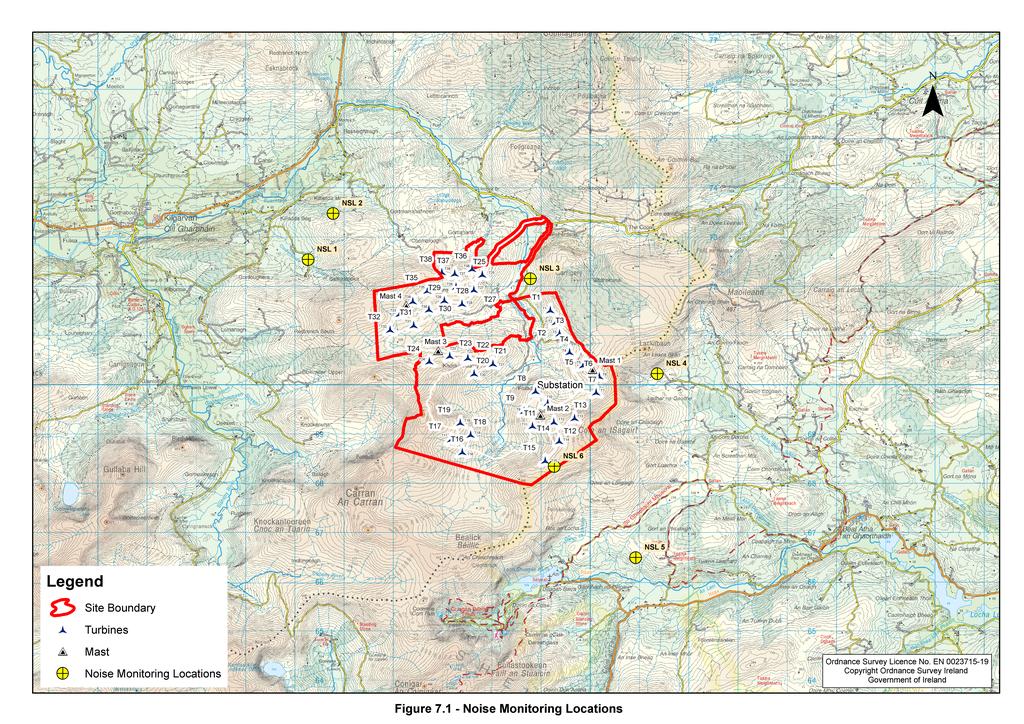
1 7. NOISE & VIBRATION Additional information relevant to Section 7 is presented in Appendix D in Volume 2 of 3 of the EIS. 7.1 RECEIVING ENVIRONMENT Monitoring Continuous noise monitoring was undertaken over a 15 day period in February 2015 to establish the typical noise environment at a number of noise sensitive locations in the environs of the development (see Appendix D.1). Noise measurements were previously made in September 2008 and October 2010 in the context of planning applications for the approved Barnastooka Wind Farm and Grousemount Wind Farm respectively. Each of these was focused only on the development in question and the measurements in February 2015 were more comprehensive and were undertaken against a more uniform and systematic approach to the assessment of noise impacts from wind farms Monitoring comprised unattended sound level meters at six positions identified as being representative of noise sensitive locations (NSLs) surrounding the site. NSLs are deemed to be locations where the inhabitants can be disturbed by noise or changes in noise levels from a wind farm. When assessing noise in the existing environment, noise is always considered with respect to the receiver. The 2006 DoEHLG guidance considers a noise sensitive location to include the following: any occupied dwelling house, hostel, health building or place of worship and may include areas of particular scenic quality or special recreational amenity importance. The locations used in monitoring are presented in Table 7.1 and are shown on Figure 7.1. Table 7.1: Noise Monitoring Locations Ref. NSL 1 NSL 2 NSL 3 NSL 4 NSL 5 NSL 6 Easting Northing The noise surveys were carried out in accordance with guidance contained in the following: ISO 1996: 2007: Acoustics Description, measurement and assessment of Environmental Noise A Good Practice Guide to the Application of ETSU-R-97 for the Assessment and Rating of Noise from Wind Turbines. The Institute of Acoustics, November Sample times for the noise measurements were of 10-minute duration and the results were saved to the instrument memory for later analysis. Measurements were taken using Brüel & Kjaer model 2238 type 1 sound level meters. A secondary wind screen was incorporated into the installation in line with best practice recommendations. Before and after the survey the measurement apparatus was check calibrated using a Brüel & Kjær type 4231 Sound Level Calibrator. Rainfall data was recorded using a Texas Instruments TR525T rain collector tipping bucket with data logger. The timing of the noise measurements was synchronised with measurements of wind Noise & Vibration Page 7.1/12
2 speed, which were derived from an on-site anemometer mast at 80 m height. Wind speed was referenced to a standardised 10 m wind speed and was taken as the average wind speed over each 10 minute measurement period. As the monitoring data consisted of 10 minute logged measurements, there were more than 2,000 measurements at each location Analysis & Results Commonly used statistical metrics used to describe noise levels are as follows: Leq is the equivalent continuous sound level. It is a type of average and is used to describe a fluctuating noise in terms of a single noise level over the sample period. L10 is the sound level that is exceeded for 10% of the sample period. It is typically used as a descriptor for traffic noise. L90 is the sound level that is exceeded for 90% of the sample period. It is typically used as a descriptor for background noise. As recommended by the DoEHLG Windfarm Planning Guidelines, the background noise level was determined using the LA90 criterion. The A suffix denotes the fact that the sound levels have been A-weighted in order to account for the non-linear nature of human hearing. The analysis of data was undertaken by removal of outlier data caused by rainfall and atypical source contribution. The remaining noise data was filtered by occurrence in either daytime or night-time periods, which are defined as follows: Table 7.2: Definition of Noise Recording Periods Definition Quiet daytime Periods Included All evenings from 18:00 to 23:00 hours Saturday afternoons from 13:00 to 18:00 hours Sunday from 07:00 to 18:00 hours Night-time 23:00 to 07:00hrs. There are a number of operational wind farms in the surrounding area. Any influence from existing turbines on the baseline noise measurements was accounted for by applying wind directional filtering to the measured data. This derived background noise data that is not influenced by the existing turbines. This is the approach recommended in the Institute of Acoustics Good Practice Guide and for this site noise from existing turbines was filtered out at three of the measurement locations (NSL2, NSL3 & NSL4). A regression analysis on the measured noise and wind speed data was performed in order to determine the typical background noise levels at a range of wind speeds at each of the six measurement locations. Based on the noise criteria recommended in best practice guidelines and statistical analysis of the baseline noise level information, day and night-time noise criteria curves have been derived. Table 7.3 presents the derived noise criteria limits for each of the six monitoring locations. Noise & Vibration Page 7.2/12
3 Table 7.3: Derived Noise Limits Location Period 3 m/s 4 m/s 5 m/s 6 m/s 7 m/s 8 m/s 9 m/s 10 m/s 11 m/s 12 m/s NSL 1 ALL (Baseline) Day Criteria Night Criteria NSL 2 ALL (Baseline) Day Criteria Night Criteria NSL 3 ALL (Baseline) Day Criteria Night Criteria NSL 4 ALL (Baseline) Day Criteria Night Criteria NSL 5 ALL (Baseline) Day Criteria Night Criteria NSL 6 ALL (Baseline) Day Criteria Night Criteria Noise & Vibration Page 7.3/12
4 7.2 IMPACT OF THE DEVELOPMENT While a noise level in excess of 85 db(a) constitutes a significant risk of damage to hearing, the criteria for environmental noise control are annoyance or nuisance rather than damage. Because the decibel scale is logarithmic, an increase in sound level of 10 db(a) represents a doubling of loudness, while an increase in noise level of 3 db(a) is regarded as the minimum perceptible increase in normal conditions Sources of Noise The noise a wind turbine creates is expressed in terms of its sound power level. Although this is measured in db(a) re watts, it is not a measurement of the noise level that is heard but of the noise power emitted by the machine. Under constant operational conditions, the sound power level will be constant, but the sound pressure at some distance will depend on the distance away, atmospheric conditions and topography. The sound power level from a single wind turbine is usually db(a) re watts at a wind speed of 8 m/s. This creates a sound pressure level of db(a) outdoors at a distance of 50 m from the turbine, i.e. about the same level as conversational speech. At a house 500 m away, the equivalent sound pressure level would be db(a) when the wind is blowing from the turbine towards the house. Because of the necessary separation between turbines for design reasons, it is usually the case that any receiver will only be influenced by few of the turbines in a wind farm. In general, noise from wind turbines increases with wind speed and rotational speed. Most modern wind turbines are pitch regulated variable speed turbines which have a characteristic noise profile of steeply increasing noise with wind speed up to the point at which the turbine is generating its rated power or maximum power above which there is usually no increase in noise. In addition to an increase in turbine noise level as wind speed increases, ambient noise, which is the noise from wind in nearby trees and hedgerows, around buildings and over local topography, increases with wind speed, but at a faster rate. Wind turbines do not operate below the wind speed referred to as the cut-in speed (usually around 4-5 m/s). Ambient noise is low in calm conditions and turbine noise could be more discernible. However, they are not in operation in these conditions Wind Farm Construction Noise Limit Values There is no published Irish guidance relating to the maximum permissible noise level that may be generated during the construction phase of a project. In such absence, the following guidance has been employed in the construction noise assessment: Guidelines for the Treatment of Noise and Vibration in National Road Schemes, National Roads Authority, 2004 BS 5228 Part 1:2009 Code of practice for noise and vibration control on construction and open sites Part 1 Noise National Roads Authority (NRA): While acknowledging that local authorities, where appropriate, should control construction activities by imposing limits on the hours of operation and consider noise limits at their discretion, the NRA considers that the noise levels in Table 7.4 are typically deemed acceptable. Noise & Vibration Page 7.4/12
5 Table 7.4: Typical Construction Noise Limits Days & Times Monday - Friday 07:00-19:00 Monday - Friday 19:00-22:00 Saturday 08:00 to 16:30hrs Sundays & Bank Holidays 08:00-16:30 Limit Leq (1hr) 70 db(a) 60 db(a) 65 db(a) 60 db(a) BS :2009: This provides two methods of determining whether a significant impact will occur from construction noise. The first is a significant effect threshold value. The ambient noise level is initially rounded to the nearest 5 db. Based on the threshold values provided in Table 7.5, a significant effect is deemed to occur if the total LAeq value (rounded LAeq value and the predicted construction noise) exceeds the threshold value appropriate to the ambient noise level. Table 7.5: Maximum Permissible Construction Noise Levels at Dwelling Façades Threshold Value Period Threshold Value Category A Category B Category C Night-time 23:00-07: Evenings Weekends Daytime Saturday Weekdays 19:00-23:00 Saturday 13:00-23:00 and Sunday 07:00-23:00 07:00-19:00 07:00-23: Category A: Threshold values to use when ambient noise levels (when rounded to the nearest 5 db) are less than these values. Category B: Threshold values to use when ambient noise levels (when rounded to the nearest 5 db) are the same as Category A values. Category C: Threshold values to use when ambient noise levels (when rounded to the nearest 5 db) are higher than Category A values. The other method for deeming whether a significant impact can occur is if the total noise (pre-construction ambient noise and the predicted construction noise) exceeds the preconstruction ambient noise by 5 db or more, subject to lower cut-off values of 65 db, 55 db and 45 db LAeq,T for daytime, evening time and night-time periods respectively. Predicted Noise Levels Construction activity will comprise standard construction techniques using standard equipment. The noisiest construction activities will be those associated with the excavation and pouring of the turbine bases, and with the operation of borrow pits. Construction noise prediction modelling was undertaken to provide a best estimate of the construction noise locations. It is acknowledged that the definitive construction methodology and number / type of plant to be used is not known at this stage. Therefore, a best estimate of plant type that would typically be used was modelled. Noise levels for various distances were calculated from the sound power data for a variety of construction plant types. The sound power levels used were sourced from BS Noise & Vibration Page 7.5/12
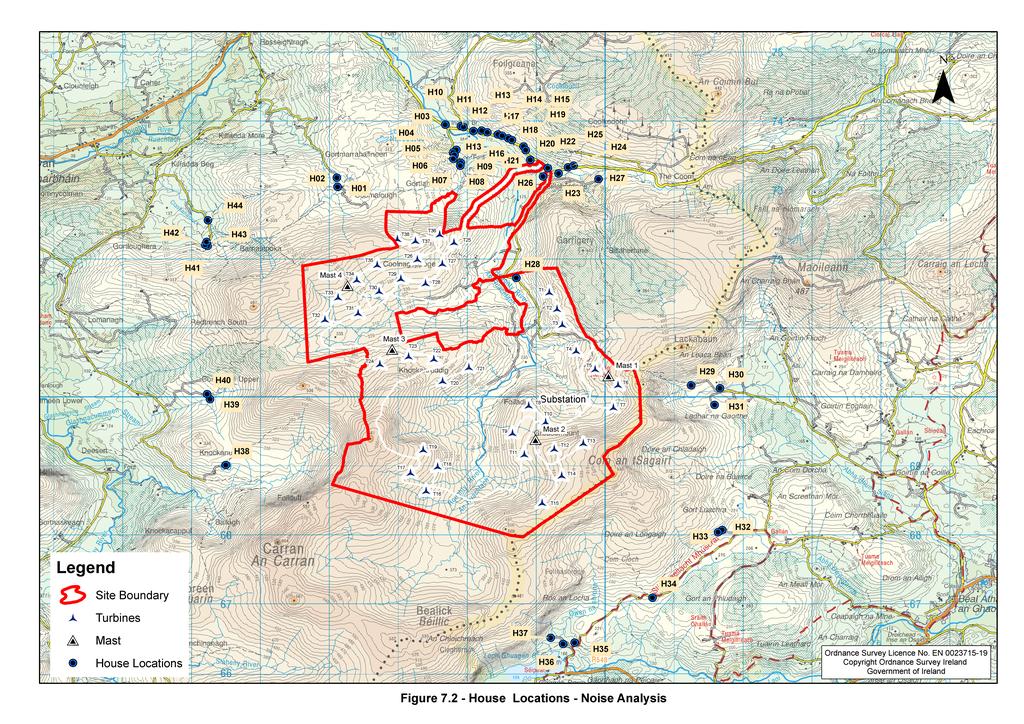
6 1:2009 Annex C, Current Sound Level Data on Site Equipment and Site Activities. The results, which are shown in Table 7.4 are expressed as db(a) Leq (12 hour) equivalent continuous noise levels, the standard units for construction noise. The calculated noise levels consider only distance attenuation, and screening due to foliage and ground contours was not considered. Thus, the prediction is highly conservative in its estimate of construction noise. Table 7.6: Noise Impact of Construction Activities Distance 100 m 200 m 500 m 1,000 m Earth Moving 62.7 db(a) 55.2 db(a) 45.2 db(a) 37.7 db(a) Concreting 59.8 db(a) 52.3 db(a) 42.3 db(a) 34.8 db(a) While no formal limits exist for construction noise, predicted construction noise levels are evidently much below relevant limit values and construction noise will evidently not create significant impacts. Vibration Vibration impact can occur during the construction phase of a wind farm project. The most significant sources of vibration potential arise from piling at turbine bases and / or blasting of rock at borrow pits during construction. It is not currently anticipated that either of these activities will arise during construction of Grousemount Wind Farm. Ground-borne vibration due to construction is very rapidly attenuated over distance. BS : 2009 Code of Practice for Noise and Vibration Control on Construction and Open Sites Part 2: Vibration discusses vibration attenuation at distances up to some tens of metres from the source. Vibration from construction activities, hundreds of metres from the receptors, and vibration from vehicle movements, with relatively low source levels, is considered to be not significant Wind Farm Operation Method of Assessment and Noise Limits The DoEHLG Windfarm Planning Guidelines suggests that noise impact should be assessed by reference to the nature and character of noise sensitive locations. It recommends that noise limits should be applied to external locations, and should reflect the variation in both turbine source noise and background noise with wind speed. The Guidelines suggest that separate noise limits should apply for daytime and for nighttime. In general, a lower fixed limit of 45 db(a) or a maximum increase of 5 db(a) above background noise at nearby noise sensitive locations is considered appropriate to provide protection to wind energy development neighbours. During the night the protection of external amenity becomes less important and the emphasis should be on preventing sleep disturbance. A fixed limit of 43 db(a) will protect sleep inside properties during the night. Based on their proximity to the six noise measurement locations, different noise limit criteria were applied to each of the dwellings identified in Figure 7.2, as shown in Tables 7.7 and 7.8 for daytime and night-time respectively. Noise & Vibration Page 7.6/12
7 Table 7.7: Daytime Noise Limits at each Property Dwelling Measurement Location Noise Limit per Wind Speed [db(a)] (L90) 4 m/s 5 m/s 6 m/s 7 m/s 8 m/s 9 m/s 10 m/s 11 m/s 12 m/s H1 H27 NSL H28 NSL H29 - H31 NSL H32 H37 NSL H38 H40 NSL H41 H44 NSL Table 7.8: Night-time Noise Limits at each Property Dwelling Measurement Location Noise Limit per Wind Speed [db(a)] (L90) 4 m/s 5 m/s 6 m/s 7 m/s 8 m/s 9 m/s 10 m/s 11 m/s 12 m/s H1 H27 NSL H28 NSL H29 - H31 NSL H32 H37 NSL H38 H40 NSL H41 H44 NSL Noise & Vibration Page 7.7/12
8 Noise Impacts The DoEHLG Windfarm Planning Guidelines (Section 5.6) notes as follows regarding noise impacts from wind turbines: In general, noise is unlikely to be a significant problem where the distance from the nearest turbine to any noise sensitive property is more than 500 metres. At Grousemount, with no turbine within 500 m of the nearest residence, noise impacts would not be anticipated even at the closest residences. Wind turbines of the type to be deployed at Grousemount all come with noise reduction modes that can be implemented automatically based on time of day, meteorological conditions, or turbine parameters. Noise reduced operations (NRO) work by lowering the rotational speed of the turbine. This lowers the tip speed of the rotor blades and reduces broadband aerodynamic noise. At the same time, NRO lowers power generation by the turbine. Details of the modelling of noise impacts, which was in accordance with ETSU-R-97, ISO , and Institute of Acoustics guidance on wind farm specific propagation modelling, and was undertaken by an independent specialist consultant, are presented in Appendix D.2. Calculations were performed for the turbine configuration set out in Table 7.9 and all wind farms operating in close proximity to the Grousemount Wind Farm were considered in the assessment. Table 7.9: Assessed Grousemount Turbine Configuration Turbines Turbine Model No. of Turbines Max. Sound Power Level Hub Height (m) T01 T06 Siemens SWT db 63.3 T07 T38 Vestas V MW db 69.0 In terms of noise characteristics, these turbines are representative of the noise ratings associated with modern turbines of the size proposed. Most modern wind turbines are pitch regulated variable speed turbines which have a characteristic noise profile of steeply increasing noise with wind speed up to the point at which the turbine is generating its rated power or maximum power. Each turbine was assumed to run in a standard, non-reduced mode, representing the worst case operation. Additionally, an uncertainty of 2 db was attributed to the sound power levels for all the turbines modelled, i.e. the Grousemount Wind Farm turbines and the operational neighbouring turbines. The full results are presented in Appendix D.2. Wind Turbine Curtailment Strategy On the basis of conservative calculation, noise levels are predicted to exceed the derived night and daytime noise limits when the proposed Grousemount Wind Farm and existing wind farm turbines are operating in full power mode. Therefore, two constraint schemes have been derived for the Grousemount Wind Farm, such that: Daytime noise limits are not exceeded at any wind speed, in any wind direction, at Noise & Vibration Page 7.8/12
9 any receptor; Night-time breaches are minimised to the greatest extent possible at all wind speeds, in all wind directions, at all receptors. The wind turbines under consideration for Grousemount are pitch controlled variable speed machines, meaning that unlike older technology fixed speed machines, which operated at one or possibly two speeds regardless of the wind speed, by design these turbines operate at a range of different rotor speeds and can vary their rotor speed on demand. As blade noise is related to blade tip speed and the turbines are capable of being operated at varying rotor and pitch settings, the turbines can be tuned either aggressively for maximum energy recovery or, in noise sensitive areas, for lower energy recovery and lower noise on a turbine by turbine basis. This mode of operation is referred to as curtailment. Daytime Curtailment Strategy A daytime noise curtailment strategy is required to manage predicted noise levels at one property only. The strategy involves operating Turbines T1 and T2 in noise-reduced modes at some wind speeds and in some wind directional sectors. This reduces noise output levels to the point where no exceedance of the noise limits are predicted at any property at any wind speed. The calculated headroom at the dwelling prior to and following implementation of the daytime noise curtailment strategy is shown in Table 7.9. (Negative headroom indicates an exceedance of the derived noise limit.) Table 7.9: Predicted Headroom at Surrounding Houses Daytime Dwelling 4 m/s 5 m/s 6 m/s 7 m/s 8 m/s 9 m/s 10 m/s 11 m/s Headroom per Wind Speed No Curtailment H Headroom per Wind Speed Curtailment Applied H Application of the curtailment strategy reduces all predicted noise levels to less than the applicable limit value. Night-time Curtailment Strategy A night-time curtailment strategy is required to manage predicted noise levels at ten properties. The strategy The night-time curtailment strategy involves shutting down or operating Turbines T1-T4, T26-T28 and T36-T38 of the Grousemount Wind Farm in noise-reduced modes at some wind speeds and in some direction sectors. The calculated headroom at the dwellings prior to and following implementation of the night-time noise curtailment strategy is shown in Table Noise & Vibration Page 7.9/12
10 Table 7.10: Predicted Headroom at Surrounding Houses Night-time Dwelling 4 m/s 5 m/s 6 m/s 7 m/s 8 m/s 9 m/s 10 m/s 11 m/s Headroom per Wind Speed No Curtailment H H H H H H H H H H Headroom per Wind Speed Curtailment Applied H H H H H H H H H H Application of the curtailment strategy reduces all predicted noise levels to less than the applicable limit value, other than at four dwellings only. Assessment The following considerations apply: The modelling undertaken adopted a conservative approach whereby it assumed that the wind will blow simultaneously in the direction of the receiver from all turbines, which cannot occur in practice. The uncorrected results of monitoring of ambient conditions over a 15 day period reflected the noise regime attributable to the operational turbines in the broader area. Recorded values were much lower than predicted values, confirming the conservative nature of the calculations. Breaches of the derived limit values both prior to and following application of the curtailment strategy are all less than 3 db, which is commonly recognised as the minimum perceptible increase in noise levels under normal conditions. Noise & Vibration Page 7.10/12
11 With minor exceptions, breaches of the derived limit values prior to application of the curtailment strategy are all less than 2 db, which was the uncertainty level attributed to the sound power levels for all the turbines modelled. Breaches following application of the curtailment strategy are all less than this. In reality, discernible breaches of limit values will be unlikely to occur, even without the curtailment strategy. It is clear that following implementation of the strategy, any potential impacts on nearby houses from turbine noise will effectively be eliminated. The potential impacts from turbine noise from the Grousemount Wind Farm are considered to be negligible. Vibration There is no evidence that operating wind turbines cause ground-borne vibration and operational vibration is not considered further Wind Farm Decommissioning During decommissioning, similar plant to that used during the construction phase would be employed to decommission and remove the turbines. The potential noise level and vibration during decommissioning would be similar or less than that predicted for the construction phase. 7.3 MITIGATION Wind Farm Layout The layout of the turbines has been arranged so that they are at the maximum feasible distance from nearby dwellings. State-of-the-art wind turbines will be used, bringing to the project the dramatic improvements in noise attenuation that the latest developments in wind turbine technology have realised. The turbines will be kept in good working order and will be maintained on a regular basis. This will minimise the potential for noise or vibration impacts resultant of faulty or worn out components. Working Hours Night-time, Saturday afternoon or Sunday working will not normally be required during the construction phase. Possible exceptions to the above may arise as follows: Delivery of wind turbine components may be scheduled for times outside of these hours to minimise inconvenience to local road users. Low wind conditions are required for wind turbine erection and the occurrence of such suitable conditions may be availed of when they arise. The concreting of a turbine foundation base is undertaken in one continuous pour lasting about 12 hours. Noise Monitoring A post-commissioning compliance noise survey will be undertaken in the vicinity of noise sensitive locations nearest to the development. The developer will engage a suitably qualified independent professional acoustics consultant who holds adequate professional indemnity insurance to carry out the measurements. The survey will be implemented by deploying attended and / or unattended sound level meters. Noise & Vibration Page 7.11/12
12 Monitoring at each location will consist of a series of measurements taken in a variety of wind conditions. Wind turbine noise levels typically peak at a wind speed of approximately 8 m/s with noise levels at wind speeds in excess of this being the same or lower. Measurement periods will be such that the noise from non-wind farm sources can be discounted so that a measurement period of 10 minutes relating to wind farm noise only will be achieved. In the case of measurements indicating noise levels exceeding limit values, consideration of mitigation measures will include the de-rating of turbine output, to achieve the specified limits. 7.4 CONCLUSIONS The proposed development will not result in significant adverse environmental impacts. Noise & Vibration Page 7.12/12
13
14
15
16 Sound Power 7 m/s 8 m/s 10 m/s db(a) db(a) db(a) Figure 7.3 : Typical Wind Turbine Power Output Curve