A comparative study on multi-model numerical simulation of black carbon in East Asia
|
|
|
- Bertina Bradley
- 5 years ago
- Views:
Transcription
, Wei Wang (CMEMC), and MICS-Asia III Working")
1 A comparative study on multi-model numerical simulation of black carbon in East Asia Zifa Wang, Hajime Akimoto and Greg Carmichael, Xiaole Pan, Xueshun Chen, Jianqi Hao(IAP/CAS), Wei Wang (CMEMC), and MICS-Asia III Working Group

2 Black carbon in the atmosphere Definition by EPA: Black carbon (BC) is the most strongly light-absorbing component of particulate matter (PM), and is formed by the incomplete combustion of fossil fuels, biofuels, and biomass. 1. Direct climate effect by absorbing incoming solar radiation 2. Indirect climate effect by influencing cloud formation and lifetime Glacier melting Environmental effect Emission Biomass burning & wild fires On-road transport Cooking & heating in rural area Industry Ship emissions (Bond et al., 2013)
 Campaign High BC concentration (10~30 ug/m 3 ) Footprint calculated by FLEXPART model 0 0 0")
 25 20 15 10 5 0 0 5 10 15 20 BC e ( PM 1, µg/m 3 ) 25 OCRB 40 30 20 10 0 0 0 5 6 7 8 9 10 11")
3 MAAP_BC (µg/m 3 ) Biomass burning cases during Mt.Tai (1534 m) Campaign High BC concentration (10~30 ug/m 3 ) Footprint calculated by FLEXPART model EC (µg/m 3 ) EC a OC BC e (PM 1 ) BC e (PM 2.5 ) OCRB BC e ( PM 2.5, µg/m 3 ) BC e ( PM 1, µg/m 3 ) 25 OCRB Day of Month (June 2006) (Pan et al., 2013) Hotspots by MODIS observation
 10 ~15 μgm -3 BC Instrument 1:")
 20 ~30 μgm -3 Rudong (2010) 2 ~10 μgm -3 Jeju")


4 Long term observation ( ) of BC mass concentration in East Asia Beijing (2007) 10 ~15 μgm -3 BC Instrument 1: COSMOS Inlet flow is heated to 300 Light absorbing method Mt.Tai (2006) 20 ~30 μgm -3 Rudong (2010) 2 ~10 μgm -3 Jeju island (2012) 1 ~2 μgm -3 Observation site Fukue island 0.36μgm -3 BC Instrument 2: MAAP Without heating, Light absorbing method Obvious summer-low and winter-high pattern with a mean of 0.36μgm -3 Significant decrease of BC concentration along the transport pathway indicates that the long range transport ability of BC from Asian continent is very limited!

5 BC concentration in Fukue island showed decreasing trend in the past 7 years How about the ability of different air quality models?
, long-range transport and deposition of sulfur. MICS-Asia Phase II (2001-2009), taking into account more species than Phase I.")
6 The Model InterComparison Study for Asia MICS-Asia Phase I and II To obtain common understanding of model performance and uncertainties in Asia. MICS-Asia Phase I ( ), long-range transport and deposition of sulfur. MICS-Asia Phase II ( ), taking into account more species than Phase I. sulfur, nitrogen compounds, ozone and aerosols Achievement of MICS-Asia II were published in AE in 2008


7 MICS-Asia III and HTAP 20 groups from China, Japan, USA, Korea and Countries in South Asia added the MICS-Asia III, and had Joint with HTAP for hemispheric study HTAP& MICS-Asia workshop, Beijing,2015
8 OBJECTIVES of MICS-Asia III To evaluate strengths and weaknesses of current multi-scale air quality models and provide techniques to reduce uncertainty in Asia To develop a reliable anthropogenic emission inventories in Asia and understand uncertainty of bottom-up emission inventories in Asia To provide multi-model estimates of radiative forcing and sensitivity analysis of short-lived climate pollutants
; Quantifying uncertainties of each process (phys and chem), model resolutions (hori and vert) and key boundary layer")
9 Air Pollution Complex in Asia: Regional Haze and High Ozone (Shao et al, 2006) To understand and improve air quality models, we need to Assessing the ability of models to reproduce pollutant concentrations under highly polluted conditions (Regional Haze and High Ozone); Quantifying uncertainties of each process (phys and chem), model resolutions (hori and vert) and key boundary layer parameters. Investigating the air quality responses to specific emissions perturbations in a common case.
 for")
 for Southeast Asia D1")

10 Model domains Model domains (D1, D2, and D3) for Northeast Asia Model domain (D2) for Southeast Asia D1 for Southeast Asia is exactly the same as that for Northeast Asia.
11 Prepared inputs for all the participated models Gridded emission Anthropogenic emissions datasets: Mosaic national emission inventories of China, Japan, Korea, India,Thailand. Other anthropogenic emission, such as aircraft and shipping emissions Natural emissions datasets: Biomass burning, Biogenic, Volcano, Dust, Sea-salt, Soil Nox and HONO, Lightning NOx Meteorological fields Prepared the same meteorological model (WRF or other models) to drive air quality models.


12 Multi-Model comparison of BC (Jan.2010) M1 M2 M3 M4 M5 M6 The simulation performance on BC are almost the same except M1 in Jan.,2010. M7 M9 M10 Higher BC concentration in North China Plain (NCP) and South Tibetan Plateau


 and")
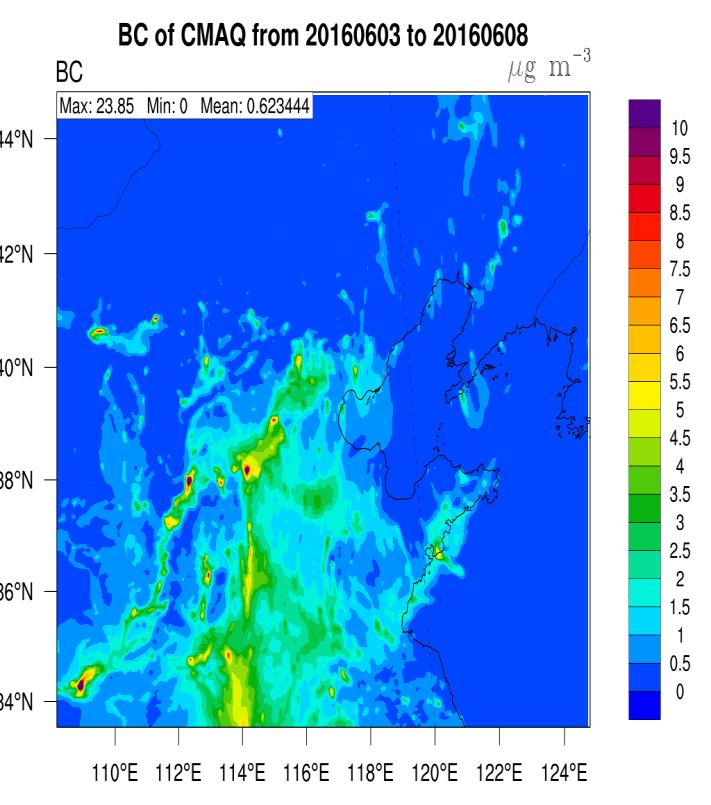
13 Multi-Model comparison of BC (Jul.2010) M1 M2 M3 M4 M5 M6 The simulation performance on BC are almost the same except M1 in Jul.,2010. M7 M9 M10 Higher BC concentration in North China Plain (NCP) and South Tibetan Plateau
 Japan")


14 BC simulation in different regions China IAP(North) Japan Xiamen (South) Significant seasonal variation occurs in NCP Happ o Hedo Higher concentration distributes over China, especially in the north Higher concentration appered in winter and lower in

")
15 BC simulation in different regions Thailand Bangkok Higher consistency of multimodel in Summer (Northern Hemisphere) Indonesia Jakarta


16 Aerosol (soot) climate and environmental effects depend on Concentration Composition Size Mixing state Emission Transport, deposition Microphysics Chemical reaction
17 NAQPMS+APM NAQPMS+APM describes nucleation, condensation/evaporation, coagulation and size-resolved deposition.
18 Introduction to APM Mixing state: semi-external Secondary particles Primary particles + coating Primary particles + coating 微物理过程 : Nucleation:IMN or other Condensation:sulfuric acid Equilibrium:Nitrate, ammonium, SOA Coagulation:Self-coagulation of secondary particles and coagulation scavenging by other particles Condensation Nucleation Clusters NPF Coagulation CCN Secondary particles
19 Particles representation Secondary particles: 40 bins Sea salt:20 bins Dust:4 bins or 15 bins BC/OC:lognomal/28 bins
20 Carbonaceous particles size bins Size bins: 10nm-10μm, 28 bins Coagulation: Jacobson(1994) Ageing e-folding time: 1.2 day Coagulation can be considered; Model can be constrained by observed BC size distribution.


21 Particles number size distribution in Beijing Observed Simulated Secondary particles
22 Evolution of microphysics parameters D BC+coating /D BC Condensation sink Sulfuric acid Ncleation rate Pollution NPF D BC+coating /D BC can be as high as 1.5 or obove, BC mixing state was changed; Condensational sink was higher in pollution episodes; Sulfuric aid concentration showed a evident diurnal variation; Nucleation rate was higher in NPF event; NPF can be identified and reproduced by NAQPMS+APM.


 D")
23 Key parameters of BC in central-eastern China BC conc(ug/m 3 ) Hydrophilic BC frc(%) Sulfate on BC(ug/m 3 ) D BC+coating /D BC (-)


(10 7 cm")

24 Microphysics parameters in central-eastern China CN10nm(cm -3 ) Secondary particles fraction(%) Growth factor of BC(-) H 2 SO 4 (g)(10 7 cm -3 ) Condensational sink(s -1 ) IMN(cm -3 s -1 )

25 National Air Quality Operational Platform Scheme of the national forecasting model system Data Input Meteorology Emissions Air Quality Meteorological & Emissions Models WRF SMOKE Assembling Air Quality Models NAQPMS, CMAQ,CAMx, WRF-chem Products AQI Concentrations GIS


26 Regional forecast operation system NAQPMS CMAQ CAMx WRF-CHEM


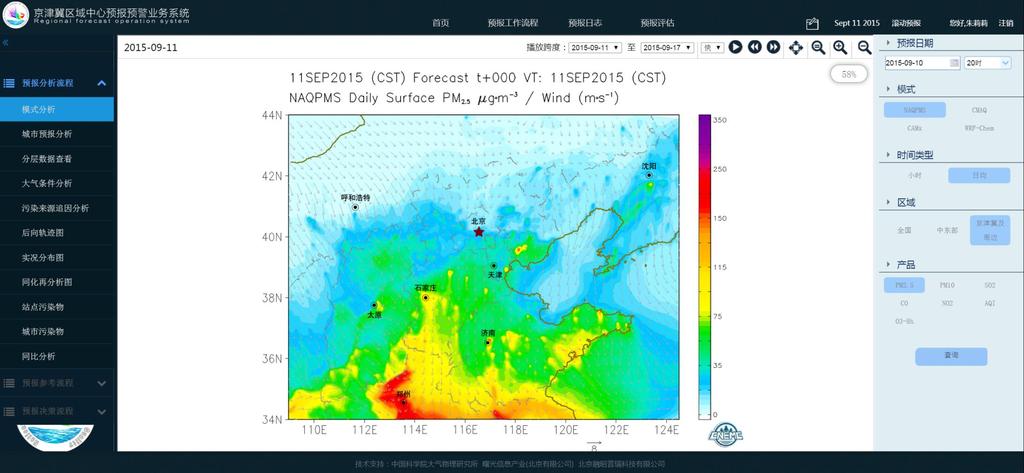
27 Regional forecast operation system


28 Regional forecast operation system


29 Regional forecast operation system

30 Regional forecast operation system
31 case1
32 case2
33 Thanks for your attention.