Climate Change and MDB Wetlands: Scales of Adaptation and Relevant Tools
|
|
|
- Kristin Chandler
- 5 years ago
- Views:
Transcription


1 Climate Change and MDB Wetlands: Scales of Adaptation and Relevant Tools T. Ralph M. Carpenter G. Schmida S. Wassens H. Jones Kerrylee Rogers 1, Neil Saintilan 1, Tim Ralph 2 1 Rivers & Wetlands Unit, NSW Department of Environment, Climate Change & Water 2 Department of Environment & Geography, Macquarie University
2 Outline Hydrological regimes and flow variability Projected changes to flood volumes and interflood dry periods Spatial scales of climate change adaptation Water and habitat requirements database Tools in ecosystem response modelling Conclusions

3 Distribution and hydrology of floodplain wetlands in the MDB Wide distribution Catchment-fed, low relief, dryland floodplain settings Climate variability and hydrology drive inundation regimes Dynamic species and ecosystem responses over multiple scales Source: Ralph and Rogers, in press 2010.
4 Hydrological regimes and variability Seasonal, intermittent or ephemeral regimes Generally have high flow variability Flood modulation by yearly, decadal and multi-decadal climate cycles ENSO/IPO modulated floods - Macquarie Clustering due to climate cycles 1998 Source: Ralph and Hesse, 2010.
5 Projected change in average flood volume per year and per event, median 2030 climate 10 Data source: CSIRO, Figure adapted from: Rogers and Ralph, in press Change under median 2030 climate (%) Average flood volume per year Average flood volume per event Reduced water availability
6 Projected change in average and maximum period between floods, median 2030 climate 100 Data source: CSIRO, Figure adapted from: Rogers and Ralph, in press Change under median 2030 climate (%) Average period between floods Maximum period between floods Longer droughts
7 Scales of Adaptation Basin-wide: Strategic decisions about conservation priority informed by climate change projections Catchment-scale: Water sharing plans- use of flow-ecology models to quantify environmental requirements. Optimisation of flow rules Wetland-scale: Re-engineering of wetlands to maximise inundation efficiency


8 Species water requirements and responses to hydrological change Flora and fauna respond to characteristics of the flood pulse, including timing, duration, depth, rates of rise and fall, and inter-flood dry period Responses vary depending on character and adaptations of species, the characteristics of the flood or drought, and the degree of subsidy or stress Species included: 49 plants 51 waterbirds 17 native, 4 alien fish 15 frogs 15 crustaceans and molluscs T. Ralph K. Rogers S. Wassens H. Jones


9 Species water requirements database T. Ralph


10 Species water requirements database birdsinbackyards.net birdsaustralia.org.au T. Ralph
11 Species water requirements database: Maintenance river red gum Flood frequency Ideal flood timing Max flood timing Ideal flood duration Max flood duration Ideal inter-flood dry-period Max inter-flood dry-period 1-3 years Winterspring Winterearly summer 2-8 months 24 months 5-15 months 36 months Regeneration Ideal flood depth Max flood depth Ideal flood duration Max flood duration Ideal germination timing Max germination timing 5-50 cm (deep) 200 cm 2-5 weeks 14 weeks Late springearly summer Late wintermid summer
12 Response of plants to hydrological change: decline in flood frequency Trees such as river red gum and black box will exhibit stress and decline in reproduction. Conditions will suit dryland species such as bimble box, belah and wilga. Provided flooding occurs at least 1:10 years, lignum may be maintained. Some migration is possible. Vegetatively expanding species such as common reed may be able to migrate to core wetland habitat. Long-lived seed bank species such as nardoo will respond opportunistically when flooding occurs. Dispersal dependant species such as water primrose and river buttercup have limited ability to adapt.


13 RERP Floodplain Wetlands 24 o S Narran Lakes Gwydir wetlands 27 o S 30 o S 33 o S Mean Annual Rainfall >1000 A. Faulkenmire Macquarie Marshes Great Cumbung Swamp 36 o S Lowbidgee floodplain o o

14 Flooding frequency
 Total species response Source: icam, ANU")
15 Species response to hydrological change: Bayesian approach Flood attributes Species response to flood attributes Bayesian network Components: Structure Probabilities Links between variables represent causal relationships (~conceptual model) Total species response Source: icam, ANU 2010.
16


17 Supported by a hydrology model Waterbody Reach Floodplain / Wetlands Junction Node Point (e.g. flow gauge)


18 .which drives ecosystem response models

19 ..to compare scenarios

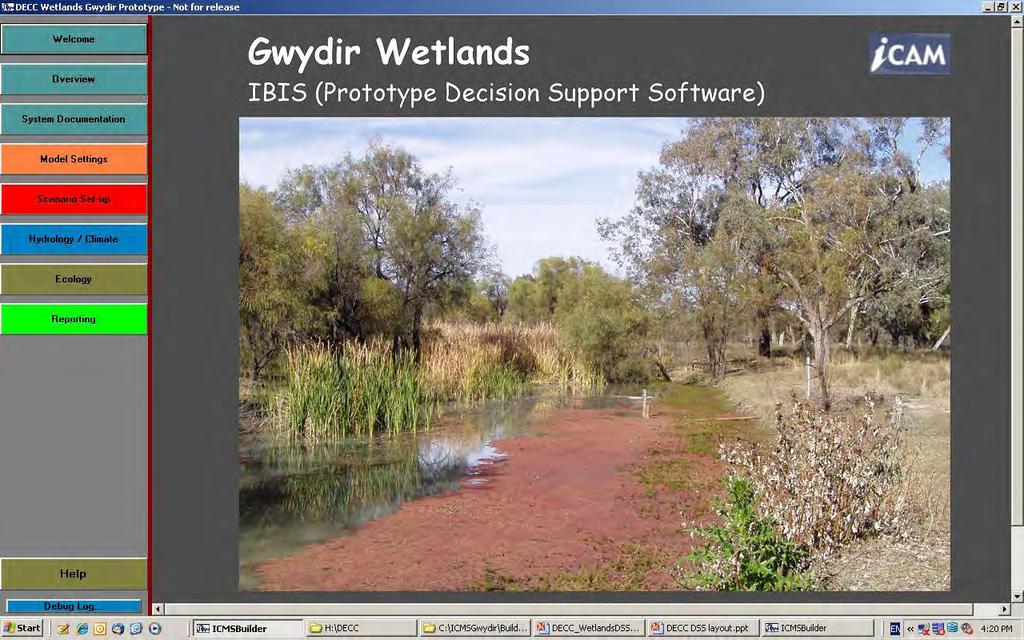
20 Conclusions Adaptation can be managed at Basin, Catchment and Wetland scales using different levers Continually modified understanding of water and habitat requirements of species provides a basis for improved ecosystem response modelling. IBIS DSS provides a tool for the assessment of climate change impacts at the catchment scale.


21 Acknowledgements and Further reading Jennifer Spencer, Baihua Fu, Carmel Pollino, Bruce Chessman, Wendy Merritt CSIRO Publishing 2010