PAS/SLB e-data. Guidelines for Online Tool for SLB Checklist and Target Setting
|
|
|
- Melvin Underwood
- 5 years ago
- Views:
Transcription


1 PAS/SLB e-data Guidelines for Online Tool for SLB Checklist and Target Setting CEPT University All India Institute of Local Self-Government Urban Management Center December 2012
2 PAS/SLB e-data Guidelines for Online Tool for PAS/SLB Checklist and Target Setting CEPT University All India Institute of Local Self-Government Urban Management Center December 2012
3 Contents WELCOME TO PAS/SLB E-DATA 1 1. How to access your account 2 2. How to enter data in the online checklist 4 3. How to approve/reject the checklist How to enter targets online? How to track the cities submission of data? How to view the graphical charts online 21 Annex 1: Possible data sources for checklist General Information Water supply Sewerage and Drainage Solid Waste Management Equity Related Information 49

.")
4 Welcome to PAS/SLB e-data The PAS/SLB e-data is an online data entry tool for performance assessment of urban water supply and sanitation (UWSS). The information helps to assess the current service levels of a city for water supply and sanitation, and to set targets for performance improvement. In December 2008, the Ministry of Urban Development, Government of India adopted national Service Level Benchmarks (SLB) for urban Water Supply, Sewerage, Solid Waste Management (SWM) and Storm Water Drainage (SWD). The Performance Assessment System (PAS) Project, in alignment with the Service Level Benchmarking (SLB) initiative, has conducted performance measurement across 400+ cities in Gujarat and Maharashtra. The first and second round ( to ) of performance measurement was done through simple data questionnaires in MS Excel. For the third round of measurement, the PAS Project helped to develop PAS/SLB e-data, an online tool that helps cities record information on water supply and sanitation services and to set improvement targets. PAS/SLB e-data helps cities to make an annual assessment of their service operations, financial health and services to special groups such as urban poor households. It also assists the urban local bodies (ULBs) and local service providers to set targets for performance improvement on different SLB parameters. The PAS/SLB e-data tool is currently hosted on the PAS Project web portal, The portal also provides a graphical representation of the performance of services provided by each city, and enables the city to track its progress over the years. The portal is bilingual, and can be read in Gujarati and Marathi for users from each state. The state governments of Gujarat and Maharashtra have recently set up State SLB Cells. It is planned that each State SLB cell will also host the online PAS/SLB e-data Tool this year. This User Guide has been developed to assist the ULBs in using the PAS/SLB e-data Tool effectively. The annex 1 provides detailed guidance on possible sources of data that can be used to fill the data in the online PAS/SLB checklist. Page 1
, Google Chrome, Mozilla Firefox etc. STEP 2.")
5 1. How to access your account The guidelines will take one through the steps involved in accessing the PAS web portal and entering data in it. STEP 1. : Double click on the internet browser installed in your system. The internet browser can be either Internet Explorer (version 7 and above), Google Chrome, Mozilla Firefox etc. STEP 2. A window opens as shown below. Type the website address, in the address tab highlighted below. Page 2

 on the top right hand side of")
6 STEP 3. The PAS web portal opens as shown below. To enter data online, the ULB has to login using its username and password within the boxes (highlighted below) on the top right hand side of the page. Page 3

7 2. How to enter data in the online checklist STEP 1. Once the ULB logs into the web portal, the name of the ULB appears on the right hand side of the page. A Data Entry tab also appears as seen below. Click on the Data Entry tab. STEP 2. A sub-menu appears in which two tabs, Checklist and Target Setting, are provided. Click on the Checklist tab Page 4

8 STEP 3. A page describing the format of the online checklist opens. Please read through the general instructions given here for ease in data entry. Select the Financial Year, for example Page 5
9 STEP 4. The tab to view the online checklist for the Financial Year (FY) appears. Click on the View FY Checklist tab. Please note that the indicator report for the particular year would be generated only after the data for is submitted by the ULB. Page 6

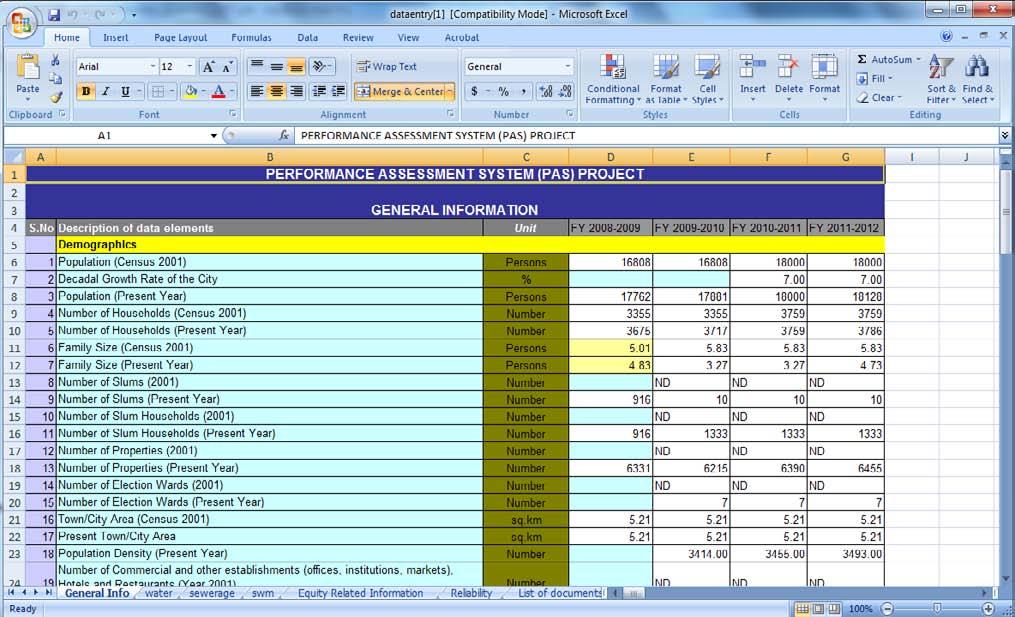
10 STEP 5. The checklist with tabs for each sub-section, like General Information, Water Supply etc. is displayed. The white cells are for data entry, while the yellow cells indicate the data that is pre-populated and cannot be edited. Subsequent sections on water supply, etc. can be entered in the same manner. Possible data sources for checklist are given in annex 1. Page 7

11 STEP 6. Once the data entry for a particular sub-section (e.g. Demographics in the previous image) is complete, click Save at the end of the sub-section (e.g. Demographics). It is advisable to save after each sub-section to ensure that data is not lost due to connectivity issues, etc. STEP 7. In case, there is any error in data entry for a particular sub-section (like water supply, etc.), click Reset to erase the data for that particular page. An alert window opens to confirm whether to reset the data. It must be noted that all data in that particular page will be erased, once reset is selected. Page 8


12 STEP 8. Click Submit once the user has finalised and saved the data for each sub-section. Once the sheet is submitted, the data cannot be edited/updated without approval by the administrator. Therefore, it is necessary to make sure the data is correct and verified to the extent possible before submitting the checklist. If the ULB overlooks saving any sub-section, an alert appears upon submitting the checklist prompting the ULB to save the section. Page 9


13 STEP 9. Once the sheet is submitted, the indicator report for that particular year can be viewed as shown below. An additional window displaying the indicator report will open as seen below. Page 10

14 STEP 10. Click on Go Back to Data Entry to return to the Data Entry page. Click on the Checklist. Page 11


15 STEP 11. Select the Financial Year and Language for which the checklist has to be downloaded. A new tab opens with a window asking whether to open or save the checklist. Choose the appropriate option to view the checklist as shown below. Page 12
16 Page 13


17 3. How to approve/reject the checklist Once data is entered in the checklist, it has to be verified both by the city commissioner or chief officer and in some cases, by the district collector. The process flow is explained in the adjoining figure. Designation Flow Approval Status State SLB Cell Gujarat/Maharashtra Pending District Collector DEF District Collector Pending Date of Approval/Rejection Data entry by ULB. Verification of data by commissioner/ chief officer. Verification by district collector. Status of checklists submitted and verified by State SLB Cell. City Commissioner/Chief Officer ABC Chief Officer Approved December 10, 2011 City Data Entry Operator ABC Submitted December 1, 2011 STEP 1. Once the checklist has been submitted by the data entry operator of a city, the chief officer/commissioner using his/her login has to verify the checklist (as mentioned in Chapter 1, step 3). Page 14


18 STEP 1. a. Verification by viewing the Checklist STEP 1. b. Verification by viewing the Indicator Report STEP 2. Once the Checklist gets verified, it can be approved/rejected and appropriate remarks can also be added. STEP 2 a. The status of verification of the Checklist can be viewed by clicking the Hierarchy tab. Page 15


19 STEP 2 b. The Hierarchy Chart shows the cleared stages in green and pending stages in red. The date on which the stages are cleared can also be seen. STEP 3. On selecting either of the two options, an alert window is displayed asking for confirmation of the action. The figure below shows the displayed alert window seeking approval of the selected checklist. The process described above is similar for verification at higher levels, like district collector, etc. Page 16


20 4. How to enter targets online? STEP 1. As mentioned in Chapter 2: step 1, login into the portal. Click the Target Setting tab. STEP 2. Select the Financial Year for which the targets need to be entered. For instance, click on Get FY Target Setting tab. Page 17

21 STEP 3. The ULB can now enter the targets for each indicator for all the sectors of Water Supply, Wastewater, SWM and SWD. Once the targets are entered for each sector, click Submit to complete target entry. There are also options to download the target values in either excel or pdf format. Page 18


22 5. How to track the cities submission of data? The State SLB Cell can use the Online Status Tracker to monitor the status of the cities that have submitted the checklist or are yet to do so. The tracker also provides the percentage of indicators that are generated based on data submitted by each city. This helps in following up with cities on specific aspects in the checklist. STEP 1. Login using the State SLB Cell s username and password on the right hand side of the page. Click on the Admin tab. Page 19


23 STEP 2. A sub-menu appears. Click on Checklist. Select Class and Financial Year for which the checklists are to be tracked. Page 20

24 6. How to view the graphical charts online The cities can view the data online in the form of graphs and/or tables. One such page is the State Profile. Averages across classes in each state are shown for all the performance indicators specified under SLB. STEP 1. Select State, the Financial Year for which the charts need to be viewed and the indicator group. Submit to view the charts. Page 21
25 Additionally, the cities can view their individual City Profiles, compare against their peers as well as other cities on specific indicators once they log in to the portal. Page 22

26 STEP 2. Select Know Your City to view the various charts related to city s UWSS services. Page 23


27 STEP 3. On selecting the Overview, the context or background information related to water supply and sanitation is displayed as shown below. Page 24


28 STEP 4. Select City Profile to view sector-wise indicator charts. Page 25


29 STEP 5. Select Compare Your City to compare the city s performance against other cities. Page 26
30 Annex 1: Possible data sources for checklist 1.1. General Information Sr. Description of data elements Unit Description Possible sources of data Demographics 1.1. Population (Census 2001/2011) 1.2. Decadal Growth Rate of the City Persons Percentage (%) Population figures for 2001 for the years and are to be entered here. For 2011, provisional population figures can be provided This shows the growth of the city s population over a period of ten years 1.3. Population (Present Year) Persons Population figures are updated by statistical projections between census/ survey years. Typically, the annual growth rate for the period may be used to arrive at population estimates for the current year 1.4. of Households (Census 2001/2011) 1.5. of Households (Present Year) 1.6. Family Size (Census 2001/2011) Persons Household figures for 2001, based on population of 2001 are to be entered here. Similarly, for 2011, number of households based on 2011 population is to be given. This is derived from population figures given for the present year This is automatically generated based on population and number of households for 2001/ Family Size (Present Year) Persons This is automatically generated based on population and number of households for the present year 1.8. of Slums (2001/2011) of slum settlements provided in census 2001/2011 is to be provided 1.9. of Slums (Present Year) of Slum Households (2001/2011) of Slum Households (Present Year) of Properties (2001/2011) of Properties (Present Year) of slum settlements and households are obtained from the city s Urban Community Department (UCD) in most cases of slum settlements provided in census 2001/2011 is to be provided of slum settlements and households are obtained from the city s UCD in most cases. It is also likely that surveys for Below Poverty Line (BPL) have been conducted from which number of slum households can be obtained of properties in the city as recorded by Census of properties in the city in the current year Census Based on trend from current year Population and housing (households, properties) information are normally obtained from census and surveys; or Town Planning Department Census Population and housing (households, properties) information are normally obtained from census and surveys; or Town Planning Department Census UCD, Surveys for BPL families which covers slum settlements as well Census UCD, Surveys for BPL families which covers slum settlements as well. Census Property tax records Page 27
31 Sr of Election Wards (2001/2011) of Election Wards (Present Year) Town/City Area (Census 2001/2011) Description of data elements Unit Description Possible sources of data Square kilo metre (Sq. km) of election wards in the city as recorded by Census of election wards in the current year Area in the city as recorded by Census Census Town Planning Department Census Present Town/City Area Sq. km Area of the city in the present year Town Planning Department Population Density (Present Year) of Commercial and other Establishments (Offices, Institutions, Markets), Hotels and Restaurants (Year 2001/2011) of Commercial and other Establishments (Offices, Institutions, Markets, Hotels and Restaurants) (Present Year) This is obtained by dividing population for the present year by area of the city Census Page 28
32 1.2.Water supply Sr. Description of data elements Unit Description Possible sources of data Water Service Coverage - of Connections Only Residential connections are to be entered 1.1. Domestic Connections (Metered Functional) 1.2. Domestic Connections (Metered n- Functional) 1.3. Domestic Connections (Unmetered) Domestic Connections (Total) 1.4. Bulk Supply Apartments (Metered Functional) 1.5. Bulk Supply Apartments (Metered n- Functional) 1.6. Bulk supply Apartments (Unmetered) Bulk Supply Apartments (Total) 1.7. Bulk Supply Layouts/Societies (Metered Functional) 1.8. Bulk Supply Layouts/Societies (Metered n- Functional) 1.9. Bulk Supply Layouts/societies (Unmetered) Bulk Supply Layouts/Societies (Total) Others - Specify (Metered Functional) Others - Specify (Metered n-functional) of domestic metered connections that are functional of domestic metered connections that are non-functional. of domestic connections that are not metered. the total number of domestic connections. Bulk supply connections include apartments, condominiums with single bulk connection serving several residential units (households). of metered connections that are functional. Bulk supply connections include apartments, condominiums with single bulk connection serving several residential units (households). of metered connections that are non-functional. Bulk supply connections include apartments, condominiums with single bulk connection serving several residential units (households). of non-metered connections. the total number of bulk supply connections. Bulk supply connections to apartment complexes or societies. of such metered connections that are functional. Bulk supply connections to apartment complexes or societies. of such metered connections that are nonfunctional. Bulk supply connections to apartment complexes or societies. of such connections that are not metered. total number of bulk supply connections in layouts/societies. Any other metered and functional connections, which cannot be included in the above nomenclature. Any other metered and non-functional connections, which cannot be included in the above nomenclature. Property Tax Software, Water Connection Register, Directorate of Municipalities (DoM) Patrak/Inspection Report Property Tax Software, Water Connection Register, DoM Patrak/Inspection Report Property Tax Software, Water Connection Register, DoM Patrak/Inspection Report Property Tax Software, Water Connection Register, DoM Patrak/Inspection Report Property Tax Software, Water Connection Register, DoM Patrak/Inspection Report Property Tax Software, Water Connection Register, DoM Patrak/Inspection Report Property Tax Software, Water Connection Register, DoM Patrak/Inspection Report Property Tax Software, Water Connection Register, DoM Patrak/Inspection Report Property Tax Software, Water Connection Register, DoM Patrak/Inspection Report Property Tax Software, Water Connection Register, DoM Patrak/Inspection Report Property Tax Software, Water Connection Register, DoM Patrak/Inspection Report Page 29
33 Sr. Description of data elements Others - Specify (Unmetered) Unit Description Possible sources of data Any other unmetered connections, which cannot be included in the above nomenclature. Others - Specify (Total) total number of other connections. Total of Water Supply Connections - Residential Water Service Coverage - Households Served total number connections. Property Tax Software, Water Connection Register, DoM Patrak/Inspection Report Households Served by Domestic Connections Households Served by Bulk Supply - Apartments Households Served by Bulk Supply - Layouts/Societies Total Households Served with Water Supply Preferably, households served should come directly from connection register. In its absence, multiply the number of each type (ferrule size) of domestic connection by the average number of persons served by each type of connection and divide the product by average household size or multiply the number of each type of connection by the average number of households served by each type of connection. This figure should not include households served by own sources, such as wells, hand pumps, etc. Preferably, households served should come directly from connection register. In its absence, multiply the number of each type (ferrule size) of bulk supply-apartment connection by the average number of persons served by each type of connection and divide the product by average household size or multiply the number of each type of connection by the average number of households served by each type of connection. This figure should not include households served by own sources, such as wells, hand pumps, etc. Preferably, households served should come directly from connection register. In its absence, multiply the number of each type (ferrule size) of bulk supply-layouts/societies connection by the average number of persons served by each type of connection and divides the product by average household size or multiply the number of each type of connection by the average no. of households served by each type of connection. This figure should not include households served by own sources, such as wells, hand pumps, etc. total number of households served with water supply. *Households served by own sources such as wells, hand pumps shall not be included Property Tax Software, Water Connection Register, DoM Patrak/Inspection Report Property Tax Software, Water Connection Register, DoM Patrak/Inspection Report Property Tax Software, Water Connection Register, DoM Patrak/Inspection Report Page 30
34 Sr. Description of data elements Water Production Capacity Unit Description Possible sources of data 2.1. Installed Capacity of Treatment Plants for Surface Water Sources 2.2. Volume of Water Produced through Surface Water Sources 2.3. Installed Capacity of Treatment Plants for Ground Water Sources 2.4. Volume of Water Produced through Ground Water (Power Pumps) 2.5. Volume of Water Produced through any Other Sources Million litres per day () Indicate the total water treatment capacity for surface water sources on a daily basis. Ideally, the records are maintained on daily basis in the stations log-sheet and reported on ly basis. From ly records, estimation of the water quantity of daily average is to be noted here. Indicate the total water treatment capacity for ground water sources on a daily basis. Ideally, the records are maintained on daily basis in the pumping stations log-sheet and reported on ly basis. From ly records, estimation of the water quantity of daily average is to be noted here. Ideally, the records are maintained on daily basis in the pumping stations log-sheet and reported on ly basis. From ly records, estimation of the water quantity on a daily basis, from any other sources is to be noted here. Total Installed Capacity total installed capacity of the treatment plants. Total Volume of Water Produced Water Consumption total installed capacity of the treatment plants. Computerised/Manual logbooks of flow meters/pumping hours of the treatment plant Computerised/Manual logbooks of flow meters/pumping hours of the treatment plant Computerised/Manual logbooks of flow meters/pumping hours of the treatment plant Computerised/Manual logbooks of flow meters/pumping hours of the treatment plant Computerised/Manual logbooks of flow meters/pumping hours of the treatment plant 2.6. Volume of Water Billed from Domestic Connections Volume of water consumed from piped supplies to billed domestic connections. Ideally, volume is to be noted through consumer water meters. In case of non-working /unmetered connections, estimation based on surveys of ly household consumption. Ideally, volume is to be noted through consumer water meters. In case of non-working /unmetered connections, estimation based on surveys of ly household consumption. Ideally, volume is to be noted through consumer water meters. In case of non-working /unmetered connections, estimation based on surveys of ly household consumption Volume of Water Billed from Bulk supply Apartments Volume of water consumed from piped supplies to apartments with billed bulk supply connections Volume of Water Billed from Bulk supply Layouts/Societies Volume of water consumed from piped supplies to layouts/societies with billed bulk supply connections. Page 31
35 Sr. Description of data elements 2.9. Volume of Water Billed from n-domestic Connections Volume of Water Billed from Public Taps Volume of Water Billed from any Other Sources Total Volume of Water Billed Total Volume of Water Unbilled (Free Supplies to Public Taps) Total Volume of Water Unbilled (Free Connections e.g. Religious Institutions etc.) 3.1. Total Volume of Water Produced 3.2. Total Volume of Water Billed 4.1. n-domestic including Commercial/Industrial/In stitutional (Metered Functional) 4.2. n-domestic including Commercial/Industrial/In stitutional (Metered n- Functional) 4.3. n domestic including Commercial/Industrial/In stitutional (Unmetered) n-domestic including Commercial/Industrial/I nstitutional (Total) 4.4. Public Taps (Metered Functional) 4.5. Public Taps (Metered n-functional) Unit Description Possible sources of data Volume of water consumed from piped supplies to billed n-domestic connections. Volume of water consumed from piped supplies to billed public taps. Volume of water consumed from piped supplies to any other billed sources. total volume of water consumed from billed connections Volume of water consumed from free supplies to public taps and hand-pumps. Volume of water consumed from free supplies to religious institutions etc. the total water produced. total water billed. Provide the number of non-domestic connections which are metered and functional. Provide the number of non-domestic connections which are metered and nonfunctional. Provide the number of non-domestic connections which are not metered. total non-domestic connections Provide the number of public taps which are metered and functional Provide the number of public taps which are metered and non-functional Ideally, volume is to be noted through consumer water meters. In case of non-working /unmetered connections, estimation based on surveys of ly household consumption. Ideally, volume is to be noted through consumer water meters. In case of non-working /unmetered connections, estimation based on surveys of ly household consumption. Ideally, volume is to be noted through consumer water meters. In case of non-working /unmetered connections, estimation based on surveys of ly household consumption. On the basis of number of public taps and hand-pumps and the average quantum of supply. On the basis of number of free connections and the average quantum of supply. Property Tax Software, Water Connection Register, DoM Patrak/Inspection Report Property Tax Software, Water Connection Register, DoM Patrak/Inspection Report Property Tax Software, Water Connection Register, DoM Patrak/Inspection Report Municipal Records Municipal Records Page 32
36 Sr. Description of data elements Unit Description Possible sources of data 4.6. Public Taps (Unmetered) Provide the number of public taps which are not metered Public Taps (Total) total number of public taps. Total of Metered and Functional Connections (Domestic, Bulk Supply, Others) Total of Water Supply Connections Water Supply Frequency total metered and functional connection. total water supply connections. Municipal Records 5.1. Days of Supply per Month 5.2. Hours of Supply per Day to Consumer Consumer Services Average days of water supply per based on pump operators records. This can be provided based on records maintained by pump operators at each valve operating point. Hours Average duration of supply (hours/day). This can be obtained from each ward or distribution zone and averaged out based on the population covered for the entire network Complaints Received During the Year 6.2. Complaints Resolved within 24 Hours during the Year Treated Water Quality Surveillance Total number of complaints received in a year. Total number of complaints redressed within 24 hours of registering. Computerised/Manual consumer grievance redressal records Computerised/Manual consumer grievance redressal records 7.1. Residual Chlorine (RC) - of Samples Taken at the Source/ Outlet of Water Treatment Plant (in a year) Records on number of samples taken at source are ideally available on a daily/ly basis, which has to be averaged out on a yearly basis. RC test reports for internal audits and for those conducted by external quality checking agencies. DoM Patrak 7.2. RC - of Samples taken at Intermediate Points (in a Year) Records on number of samples taken at intermediate points are ideally available on a daily/ly basis, which has to be averaged out on a yearly basis. RC test reports for internal audits and for those conducted by external quality checking agencies. DoM Patrak 7.3. RC - of Samples taken at Consumer End (in a year) Records on number of samples taken at consumer end are ideally available on a daily/ly basis, which has to be averaged out on a yearly basis. RC test reports for internal audits and for those conducted by external quality checking agencies. DoM Patrak 7.4. Total Samples Taken for RC Tests (if location-wise samples are not available) Records on no. of samples taken overall are available on a daily/ly basis, which has to be averaged out on a yearly basis. RC test reports for internal audits and for those conducted by external quality checking agencies. DoM Patrak Total Samples taken for RC Tests total number of RC samples 7.5. of Samples Passed Records on number of samples passed are ideally available on a daily/ly basis, which has to be averaged out on a yearly basis. Page 33
37 Sr. Description of data elements 7.6. Physical/Chemical - of Samples taken at the Source/Outlet of Water Treatment Plant (in a year) 7.7. Physical/Chemical - of Samples taken at Intermediate Points (in a year) 7.8. Physical/Chemical - of Samples taken at Consumer End (in a year) 7.9. Total Samples taken for Physical/Chemical Tests (if location-wise samples are not available) Total Samples taken for Physical and Chemical tests of Samples Passed Bacteriological - of Samples taken at the Source/Outlet of Water Treatment Plant (in a year) Bacteriological - of Samples taken at Intermediate Points (in a year) Bacteriological - of Samples taken at Consumer End (in a year) Total Samples taken for Bacteriological Tests (if location-wise samples are not available) Total Samples taken for Bacteriological Tests of Samples Passed Total of Samples Taken for All Types of Tests Unit Description Possible sources of data Records on number of samples taken at source are ideally available on a daily/ly basis, which has to be averaged out on a yearly basis. Records on number of samples taken at intermediate points are ideally available on a daily/ly basis, which has to be averaged out on a yearly basis. Records on number of samples taken at consumer end are ideally available on a daily/ly basis, which has to be averaged out on a yearly basis. Records on number of samples taken overall are available on a daily/ly basis, which has to be averaged out on a yearly basis. total number of physical and chemical samples Records on number of samples passed are ideally available on a daily/ly basis, which has to be averaged out on a yearly basis. Records on number of samples taken at source are ideally available on a daily/ly basis, which has to be averaged out on a yearly basis. Records on number of samples taken at intermediate points are ideally available on a daily/ly basis, which has to be averaged out on a yearly basis. Records on number of samples taken at consumer end are ideally available on a daily/ly basis, which has to be averaged out on a yearly basis. Records on number of samples taken overall are available on a daily/ly basis, which has to be averaged out on a yearly basis. total number of physical and chemical samples Records on number of samples passed are ideally available on a daily/ly basis, which has to be averaged out on a yearly basis. total number of samples of all types of tests. Total Tests Passed total number of tests passed Page 34
38 Sr. Description of data elements Unit Description Possible sources of data Financial Information - Operating Expenses 8.1. Regular Staff and Administration 8.2. Outsourced/Contract Staff Costs 8.3. Electricity Charges/Fuel Costs 8.4. Chemical Costs 8.5. Repairs/Maintenance Costs 8.6. Bulk (Raw/Treated) Water Charges 8.7. Other Costs Total Operating Expenditure Financial Information - Operating Revenues Payments in lieu of staff and administrative expenditure. Payments in lieu of salaries to outsourced or contracted staff Payments in lieu of Electricity Charges/Fuel Costs Payments in lieu of Chemical Costs Expenditure incurred in lieu of repairs or maintenance of the Water supply system Expenditure incurred in lieu of bulk water purchase Expenditure incurred in lieu of other costs total Operating Expenditure 8.8. Arrears at the Beginning of the Year 8.9. Revenue Demand from User Charges Revenue Demand From Tax/Cess - Water Service Only Revenue Demand From Other Revenues (e.g. Connection Costs/Donations etc.) Total Revenue Demand for Previous Year 9.1. Total Revenue Demand for Previous Year (From User Charges, Taxes etc.) 9.2. Collection Against Arrears 9.3. Collection Against the Current Demand of the Year Rs. Additional Information (Optional) Staff Information Outstanding revenues in lieu of arrears in the beginning of the financial year. Revenue demand from user charges (from customers with water connections). Revenue demand from tax/cess from water service only. Revenue demand from other revenues (e.g. connection costs/donations etc.). total Revenue Demand for previous year total Revenue Demand for previous year Total collections in the financial year against arrears. Total collections in the financial year against the current demand Senior Management (Sanctioned) of sanctioned staff in senior managerial posts. Mahekam paripatrak for sanctioned staff and other municipal records Page 35
39 Sr. Description of data elements Senior Management (Working) Unit Description Possible sources of data of staff working in senior managerial posts Engineers (Sanctioned) of posts sanctioned for engineers. Mahekam paripatrak for sanctioned staff and other municipal records Engineers (Working) of engineers working currently Clerks/Accountants (Sanctioned) Clerks/Accountants (Working) Work Inspectors/Meter Readers (Sanctioned) Work Inspectors/Meter Readers (Working) Electricians/Fitters (Sanctioned) Electricians/Fitters (Working) Lines Men/Plumbers (Sanctioned) Lines Men/Plumbers (Working) of posts sanctioned for clerks/accountants. of clerks/accountants working currently. of posts sanctioned for work inspectors/meter readers. of work inspectors/meter readers working currently. of posts sanctioned for electricians/fitters. of electricians/fitters working currently. of posts sanctioned for Lines men/plumbers. of lines men/plumbers working currently. Mahekam paripatrak for sanctioned staff and other municipal records Mahekam paripatrak for sanctioned staff and other municipal records Mahekam paripatrak for sanctioned staff and other municipal records Mahekam paripatrak for sanctioned staff and other municipal records Labourers (Sanctioned) of posts sanctioned for labourers. Mahekam paripatrak for sanctioned staff and other municipal records Labourers (Working) of labourers working currently. Total (Sanctioned) total number of sanctioned staff. Total (Working) total number of staff working. Connection Costs for Water Connections Residential - General Rs Connection costs for residential connections Residential - Urban Poor Rs Connection costs for residential connections in slums Institutional Rs Connection costs for institutional connections Commercial Rs Connection costs for commercial connections Industrial Rs Connection costs for industrial connections. Water Tariff Structure - Flat Rate Tariff Residential - General Rs./ Month Residential - Urban Poor Rs./ Month Institutional Rs./ Month Commercial Rs./ Month Tariff for residential connections. Tariff for residential connections in slums. Tariff for institutional connections. Tariff for commercial connections. Page 36
40 Sr. Description of data elements Unit Description Possible sources of data Industrial Rs./ Month Tariff for industrial connections. Water Tariff Structure - Volumetric Tariff Residential - General Rs./Kilol iter (KL) Unit rate for residential connections in non slum areas based Residential - Urban Poor Rs./KL Unit rate for residential connections in slum areas Institutional Rs./KL Unit rate for institutional connections Commercial Rs./KL Unit rate for commercial connections Industrial Rs./KL Unit rate for industrial connections. Page 37
41 1.3.Sewerage and Drainage Sr. Description of data elements Sanitation Coverage Unit Description Possible sources of data 1.1. Total of Properties in the City number of properties entered in the demographics section Properties with Toilets This is the total number of properties, both residential and non-residential, having access to individual or community toilets Households Dependent on Functional Community Toilets 1.4. Total of Properties with Access to Toilets 2.1. Total of Properties in the City 2.2. Properties with Sewer Connections Properties with Onsite Sanitary Disposal. of households (mostly in slum settlements) having access to community toilets that are functional. the properties with toilets and households dependent on functional community toilets. number of properties entered in the demographics section. of properties, residential and nonresidential, connected to sewerage network. of properties, residential and nonresidential, connected to on-site sanitation systems like septic tanks. Wastewater Production - Volume of Water Consumed and Waste Water Generated Sanitary Inspector, Sanitation Department Sanitary Inspector, Sanitation Department / UCD Property Tax Software/ Sanitation Department Property Tax Software/ Sanitation Department 3.1. Volume of Water Consumed and Billed from Domestic Connections 3.2. Volume of Water Consumed and Billed From Bulk Supply - Apartments 3.3. Volume of Water Consumed and Billed from Bulk Supply - Layouts/Societies 3.4. Volume of Water Consumed and Billed from n-domestic Connections 3.5. Volume of Water Consumed (both Billed and Unbilled) from Public Taps 3.6. Volume of Water from Free Supplies (other connections) 3.7. Volume of Water Consumed and Billed from any other ULB Sources value entered in water supply Question 2.6. value entered in water supply Question 2.7. value entered in water supply Question 2.8. value entered in water supply Question 2.9. value entered in water supply Question This is automatically generated from water supply sheet. This is automatically generated from water supply sheet. Page 38
42 Sr. Description of data elements 3.8. Volume of Water Consumed from any n-ulb Water Sources 3.9. Total Water Consumption (Billed and Unbilled) from ULB and n-ulb sources) Volume of Wastewater Generated from Domestic Water Consumption Volume of Wastewater Generated from Bulk Supply - Apartments Volume of Wastewater Generated from Bulk Supply - Layouts/Societies Volume of Wastewater Generated from ndomestic Water Consumption Volume of Wastewater Generated from Public Tap Water Consumption Volume of Wastewater Generated from Free Supplies (Other Connections) Volume of Wastewater Generated from Other ULB Source Water Consumption Volume of Wastewater Generated from n- ULB Source Water Consumption Total Wastewater Generated Wastewater Collection and Treatment Unit Description Possible sources of data Volume of water consumed from non municipal sources like private supply, etc. This is automatically generated from water supply sheet. 80% of Question % of Question % of Question % of Question % of Question % of Question % of Question % of Question 3.8. total of Question Water Supply Department Volume of Sewage Actually Treated at the Primary Treatment Plant Quantity of wastewater received at the inlet of the sewage treatment plant (STP) having only primary treatment capacity. Log records at STP, Sewerage/Sanitation Department Volume of Sewage Actually Treated at Secondary Treatment Plant Quantity of wastewater received at the inlet of the STP having secondary treatment capacity. Log records at STP, Sewerage/Sanitation Department Total Volume of Wastewater Collected and Treated at Sewage Treatment Plants total of Question Installed Capacity of Primary Treatment Plant Total installed capacity of STP having only primary treatment. Log records at STP, Sewerage/Sanitation Department Page 39
43 Sr. Description of data elements 4.2. Installed Capacity of Secondary Treatment Plant 4.3. Total Installed Capacity (Primary + Secondary Treatment) 4.4. Total Wastewater Generated 5.1. Volume of Sewage Actually Treated at Secondary Treatment Plant 5.2. Volume of treated Wastewater Reused after Secondary Treatment Unit Description Possible sources of data Total installed capacity of STP having secondary treatment. total of Question This is automatically generated. Discharge Compliance after Secondary Treatment of Sewage Question Quantity of wastewater that is reused for purposed like irrigation, agriculture, etc. after secondary treatment. Log records at STP, Sewerage/Sanitation Department Log records at STP, Sewerage/Sanitation Department 6.1. of Treated Effluent Samples Tested (in a year) Records on number of effluent samples taken at sewage outfalls on a daily/ly basis, which has to be averaged out on a yearly basis. Test reports maintained at ULB labs/ sent to regional labs. DoM Patrak 6.2. of Treated Effluent Samples Passed (in a year) Records on number of effluent samples that have passed tests conducted at sewage outfalls on a daily/ly basis, which has to be averaged out on a yearly basis. Test reports maintained at ULB labs/ sent to regional labs. DoM Patrak Consumer Services 7.1. Sewage Related Complaints Received during the Year 7.2. Sewage Related Complaints Resolved within 24 hours during the Year Financial Information - Annual Operating Expenses Total number complaints received in a year. Total number of complaints redressed within 24 hours of registering. Computerised/Manual Consumer Grievance Redressal Records Computerised/Manual Consumer Grievance Redressal Records 8.1. Regular Staff and Administration 8.2. Outsourced/Contract Staff Costs 8.3. Electricity Charges/Fuel Costs 8.4. Chemicals Costs 8.5. Repairs/Maintenance Costs 8.6. Contractor Costs for Operation and Maintenance (O&M) 8.7. Others (Specify) Payments in lieu of staff and administrative expenditure. Payments in lieu of salaries to outsourced or contracted staff. Payments in lieu of electricity charges/fuel costs. Payments in lieu of chemical costs. Expenditure incurred in lieu of repairs or maintenance of the wastewater system. Expenditure incurred in lieu of bulk water purchase. Expenditure incurred in lieu of other costs. Page 40
44 Sr. Description of data elements Total Annual Operating Expenses Unit Description Possible sources of data Financial Information - Annual Operating Revenues 8.8. Arrears at the Beginning of the Year 8.9. Revenue Demand from User Charges - Sewerage Only Revenue Demand from Tax/Cess - Sewerage only Revenue Demand from other Sources (e.g. Connection Costs/ Donations etc.) Total Revenue Demand of the Previous Year 9.1. Total Revenue Demand of the Year 9.2. Collection Against Arrears 9.3. Collection Against Current Demand Storm Water Drainage Data Outstanding revenues in lieu of arrears in the beginning of the financial year. Revenue demand from user charges (from customers with sewer connections, etc.). Revenue demand from tax/cess from sewerage only. Revenue demand from other revenues (e.g. connection costs/donations etc.). total revenue demand for previous year. total revenue demand for previous year. Total collections in the financial year against arrears. Total collections in the financial year against the current demand Total Length of Road Network Total Length of Pucca Covered Drains of Flood Prone Points in the City Average Frequency of Flooding Km Length of road network. Town Planning Department/Public Works Department (PWD) Km Length of pucca covered drains. Drainage Department /PWD Additional Information (Optional) Staff Information Senior Management (Sanctioned) Senior Management (Working) of areas in the city prone to floods. Average number of hours of flooding in the city. of sanctioned staff in senior managerial posts. of staff working in senior managerial posts. Drainage Department /PWD Drainage Department /PWD Mahekam paripatrak for sanctioned staff and other municipal records Engineers (Sanctioned) of posts sanctioned for engineers. Mahekam paripatrak for sanctioned staff and other municipal records Engineers (Working) of engineers working currently Clerks/Accountants (Sanctioned) of posts sanctioned for clerks/accountants. Mahekam paripatrak for sanctioned staff and other municipal records Clerks/Accountants (Working) of clerks/accountants working currently. Page 41
45 Sr. Description of data elements Labourers/Cleaners (Sanctioned) Labourers/Cleaners (Working) Unit Description Possible sources of data of posts sanctioned for labourers/cleaners. of work labourers/cleaners working currently. Total (Sanctioned) total number of sanctioned staff. Total (Working) total number of staff working. Septage Management Mahekam paripatrak for sanctioned staff and other municipal records Does the ULB Practice Septage Management? Septage Sucking Machines Available within ULB Private Septage Machines Licensed by ULB Yes (Y)/ (N) Connection Costs for Sewerage Connections Septage management includes collection, transportation and treatment of waste from septic tanks. of machines owned by ULB to collect waste from septic tanks. of machines owned by private agencies and used by ULB to empty septic tanks Residential - General Rs Connection costs for residential connections Residential - Urban Poor Rs Connection costs for residential connections in slums Institutional Rs Connection costs for institutional connections Commercial Rs Connection costs for commercial connections Industrial Rs Connection costs for industrial connections. Sewerage Tariff Structure - Flat Rate Tariff Sanitation Department Sanitation Department Sanitation Department Residential - General Rs./Month Tariff for residential connections Residential - Urban Poor Rs./Month Tariff for residential connections in slums Institutional Rs./Month Tariff for institutional connections Commercial Rs./Month Tariff for commercial connections Industrial Rs./Month Tariff for industrial connections Sewerage Tariff Structure - Volumetric Tariff Residential - General Rs./KL Tariff for residential connections Residential - Urban Poor Rs./KL Tariff for residential connections in slums Institutional Rs./KL Tariff for institutional connections Commercial Rs./KL Tariff for commercial connections Industrial Rs./KL Tariff for industrial connections Page 42
46 1.4.Solid Waste Management Sr. Description of data elements Unit Description Possible sources of data Door to Door Collection - of Households and Establishments Covered by Door to Door Collection 1.1. of Households Covered by Door to Door Collection of households that are covered by door to door collection by ULB or private agencies. Sanitation/ SWM Department 1.2. of Hotels and Restaurants Covered by Door to Door Collection of hotels and restaurants that are covered by door to door collection by ULB or private agencies. Sanitation/ SWM Department 1.3. of Commercial Establishments (Institutions, Offices) Covered by Door to Door Collection of commercial establishments that are covered by door to door collection by ULB or private agencies. Sanitation/ SWM Department 1.4. of any other Establishments (including Markets) Covered by Door to Door Collection Any other establishments (including markets) that are covered by door to door collection by ULB or private agencies. Sanitation/ SWM Department 1.5. Total of Establishments Covered by Door to Door Collection (if type-wise establishments is not available) Total number of establishments that are covered by door to door collection by ULB or private agencies in case type wise establishment details are unavailable. Sanitation/ SWM Department Total of Households and Establishments covered by Door to Door Collection Question Waste Generation 2.1. Waste Generated by Households Metric Tonnes (MT)/ Quantity of waste generated by households/ residential properties. Sanitation/ SWM Department. Also Environment Status Reports/ SWM Detailed Project Reports (DPRs) 2.2. Waste Generated by Street Sweeping Quantity of waste generated by street sweeping. Sanitation/ SWM Department. Also Environment Status Reports/ SWM DPRs 2.3. Waste Generated by Hotels and Restaurants Quantity of waste generated by hotels and restaurants. Sanitation/ SWM Department. Also Environment Status Reports/ SWM DPRs 2.4. Waste Generated by Markets (Vegetable Markets, Mandis etc.) Quantity of waste generated by markets (vegetable markets, mandis etc.) Sanitation/ SWM Department. Also Environment Status Reports/ SWM DPRs 2.5. Waste Generated by Commercial Establishments (e.g. Institutions, etc.) Quantity of waste generated by commercial establishments (e.g. Institutions etc.) Sanitation/ SWM Department. Also Environment Status Reports/ SWM DPRs 2.6. Waste Generated by Other Sources (e.g. Debris, Horticulture Waste etc.) Quantity of waste generated by other sources (e.g. debris, horticulture waste etc.). Sanitation/ SWM Department. Also Environment Status Reports/ SWM DPRs Page 43
47 Sr. Description of data elements 2.7. Total Waste Generated (if type-wise generation is not available) Total Waste Generated Unit Description Possible sources of data Total quantity of waste generated estimated based on per capita waste generation norms (depending on population of city). Question Waste Collection and Transportation - Details of Waste Received at Processing/Disposal Facilities 2.8. Quantity of Waste Received at Processing and Recycling Facilities 2.9. Quantity of Waste Received at Disposal Sites Total Waste Received at Processing/Disposal Facility and Recycled Quantity of waste received at inlet of solid waste treatment plant. Quantity of waste received at inlet of solid waste treatment plant. total of Question Waste Collection and Transportation - Details of Waste Transported to Processing/Disposal Facilities of Trucks Used for Transportation of Waste of trucks used for transportation of waste from secondary bins to treatment/disposal site. Log records at Treatment Plant Log records at Treatment Plant Log records at Treatment Plant Capacity of Each Trucks MT Carrying capacity of each truck. Log records at Treatment Plant Total of Trips Made per Day by Each Truck to the Disposal Site Total quantity of waste collected by trucks of Dumper Placers Used for Transportation of Waste Capacity of Each Dumper Placer Total of Trips Made per Day by Each Dumper Placer to the Disposal Site Total Quantity of Waste Collected by Dumper Placers of Mini Lorries used for Transportation of Waste Capacity of Each Mini Lorry Total of Trips Made per Day by Each Mini Lorry to the Disposal Site Total Quantity of Waste Collected by Mini Lorries of Tractor Trailers Used for Transportation of Waste Capacity of Each Tractor Trailer Trips per day Total number of trips made each day to treatment/ disposal site. Question N umber of dumper placers used for transportation of waste from secondary bins to treatment /disposal site. Log records at Treatment Plant Log records at Treatment Plant MT Carrying capacity of each dumper placer. Log records at Treatment Plant Trips per day Total number of trips made each day to treatment/ disposal site. Question Log records at Treatment Plant of mini lorries used for transportation of waste from secondary bins to treatment /disposal site. Log records at Treatment Plant MT Carrying capacity of each mini lorry. Log records at Treatment Plant Trips per day Total number of trips made each day to treatment/ disposal site. Question Log records at Treatment Plant of tractor trailers used for transportation of waste from secondary bins to treatment /disposal site. Log records at Treatment Plant MT Carrying capacity of each tractor trailer. Log records at Treatment Plant Page 44