Latest Data on Water Pollution in Khyber Pakhtunkhwa Province of Pakistan
|
|
|
- Randolf Willis
- 5 years ago
- Views:
Transcription
1 Latest Data on Water Pollution in Khyber Pakhtunkhwa Province of Pakistan Dr. Muhammad Bashir Khan, Director General Environment Protection Agency (EPA)
 and training on Environmental Impact Assessment (EIA) from Asian Institute of Technology (AIT), Bangkok.")
2 Photo Dr. Muhammad Bashir Khan Working in the field of Environment for the last 31 years with current position as Director General, EPA since December Holding a PhD degree from University of Reading (UK) and training on Environmental Impact Assessment (EIA) from Asian Institute of Technology (AIT), Bangkok. Supervise technical and administrative wings of the EPA along with executing projects related to Capacity Building, Cleaner Production, Environmental monitoring and Climate Change. Supervising EIAs review process and prosecution for compliance of Environmental Laws. Actively representing the country Internationally, as a member of Chemical Review Committee (CRC) of Rotterdam Convention and as a National Expert on Hazardous Substances in Asian Productivity Organization (APO) and numerous other forums like ADB, UNDP, UNEP etc. 1 Strategies and Practices for Water Pollution Enforcement Workshop, November 8-10, Taipei

3 Pakistan 2
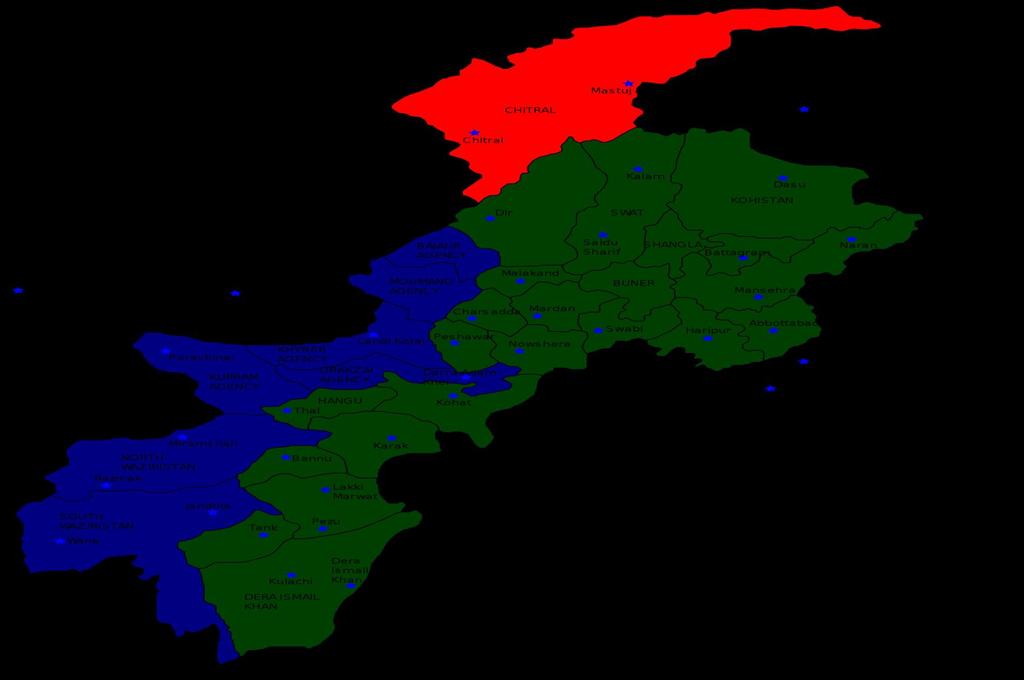
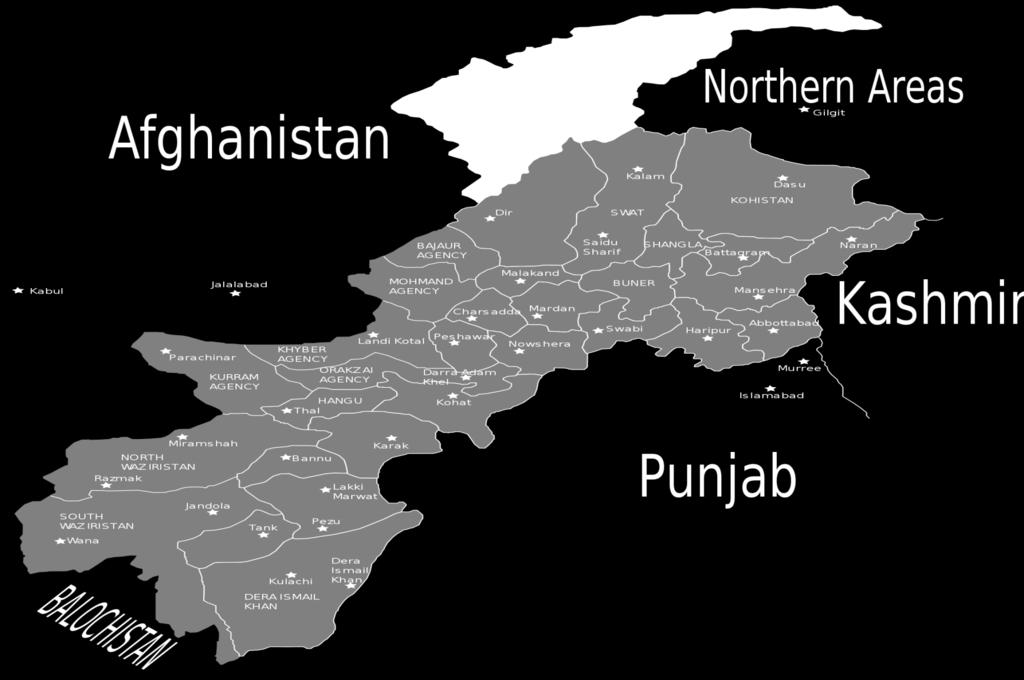
4 Khyber Paktunkhwa (KP) province 3
5 Khyber Paktunkhwa (KP) province Capital Area Peshawar 74,521 sq.km Latitude Longitude: Population 20,215,000 Estimated Density Languages 259 Sq. km Pashto, Saraiki, Urdu and Hindko Literacy Rate 49.9% Administrative Division 7 Districts 26 4
6 Water Resources of Pakistan Water-resources of Pakistan include surface water, rainfall, and groundwater. The extent of availability of these resources is location-specific. Surface water-resources of Pakistan are mainly based on the flows of the Indus River and its tributaries. Indus River has a total length of 2900 kilometres (Km) and the drainage-area is about 966,000 sq. Km. The 77-year record of the Indus River ( to ) indicates that the watersheds of the Indus River yield about MAF of water annually. 5
7 Water Resources of Khyber Pakhtunkhwa 70 per cent of the annual rainfall occurs in the months of June to September. It ranges between 125 mm in Balochistan (South East) to 750 mm in the Northwest. A large part of the rainfall, therefore, either floods the riverine areas and/or villages/cities near the rivers or flows into the sea without any economic benefit to the country. Northern and northwestern area of KP province receive comparatively high order of rainfall during winter. The magnitude of the annual rainfall over nearly 21 million hectares (Mha) of Indus Plains and Peshawar valley averages about 26 MAF. The present contribution of rain to crops in the irrigated areas is estimated at about 6 MAF 6
8 Water Resources of Pakistan/Khyber Pakhtunkhwa Groundwater: Most of the groundwater resources of Pakistan exist in the Indus Plain, extending from Himalayan foothills to Arabian Sea, and are stored in alluvial deposits. The aquifer has been built due to direct recharge from natural precipitation, river flow, and the continued seepage from the conveyance-system of canals, distributaries, watercourses and application-losses in the irrigated lands during the last 90 years. This aquifer, with a potential of about 50 MAF, is being exploited to an extent of about 38 MAF by over 562,000 private tubewells and about 10,000 public tubewells. 7
9 Water Resources of Pakistan/Khyber Pakhtunkhwa Rainfall:The province is located on the borders of two climatic regions; the Mediterranean in the west and the monsoon region in the east. Summer rainfall is brought by the south-west monsoon, while, Winter precipitation is brought by the winter cyclonic depression known as "western disturbances" originating over themediterranean Sea. Surface water: The major rivers that flow through the province are; Kabul, Swat, Chitral, Kunar, Siran, Panjkora, Bara, Kurram, Dor, Haroo, Gomal and Zhob. Ground Water: Kabul and Bara Rivers are the main streams and recharging resources of the local groundwater aquifers. 8
10 Water Pollution issue in KP Causes of Water Pollution Sanitation coverage in urban areas of Pakistan has been reported as 92% including 42% with sever connections. The coverage in rural areas was 41% including 6% with sewer connections. Situation is rather poor in Khyber Pakhtunkhnwa. Solid and liquid excreta are the major source of water pollution in the country and resultantly fundamental cause of widespread waterborne diseases. 9


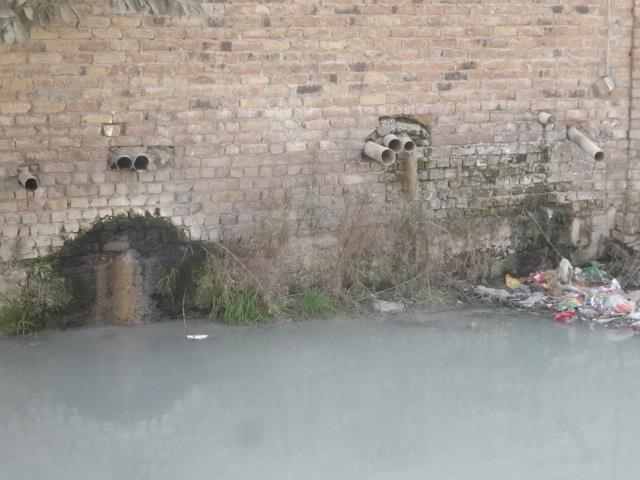
11 Surface water pollution Survey of the main river in KP has been completed. Concentration of Coliform bacteria in river Kabul water is 1600/100 ml of water. Main source is the untreated municipal effluents from the major cities. Most of the STPs are either non functional or are not working to their full capacity 10
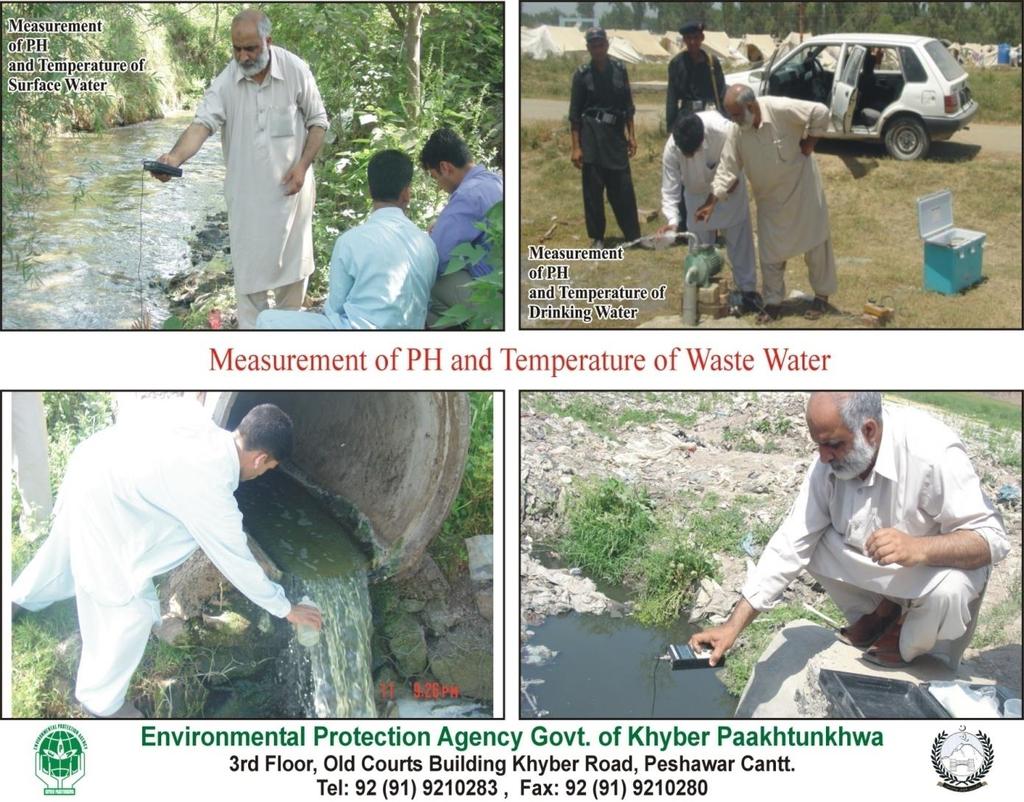
12 11 Surface water pollution rivers of KP province) Sr # Sample site Temp (C) ph TDS (mg/l) DO (mg/l) BOD (mg/l) COD (mg/l) NEQs River Indus River Kabul River swat River Siran River Kurram River Bara River Shah 7 Alam River Naguman River Adezai River Jinday River Brandu River Chitral River Panjkora


13 Surface water pollution (Canals system) 12


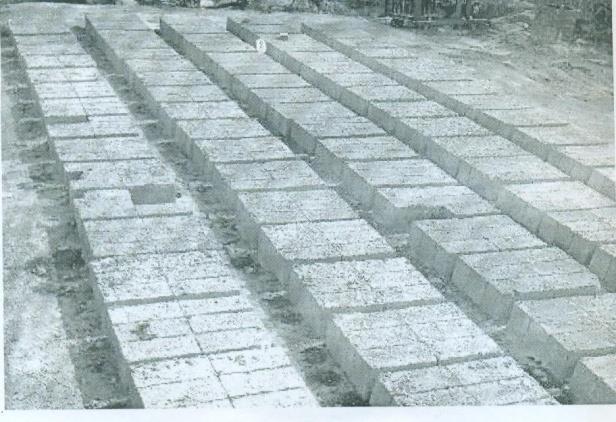
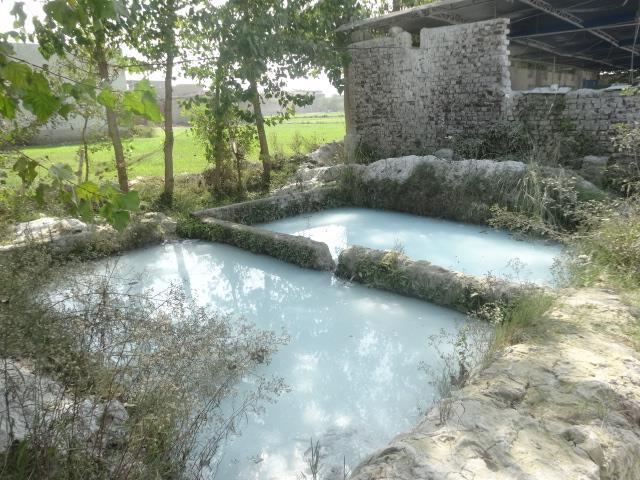
14 Surface water pollution (marble waste) 13


15 Surface water pollution (solid waste into Canals) 14


16 Surface water pollution (domestic effluents to canals) 15
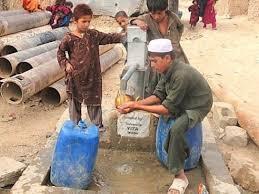
17 Drinking water pollution Overall access to improved drinking water sources in Pakistan is estimated at 95% urban and 87% rural. 71 % of the populations of KP (91 % of the urban population and 64% of the rural population) have access to an improved water source. 35% of KP is connected to any form of drainage system, the same is true for 47% of Pakistan. Water supply networks and treatment plants in major towns are in poor condition and in some cases existing infrastructure is completely destroyed. 16
18 17 Drinking water pollution Pakistan Council for Research in Water Resources (PCRWR) test water of 23 major cities. From the test results of drinking water samples collected from the proposed areas by EPA-KP, safe %age of sample. District Sample Collected Safe Unsafe Safe % Mardan Charsadda Nowshehra Swabi Battagram Mansehra Abbottabad Haripur Swat Malakand D.I khan Peshawar L. Marwat Bannu Karak Buner Shangla Chitral
19 18 Drinking water Access in KP Population of KP have access to safe drinking water of different districts and its Sanitation availability. Use of Safe Water Adequate Sanitation District Percentage District Percentage Bannu 84.8 Chitral 65.2 DI Khan 80.7 Haripur 57.1 Peshawar - Peshawar 56.1 Malakand 74.9 Abbotabad 54.5 L. Marwat 74.2 Kohat 45.4 Mardan 72.1 Nowshehra 44.8 Nowshehra 71.2 Swat 44.5 Swabi 69.8 Malakand 42.9 Swat 68.6 D.I.Khan 40.3 Kohat 67.6 Shangla 39.2 Karak 67.5 Swabi 38.8 Abbotabad 66.5 Mardan 37.8 Tank 64.3 Mansehra 36.9 Haripur 62.9 Lakki Marwat 31.4 Chitral 61.9 Bannu 31.3 Mansehra 58.1 Tank 30.1 Charsadda 57.8 Buner 26.7 Buner 54 Karak 26.6 Battagram 52.9 Charsadda 26.5 LowerDir 44.8 Battagram 25.5 Shangla 44.1 Lower Dir 23.5 UpperDir 22.5 UpperDir 11.4 Kohistan 10.6 Kohistan 3.1

20 19
21 Surface water pollution Implementation of NEQS on industry and Municipalities. Regular monitoring of water resources Pollution control. Awareness and training on effluent management (Marble industry a case study). Concrete Lining of Canals with zero entrance of domestic effluents Replacement of old and rusted water pipes. Free facility for drinking water testing Public awareness through print and electronic media. Prosecution. Cases in Environmental tribunals and Green Bench. 20
22 Thank you for your attention!

23 Awareness activities 22

24 Awareness Activities 23


25 Awareness Activities 24
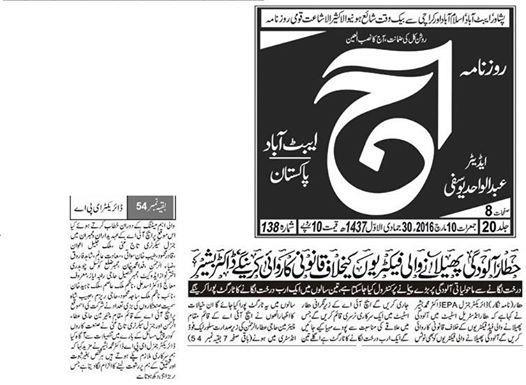
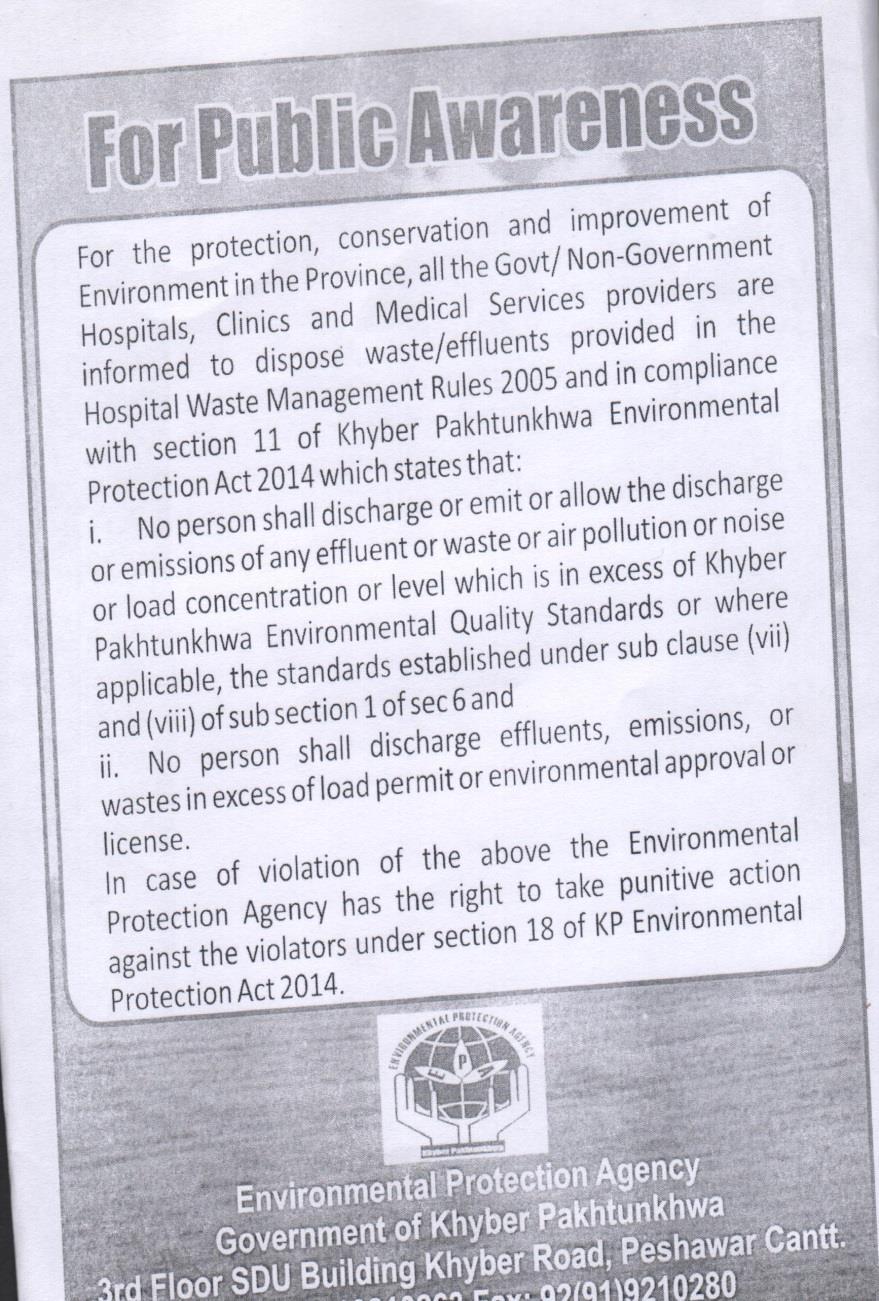
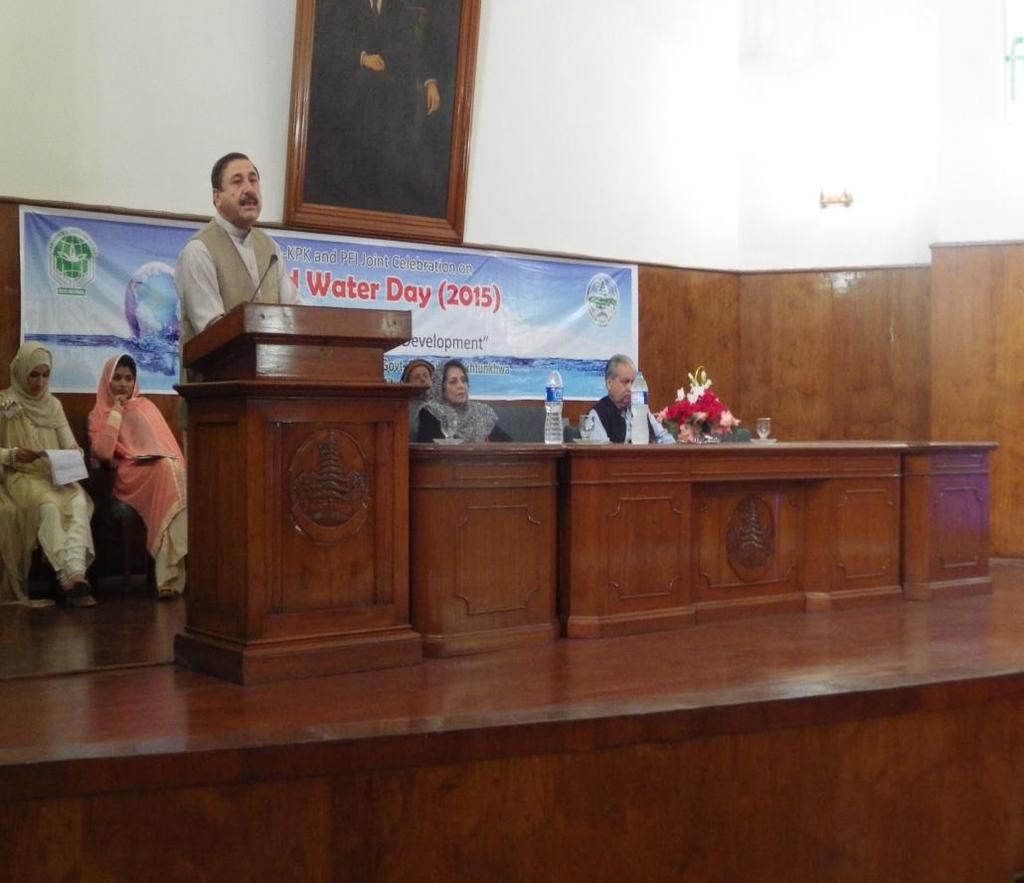
26 Awareness Activities 25


27 Surface water pollution 26
28 27
29 Thank you for your attention!