Capital Regional District Core Area Liquid Waste Management Plan. Sanitary Sewer Overflow Management Plan: 2014 Update. To Ministry of Environment
|
|
|
- Phebe Flowers
- 5 years ago
- Views:
Transcription


1 Capital Regional District Core Area Liquid Waste Management Plan Sanitary Sewer Overflow Management Plan: 2014 Update To Ministry of Environment Prepared by: Environmental Engineering Parks & Environmental Services Department
2
3 Capital Regional District Core Area Liquid Waste Management Plan Sanitary Sewer Overflow Management Plan: 2014 Update Table of Contents EXECUTIVE SUMMARY... i 1.0 Introduction Overview I&I Management Area Effects of Overflows on Human Health and the Environment Known Potential Overflow Locations Reporting Requirements I&I Subcommittee Reported Overflows ( ) General Summary of Overflows in the Core Area from 2008 to Overflow Management Plan Updates General Capital Regional District City of Colwood Township of Esquimalt City of Langford District of Oak Bay District of Saanich City of Victoria Town of View Royal First Nations CONCLUSIONS List of Tables Table 1 Number of Known Potential Overflow Points in the Core Area... 4 Table 2 Frequency of Overflows Classified by Cause and Receiving Environment Sensitivity Table 3 CRD Overflows Grouped by Receiving Environment Sensitivity Table 4 Prioritized Order of CRD Overflow Management Plan (Update) Table 5 Prioritized Order of Colwood Overflow Management Plan (Update) Table 6 Summary of Esquimalt s Sewer Rehabilitation Table 7 Prioritized Order of Esquimalt Overflow Management Plan (Update) Table 8 Prioritized Order of Langford Overflow Management Plan (Update) Table 9 Prioritized Order of Oak Bay Overflow Management Plan (Update) Table 10 Prioritized Order of Saanich Overflow Management Plan (Update) Table 11 James Bay Project Rehabilitation Follow-up I&I Results Table 12 Prioritized Order of Victoria Overflow Management Plan (Update) Table 13 Prioritized Order of View Royal Overflow Management Plan (Update) List of Figures Figure 1 Map of the Core Area... 3 Figure 2 Map: Existing Core Area Wastewater Infrastructure... 7 Figure 3 Graphical Comparison of Rainfall vs. Number of Overflows Figure 4 James Bay I&I Pilot Project Map... 30
4
5 CAPITAL REGIONAL DISTRICT CORE AREA LIQUID WASTE MANAGEMENT PLAN SANITARY SEWER OVERFLOW MANAGEMENT PLAN: 2014 UPDATE EXECUTIVE SUMMARY On July 3, 2014, the Minister of Environment approved the Capital Regional District s Amendment No. 9 to the Core Area Liquid Waste Management Plan (LWMP) subject to four conditions being met by December 31, Condition No. 2 to the Minister s approval requires that the CRD submit a Wet Weather Flow Management progress report that includes an update on the progress made to date in achieving the LWMP commitment to eliminate sanitary and combined sewer overflows. This progress report was written to satisfy that requirement. Section 5 of the LWMP entitled Management of Infiltration and Inflow and the Control of Wastewater Overflows includes the individual overflow reduction plans for the CRD and each of the core area municipalities. Background Rainwater and groundwater that mistakenly enters the sanitary sewer system is referred to as inflow and infiltration (I&I). Inflow refers to rainwater that enters the sewer system through improper plumbing connections such as cross-connections with storm drains. Infiltration refers to groundwater that seeps into the sanitary sewer through cracks or joints in the sewer pipe. A certain amount of I&I is unavoidable and is accounted for in routine sewer design. However, when I&I exceeds design allowances, sewer capacity is consumed, and may result in overflows, risks to health, damage to the environment, and increased conveyance costs. In the core area, the overall length of the sewer system can be broken down as follows: 45% municipal sewers; 40% private property laterals; 10% public property laterals; 5% regional sewers. Municipalities and regional districts tend to proactively inspect and fix their sewers. Conversely, private property owners rarely inspect or perform maintenance on their sewer laterals unless they are adversely impacted by a problem. Since 2001, the CRD has collected valuable sewer flow monitoring data for the core area. Initially, the monitoring was done with a small number of portable flow meters. The monitoring has since expanded to include over 90 permanent meters and 20 portable meters with the CRD analyzing the data collected. The results are documented in I&I analyses reports which are submitted to the Core Area Liquid Waste Management committee annually. In addition, the CRD has prepared a number of reports for the Province as required by the LWMP including: biennial update reports (2005, 2007, and 2009), the Overflow Management Plan (2008) and the I&I Management Plan (2012). The Core Area Sanitary Sewer Overflow Management Plan (2008) was developed by the CRD in collaboration with representatives from the core area municipalities engineering departments. The document includes the mapping of the known sewer overflow locations in the core area (including pump stations, combined manholes and sewer relief points), rating core area shorelines based their sensitivity to sewer overflows, summarizing overflows from 2000 to 2007, and documenting prioritized overflow management plans for the CRD and each of the core area municipalities. The Core Area Inflow and Infiltration Management Plan documents an approach for addressing I&I in the core area to the year The plan was developed by the CRD in collaboration with representatives from the core area municipalities engineering departments. In the plan, the core area is divided into 108 long-term monitoring catchment areas. Each catchment area is flow monitored and the data is analyzed for I&I. Catchments that exceed the agreed upon I&I rate are investigated (i.e., camera inspections / smoke testing) and the data collected is used to determine what work needs to be completed. Finally, the rehabilitation work is prioritized and carried out based on available budget. The I&I Management Plan Page i
6 also contains a sub-plan for developing and implementing an approach to address private property I&I starting in As of 2014: I&I rates have been collected for all 108 I&I Management Plan catchments. All of the catchments in Colwood, Langford, Saanich, or View Royal have relatively low I&I. Most catchments in Esquimalt, Oak Bay, and Victoria s catchments have elevated I&I. Many of these catchments have been or will be investigated. From 2005 to 2010, Esquimalt inspected its entire sewer system and repaired all of the sewers and manholes that were in poor condition. Work is still being carried out to implement a private property I&I approach by Between 2008 and 2013, the following significant I&I related work items have taken place in the core area: Esquimalt completed a $6.75 million upgrade of the sanitary collection system which included the relining of over 30% of Esquimalt s gravity sewers and separation of combined manholes. Victoria completed the James Bay I&I Reduction Pilot Study. The Core Area Inflow and Infiltration Management Plan was completed in 2012 Methods were developed to generate sewer flow data from data already collected at municipal pump stations. This results in consistent, relatively inexpensive long-term flow monitoring data. I&I has been included at over 17 CRD outreach events per year since At these events the public was encouraged to complete a 4-question I&I related survey. I&I education material includes a brochure, two sets of videos to help explain I&I, and an I&I website. Overflows ( ) The CRD and core area municipalities have identified all of their known sewer overflow locations, which are summarized in Table ES-1 and Figure ES-1. It must be emphasized that, even though there are a large number of known overflow locations, the majority of them are never used or are infrequently used. Table ES-1: Number of Known Potential Overflow Points Jurisdiction Pump Stations 1 Relief Points 2 Combined Manholes 3 Total CRD Colwood Esquimalt 11 0 ~48 59 Langford Oak Bay 6 0 Uplands is a combined collection system Saanich Victoria View Royal Total plus Uplands 1. Sanitary pump station overflows are those that have a designed overflow point included within or just upstream of the pump station. 2. Relief point overflows include overflow pipes designed into the collection system that spill into storm drains or nearby waterways. 3. Combined manhole overflows are those where both sanitary and storm pipes are located within the same manhole but are separated by a concrete dividing wall. All of these manholes were installed as a cost-saving measure in the s, as it was cheaper to install one manhole instead of two. Most I&I related overflows take place in the regional sewer system during large storm events when operators monitoring the sewer flows selectively allow overflows to deep sea outfalls with low sensitivity receiving environments. This is done to preserve sewer capacity for areas that would otherwise overflow into high sensitivity receiving environments (creeks, basement flooding, etc.). The I&I that causes these overflows comes from the upstream municipal sewers and private property laterals. Table ES-2, summarizes the sewer overflows in the core area from 2008 to Page ii

7 Page iii
8 Table ES-2: Frequency of Overflows Classified by Cause and Receiving Environment Sensitivity Note: Low, Moderate, and High ratings of receiving environment sensitivity were determined by Seaconsult Marine Research Ltd. Page iv
9 Wet Weather Flow Management Progress Update The CRD and core area municipalities are on track with their overflow management plans with the following highlights. The CRD commissioned the Trent pump station in 2008 which eliminated overflows to Bowker Creek Prior to commissioning, there were ~10 overflows per year into Bowker Creek. Colwood programmed its Supervisory Control and Data Acquisition (SCADA) system to generate sewer flow data from its pump stations. Esquimalt separated approximately 100 combined manholes (of 148), relined all poor and poorest condition sewer mains, and smoke tested the entire municipal sewer system. Langford ensured that each of its pump station either has a backup generator or can be powered with Langford s portable standby generator. Oak Bay added 7 of its 9 pump stations to SCADA and implemented policies that require the upgrade or replacement of sewer / stormwater laterals, when homeowners apply for major building permits, etc. or when cross connections are identified by the municipality. In the LWMP, Oak Bay has a commitment to separate its combined sewers by The timeline below describes Oak Bay s status and plan going forward. o Up to 2010: Oak Bay had a plan in place that would have resulted in the Uplands combined sewers being separated by The approach was estimated to cost approximately $7.5M (excluding private property works) and Oak Bay had successfully secured a $5 million dollar grant toward this work. The work was anticipated to be complete by the end of However, many Uplands residents resisted this plan on account of each house needing to install a sewer sump pump to convey its sewage into the municipal low pressure sewer main. As a result, in 2010, Oak Bay council decided to have staff investigate other alternative approaches for sewer separation in the Uplands. o o 2010 to 2014: Oak Bay collected detailed data (municipal records, etc.) on the Uplands sewers and hired a land surveyor to collect additional information to 2016: Oak Bay plans to: 1. Retain a consultant to prepare detailed plan options. 2. Consult with the public on the options. 3. Select a preferred option. 4. Tender construction contracts to start the separation of the sewers. Saanich upgraded 5 pump stations and is in the process upgrading 5 more. Victoria completed the James Bay I&I Reduction Pilot Project, which compared the effectiveness between various types of sewer rehab for reducing I&I and is in the process of camera inspecting and smoke testing the entire municipality by the end of View Royal has been upgrading one pump station every two years including the addition of backup generators and is in the process of camera inspecting the municipalities sewers. Conclusions On July 3, 2014, the Minister of Environment approved the Capital Regional District s Amendment No. 9 to the Core Area Liquid Waste Management Plan subject to four conditions being met by December 31, Condition No. 2 to the Minister s approval requires that the CRD submit a Wet Weather Flow Management progress report that includes an update on the progress made to date in achieving the Page v
10 LWMP commitment to eliminate sanitary and combined sewer overflows. This progress report was written to satisfy that requirement. During the period from 2008 to 2013, the municipal sewer collection systems experienced a total of seven overflows. These included three overflows resulting from pump station failures and four overflows attributed to blockages in sewer pipes related to new construction. The municipal sewer systems were able to convey all peak flows, including infiltration and inflows from storm events, into the regional trunk sewer system for discharge to the marine environment via deep sea outfalls. During the same time period, CRD regional trunk sewers experienced a total of 193 sewer overflows, of which 100 were caused by I&I flows received from municipal sewers and another 70 overflows were directly attributed to combined sewer flows coming from the Oak Bay Uplands combined sewer systems during significant storm events. The remaining 23 overflows were the result of power outages, pump station failures, or pump station upgrades in the regional system. All but one of the CRD regional system overflows were discharged through deep sea outfalls to marine environments of low sensitivity. The only overflow to a medium or high sensitivity receiving environment occurred during a summer storm when the Trent pump station was shut down for maintenance. The LWMP (2010) Section 5 contains the overflow reduction plan commitments for the CRD and each of the core area municipalities. These individual plans identify specific infrastructure work items including inspections, studies and upgrades to regional and municipal pump stations and sewer systems. The CRD and the participating municipalities have completed or initiated many of the overflow reduction tasks committed to in the LWMP. I&I must be further reduced by completing all tasks to limit maximum daily wet weather flows to less than four times the average dry weather flow by Oak Bay s commitment to separate its combined sewers in the Uplands, which collect and convey both sewage and storm water to the CRD regional pump stations at Humber and Rutland, remains outstanding. The CRD will continue to monitor the status of the overflow reduction plans for CRD and the participating municipalities of Colwood, Esquimalt, Langford, Oak Bay, Saanich, Victoria, and View Royal. These plans will be evaluated and updated as required. The core area treatment plant project includes infrastructure upgrades that should further reduce the frequency I&I related overflows in the core area. Page vi
11 1.0 INTRODUCTION On July 3, 2014, the Minister of Environment approved the Capital Regional District s Amendment No. 9 to the Core Area Liquid Waste Management Plan subject to four conditions being met by December 31, Condition No. 2 to the Minister s approval requires that the CRD submit a Wet Weather Flow Management progress report that includes an update on the progress made to date in achieving the LWMP commitment to eliminate sanitary and combined sewer overflows. This progress report was written to satisfy that requirement. Section 5 of the LWMP entitled Management of Inflow and Infiltration and the Control of Wastewater Overflows includes the individual overflow reduction plans for the CRD and each of the core area municipalities. 1.1 Overview Rainwater and groundwater that mistakenly enters the sanitary sewer system is referred to as inflow and infiltration (I&I). Inflow refers to rainwater that enters the sewer system through improper plumbing connections such as cross-connected storm drains. Infiltration refers to groundwater that seeps into the sanitary sewer through cracks or joints in the sewer pipe. A certain amount of I&I is unavoidable and is accounted for in routine sewer design. However, when I&I exceeds design allowances, sewer capacity is consumed, and may result in overflows, risks to health, damage to the environment, and increased conveyance costs. Since 2001, the CRD has collected valuable sewer flow monitoring data for the core area. Initially, the monitoring was done with a small number of portable flow meters. The monitoring has since expanded to include over 90 permanent meters and 20 portable meters with the CRD analyzing the data collected. The results are documented in I&I analyses reports which are submitted to the Core Area Liquid Waste Management committee annually. In addition, the CRD has prepared a number of reports for the Province as required by the LWMP including: biennial update reports (2005, 2007, and 2009), the Overflow Management Plan (2008) and the I&I Management Plan (2012). The Core Area Sanitary Sewer Overflow Management Plan (2008) was developed by the CRD in collaboration with representatives from the core area municipalities engineering departments. The document includes the the mapping of the known sewer overflow locations in the core area (including pump stations, combined manholes and sewer relief points), rating core area shorelines based their sensitivity to sewer overflows, summarizing overflows from 2000 to 2007, and documenting prioritized overflow management plans for the CRD and each of the core area municipalities. The Core Area Inflow and Infiltration Management Plan documents an approach for addressing I&I in the core area to the year The plan was developed by the CRD and a consultant in collaboration with representatives from the core area municipalities engineering departments. In the plan, the core area is divided into 108 long-term monitoring catchment areas. Each catchment area is flow monitored and the data is analyzed for I&I. Catchments that exceed the agreed upon I&I rate are investigated (i.e., camera inspections / smoke testing) and the data collected is used to determine what work needs to be completed. Finally, the rehabilitation work is prioritized and carried out based on available budget. The I&I Management Plan also contains a sub-plan for developing and implementing an approach to address private property I&I starting in As of 2014: I&I rates have been collected for all 108 I&I Management Plan catchments. All of the catchments in Colwood, Langford, Saanich or View Royal have relatively low I&I. Most catchments in Esquimalt, Oak Bay, and Victoria s catchments have elevated I&I. Many of these catchments have been or will be investigated. From 2005 to 2010, Esquimalt Page 1
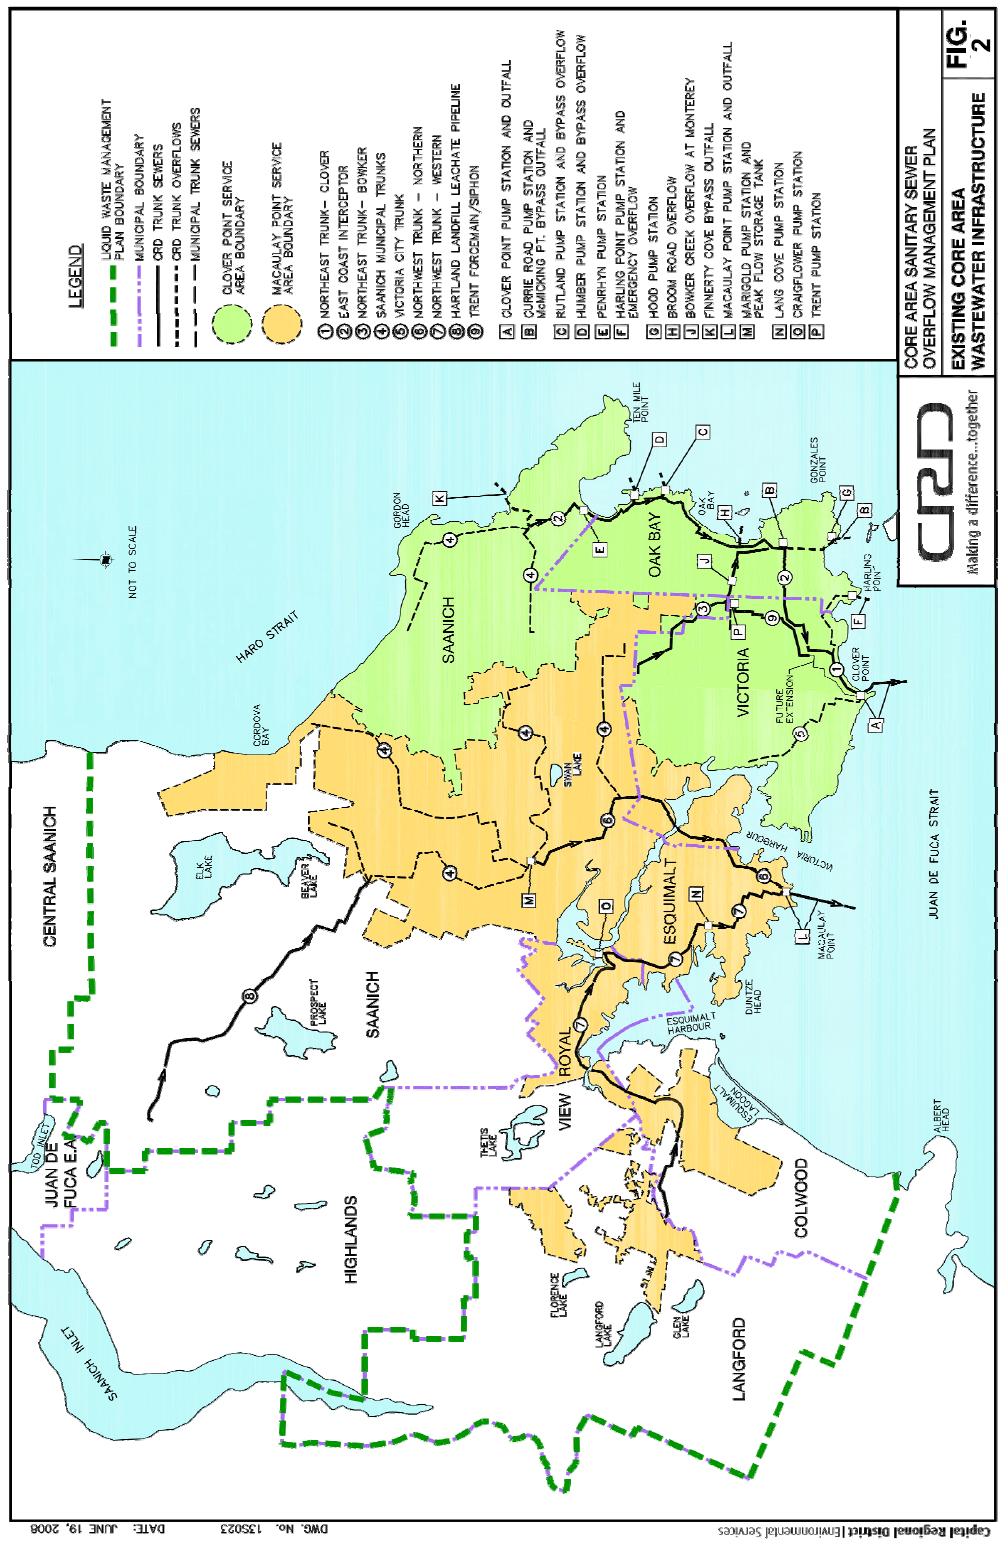
12 inspected its entire sewer system and repaired all of the sewers and manholes that were in poor condition. Work is still being carried out to implement a private property I&I approach by Since 2011, I&I has been included at over 17 CRD outreach events per year where the public was encouraged to complete a 4-question I&I related survey. I&I education material includes a brochure, two sets of videos to help explain I&I, and an I&I website. 1.2 I&I Management Area The core area of the CRD is a partnership of seven local governments and two first nation areas. These include: Colwood, Esquimalt, Langford, Oak Bay, Saanich, Victoria, View Royal, the Esquimalt Nation, and Songhees Nation. The core area has a total land area of about 215 square kilometres and a population of approximately 320,000 people. In the core area, the overall length of the sewer system can be broken down as follows: 45% municipal sewers; 40% private property laterals; 10% public property laterals; 5% regional sewers. Municipalities and regional districts tend to proactively inspect and fix their sewers. Conversely, private property owners rarely inspect or perform maintenance on their sewer laterals unless they are adversely by a problem. In the core area, municipal sewer flows are discharged into CRD trunk sewers which convey the flows to either the Clover Point or Macaulay Point pump stations, where the flows are screened and pumped out deep sea outfalls. A map of the core area sewers is located in Figure Effects of Overflows on Human Health and the Environment Sanitary sewer overflows are releases of raw sewage into storm drains, local waterways, or back-ups into buildings. "Sewage" refers to water that is contaminated with waste matter of domestic, commercial, industrial, or natural origin. The average person uses almost 225 litres of water per day performing routine activities such as bathing, recreation and body waste elimination. Sewage can also include the drainage from storm-water sewers. When all of these sources of contamination are combined, sewage can contain more than 200 chemicals, and include such debris as gravel, grit, personal care products, pharmaceuticals, hydrocarbons, rags, hair, etc. (whatever people flush/pour down their drains). The end result is that a sewer overflow could expose people, pets and the environment to harmful chemicals in addition to infectious bacteria, viruses, parasites, etc. The risks associated with sewage releases are influenced by the following characteristics of the receiving environments: public use (e.g., shoreline access, kayaking, swimming, shellfish harvesting); habitat sensitivity (e.g., productive or endangered habitats such as shellfish areas, kelp beds and herring spawning sites); and flushing characteristics (e.g., exposed coast line or in-land waters) Page 2

13 Figure 1: Map of the CRD Core Area Page 3
14 1.4 Known Potential Overflow Locations The known potential overflow locations in the core area are summarized in Table 1. The table includes pump stations, sewer relief points, and combined manholes. The table does not include random locations when overflows could occur out of manholes or basements due to a blocked pipe or excessive flow that occurs during heavy rainstorms, etc. Table 1: Number of Known Potential Overflow Points in the Core Area Jurisdiction Pump Relief Stations Points Combined Manholes Total CRD Colwood Esquimalt 11 0 ~48 59 Langford Oak Bay 6 0 Uplands is a combined collection system 6 plus Uplands Saanich Victoria View Royal Total Note that: Some of the overflow points can be categorized as planned or designed overflow locations which provide relief to the system during heavy storm events to prevent extensive flooding. A majority of the potential overflow locations do not actually overflow. They are considered emergency overflows and are designed to protect public health / private property by preventing basement flooding, etc. In general, these locations would only overflow if there was a major pump station failure or if there was excessive I&I from a massive storm event (i.e., a storm with a greater than 5-year return period). The CRD s Humber and Rutland pump stations receive sewage exclusively from Oak Bay s Uplands combined sewers. The pump stations frequently overflow during light to moderate rain events. 1.5 Reporting Requirements The Municipal Sewage Regulation (MSR) states that no person shall allow a sanitary sewer overflow to occur during storm or snowmelt events with less than a 5-year return period. The regulation requires that existing overflows be identified and addressed as part of a LWMP and that measures be taken to eliminate the overflows. The Core Area LWMP and MSR require that all unauthorized wastewater bypasses, emergency overflows and spills be reported. Those regulations detail how the reporting shall take place. Chapter 13 of the CRD s Core Area LWMP contains additional commitments regarding wastewater overflows as noted below. CRD Overflow Spill Report Form Page 4
15 The CRD uses and submits a spill report form (as shown to the right) to document any overflows from CRD facilities. 1.6 I&I Subcommittee The CRD and its core area municipalities discuss wastewater overflows, along with other issues, during I&I subcommittee meetings. This subcommittee meets multiple times per year Page 5
16 2.0 REPORTED OVERFLOWS ( ) 2.1 General Overflows may be caused by excessive inflow and infiltration, power outages, sewer blockages, and pump station failures. Most I&I related overflows take place in the regional sewer system during large storm events when operators carefully monitor sewer flows and preferentially overflow to deep sea outfalls with low sensitivity receiving environments. This is done to preserve sewer capacity for areas that would otherwise overflow into high sensitivity receiving environments (creeks, basement flooding, etc.). The I&I that causes these overflows comes from the upstream municipal sewers and private property laterals. 2.2 Summary of Overflows in the Core Area from 2008 to 2013 Table 2 summarizes the reported sewer overflows for the period of 2008 to The table includes the number of overflow events, the cause, and the sensitivity of the receiving environments. CRD The CRD had 168 overflow events from 2008 to o 57 resulted from combined sewer overflows for sub 5-year storm events. The overflows occurred at the CRD s Humber and Rutland pump stations. The flow entering these pump stations comes exclusively from Oak Bay s Uplands combined sewers. o 20 resulted from power outages or pump station failures. In general these were short duration overflows. o 8 resulted from storm events with return periods over 5-years o 83 resulted from storm events with return periods less than 5-years All but three of the overflows occurred at outfalls with Low Receiving Environment Sensitivities. The three overflows to a High Receiving Environment Sensitivity Outfall overflowed into Bowker Creek at Monterey. This location used to have frequent overflows prior to the commissioning of the Trent pump station in November Two of the overflows occurred in early 2008, prior to the commissioning of the pump station. The third overflow occurred on September 5, 2013, during an unusually large summer storm that occurred while the Trent pump station was shut down for maintenance. Table 3 summarizes the CRD s overflows from 2008 to 2013 by location and by receiving environment sensitivity. Figure 3 graphically compares rainfall vs. overflow hours for the CRD regional sewers between 2005 and Colwood No reported sewer overflows for the period of Esquimalt No reported sewer overflows for the period of Page 6
17
18 Langford September 5, 2011: PEP Blocked inverted siphon on Bear Mountain Parkway causing backup of waste water in manhole which resulted in overflow of clear waste water onto roadway, forest and rocky area. Siphon valving re-configured to by-pass mode. Blockage cleared with flush truck. Area flushed with water and treated with hydrated lime. Siphon line in operation for two years with no incidents, going forward line to be flushed annually. November 27, 2013: EMBC : Blocked inverted siphon on Bear Mountain Parkway causing backup of waste water in manhole which resulted in overflow of clear waste water onto roadway, forest and rocky area. Siphon valving re-configured to by-pass mode. Blockage cleared with flush truck. Area flushed with water and treated with hydrated lime. Bypass valve to be left open, if by-pass occurs flows to Millstream pump station will increase and the Supervisory Control and Data Acquisition (SCADA) system will alarm. December 9, 2013: EMBC : Sewer line near 2314 Millstream Road blocked by grease causing backup of waste water in manhole which resulted in spillage of clear waste water onto gravel driveway, forest and rocky area. Manhole pumped out and blockage cleared. Area flushed with water and treated with hydrated lime. April 16, 2014: EMBC : A displaced pipe test plug used by a contractor in a new subdivision blocked a sewer causing a minor overflow from a manhole. The spill was cleaned up, disinfected with hydrated lime and reported to Emergency Management BC. Oak Bay There were 57 combined sewer overflows in Oak Bay between 2008 and The overflows occurred at the CRD s Humber and Rutland pump stations, which receive their flows exclusively from the combined sewers of the Uplands. The combined sewer overflows are summarized under the CRD s overflow section of this report (page 5) because the CRD owns Humber and Rutland pump stations and reports the overflows to Emergency Management BC. July 7, 2009: Satellite Sewer Lift Station (power outage) November 18, 2009: Haro Lift Station (power outage) Saanich No reported sewer overflows for the period of Victoria In May 2013, near St. Lawrence and Niagara, there was an overflow where less than 100L of sewage passed into the stormwater system. This occurred during an excavation to install new services and occurred when a sewer main was mistakenly broken open before the upstream flows were attenuated. The event was reported to Emergency Management BC. View Royal No reported sewer overflows for the period of Esquimalt Nation One reported sewer overflows for the period of The overflow occurred downstream of the Nation s pump station when a backhoe/excavator was digging and mistakenly damaged the sewer pipe. The Nation immediately stopped using the pump station, hired a vac truck to transport the sewage from the pump station to a manhole Page 8
19 downstream of the break, and had the pipe fixed. A small amount of sewage spilt but was limited to the property located adjacent to the pipe break. Songhees First Nation No reported sewer overflows for the period of Page 9

20 Table 2: Frequency of Overflows Classified by Cause and Receiving Environment Sensitivity Note: Low, Moderate, and High ratings of receiving environment sensitivity were determined by Seaconsult Marine Research Ltd Page 10
21 Table 3: CRD Overflows Grouped by Receiving Environment Sensitivity (for all storm events less than a 5-year return period) ID No. Overflow Name Total 1 Marigold pump station High Receiving Environment Sensitivity Moderate 2 Craigflower pump station 3 Shoreline Drive 4 Gorge Harriet siphon 5 Gorge siphon 8 Head Street 15 Penrhyn lift station 18 Broom Road 18A Monterey Avenue Total number of High overflows Lang Cove pump station 9 Sea Terrace Total no. of Moderate overflows Macaulay Pt. pump station Low Receiving Environment Sensitivity 10 Clover Pt. pump stn. bypass Clover Pt. emergency outfall 0 12 Currie PS/ McMicking outfall Finnerty Cove outfall Penrhyn lift station 0 16 Humber combined outfall Rutland combined outfall Currie lift station Harling Pt. pump station Hood Street pump station Total number of Low overflows In late 2008, the Trent pump station was commissioned diverting flows away from this overflow location. This eliminated all the overflows to this location except for an overflow in early September 2013, when there was a short intense storm during a period when the Trent pump station was down for maintenance and flows weren t being diverted Page 11
22 Figure 3: Graphical Comparison of Rainfall vs. Number of Overflows Notes: The number of overflows is usually related to the quantity and intensity of precipitation for the year. The small number of overflow hours in 2008, 2010, 2011, 2012 and 2013 is attributed to some infrastructure improvements and also due to relatively small storm events or few backto-back storms when the ground is saturated As expected, most capacity-related SSOs are generally wet-weather related events and occur during the largest storm events Page 12
23 3.0 OVERFLOW MANAGEMENT PLAN UPDATES 3.1 General This section provides an update on the overflow reduction efforts by the CRD and each of the core area municipalities. Each municipal sub-section is divided into the following headings: Background Inflow and Infiltration Management Overflow Management Included under each Overflow Management heading is a table entitled: Prioritized Order of Overflow Management Plan which was taken from Section 5 of the LWMP (2010). A new column was added to each of the tables with the heading Status Update The tables were originally documented in the CRD Core Area Overflow Action Plan (2008). The CRD s table was modified prior to inclusion in the LWMP (2010) to better align with the Core Area Wastewater Treatment Plant project. The municipal sub-sections were co-written and reviewed by a representative from the municipalities engineering departments in question Page 13
24 3.2 Capital Regional District The CRD operates regional trunk sewers which receive flows from each of the core area municipal sewer systems. The system includes 49 km of gravity sewers, 10 km of forcemains, 290 manholes and 15 pump stations. Due to the critical nature of the regional sewers, they are routinely inspected and fixed as required. In 2012, the CRD finalized an Inflow and Infiltration Management Plan for the core area. In the plan, each municipality is divided into appropriately-sized sewer catchments which are flow monitored at least once every 10 years. The data is then analyzed for I&I. (Most of the catchments are permanently monitored using SCADA with the data analyzed every two years.) Catchments with I&I rates that exceed an agreed upon threshold are investigated for defects using a combination of camera inspections, smoke testing, etc. The defects are then analyzed to determine which ones should be fixed. Finally, the municipality prioritizes the repair / replacement work based on available budgets / grants. Every two years, the CRD analyzes I&I rates from approximately 85 sewer catchments. The data was analysed in 2008, 2010, 2012 and 2014 and documented in I&I Analyses Reports for the Core Area. The CRD is currently working with the core area municipalities on options for addressing private property I&I. The work will build upon existing options studies (Stantec Report, 2010) and information collected through stakeholder engagement (i.e., engagement with municipal engineers, plumbers, realtors, insurance professionals, building inspectors, home inspectors, etc.) From 2008 to 2013, the CRD camera inspected a number of its regional sewers including the Northwest Trunk Northern, the Shoreline Trunk and the North East Trunk Bowker. The videos were used to identify defects and carry out subsequent repairs. Since Trent pump station was commissioned in November 2008, there has only been one overflow into Bowker Creek, whereas in previous years there were about 10 per year. The one overflow occurred during an unusually large summer storm that occurred when the Trent pump station was down for maintenance Page 14
25 Table 4: Prioritized Order of CRD Overflow Management Plan (Update) No. Work Description Estimated Completion Estimated Cost ($2008) Status Update (2014) 1. Monterey Avenue (MH0130): Complete and commission Trent pump station 2008 (Complete) $500,000 Complete 2. Macaulay Point Pump Station: Complete installation of standby power 2008 (Complete) $800,000 Complete 3. Harling Pump Station: Install a screen on the overflow pipe 2008 (Complete) $10,000 Complete 4. Shoreline Drive (MH0340): Commence with capacity deficiency study and identify upgrade options 2010 $50,000 The pipe was camera inspected in 2012 and found to be in good operational and structural condition. In late 2014, an additional study will be carried out to determine if any hydraulic upgrades are required. 5. Penrhyn Lift Station: Investigate pump and genset capacity 2010 $600,000 Study complete. No follow-up work needed. 6. Humber Combined Sewers: Oak Bay plans to separate the sewers in the Uplands area 2015 To be determined (Oak Bay cost) See Section 3.6 City of Oak Bay: Uplands Separation 7. Rutland Combined Sewers: Oak Bay plans to separate the sewers in the Uplands area 2015 To be determined (Oak Bay cost) See Section 3.6 City of Oak Bay: Uplands Separation 8. Head Street (MH0040): Twin the NWT from Macaulay Point to MH $20,000,000 A study confirmed that this is no longer needed at this time due to increased capacity at the Macaulay pump station. 9. Sea Terrace (MH0055): Twin the NWT from Macaulay Point to MH as above A study confirmed that this is no longer needed at this time due to increased capacity at the Macaulay pump station. 10. Broom Road: Extend Trent forcemain down to Clover Point 2017 as above * The work items noted in this table are taken from the CRD Core Area LWMP (2010) table 5.1. This action item is part of the CRD s core area treatment plant project which is currently on hold. The CRD has additional prioritized work related to the Core Area Wastewater Treatment Plant Project. This includes the construction of the new Craigflower pump station, which is currently under construction with an estimated completion of early It also includes items that are on hold, along with the rest of the treatment plant project including: upgrades to the Clover pump station, an extension of the Trent forcemain to Clover Point, and the building of an attenuation tank upstream of the Finnerty Outfall Page 15
26 3.3 City of Colwood The City of Colwood is located on the West Shore of the core area with a population of just over 16,000. Colwood is approximately 2,068 hectares in size. About 17% of the properties are on the municipal sewer system. The remaining developed properties are on septic fields. Colwood s sewer system consists of approximately 33 kilometres of sewers; 7.7 kilometres of forcemains; 1200 services; 480 manholes; 70 cleanouts and eight pump stations. The gravity sewers and forcemains are constructed primarily of PVC pipe ranging from 50 mm to 750 mm in diameter. Colwood s sewers are mainly constructed of PVC sewer pipe, which is known for its leak resistant joints and overall long-term durability. As a result, Colwood focuses its I&I efforts on sewer maintenance and on inspections of both new sewers and connections to new sewers. This includes camera inspections of all new sewers, visual inspection of all manholes and flushing of sewers. Colwood collects sewer flow data from its pump stations using its SCADA system. The data is used to monitor the pump stations in real time and to calculate I&I rates. Each of Colwood s municipal pump stations has low I&I rates. If I&I rates are found to increase, Colwood will investigate and consider rehabilitation plans. In 2010, flow meters were added to private pump stations at the Juan de Fuca Recreation Centre and at Royal Roads University. In 2014 the data was analyzed for I&I. Colwood has not had any sanitary sewers overflows and, therefore, does not have an action plan for any specific overflow point. However, as part of Colwood s annual operation and maintenance routine, they have developed the following list of work items aimed at keeping their collection system running without any problems. Table 5: Prioritized Order of Colwood Overflow Management Plan (Update) No Work Description Upgrade the SCADA system to collect flow data from all pump stations CCTV inspection of all new sewers to ensure they are well constructed Continue to clean all mains and manholes, and repair as necessary Continue to maintain all lift station components to ensure that they run efficiently Estimated Completion Estimated Cost ($2008) 2008 $10,000 Status Update (2014) Complete. Data was first downloaded in 2012 and was first analyzed in the 2013 Annual I&I Report. Annually $15,000 Ongoing Annually $50,000 Ongoing Annually $72,500 Ongoing * The work items noted in this table are taken from the CRD Core Area LWMP (2010) table Page 16
27 3.4 Township of Esquimalt Esquimalt has an approximate population of 17,000 individuals. The land use is a mixture of residential, commercial and medium industrial. The main industries are the Canadian Forces base (CFB Esquimalt) and the Graving Dock. The sanitary collection system is one of the oldest within the core communities. The collection system is comprised of approximately 55 kilometres of linear sewer infrastructure, with eleven pump stations and covers an area of approximately 700 hectares. The linear sewer infrastructure is composed of vitrified clay, reinforced concrete and PVC. The majority of reinforced concrete and PVC pipe materials were constructed after The system does not have any combined sewers. In 2005, the municipality embarked on $6.75 million upgrade of the sanitary collection system. The upgrade project included the following activities: Evaluation of the entire system (flushing and camera inspections) Relining of poor or marginally good pipes (over 30% of total length Esquimalt s gravity sewers) Adding SCADA monitoring to all the sewer pump stations (monitored using the CRD SCADA system) Smoke testing for cross connections Separation of combined manholes The upgrade project also was the precursor for additional work to be carried out on the sanitary collection system. Additional projects included: In 2010, the establishment of the five year program to separate the remaining combined manholes at approximately twenty manholes per year Pump stations inspection and maintenance activities on an annual basis Follow up investigations on the information received from the smoke testing evaluation of the system. The follow up work incudes dye testing and site inspections. As a condition of getting a building permit issued for any project valued at over $150,000, a drain connection is required if the site/building is not connected to the drain system. Also, for any new building project valued at more than $150,000, the portion of the lateral connection located within the road right-of-way is replaced if found to be in poor condition. Esquimalt has significantly reduced its I&I levels through work on its public property sewers (Table 7). Future efforts will be focused on inspection and rehabilitation of the private property sanitary laterals Page 17
28 Table 6: Summary of Esquimalt s Sewer Rehabilitation Catchment Name Size (ha) Total 5-Year I&I (l/ha/day) Early Percent Change Devonshire , ,187-24% Esquimalt Panhandle 17 43,353 37,791-13% Head ,928 77,312-52% Kinver 39 70,394 75, % 1 Lang Cove PS (Dockyard) 33 73,199 42,621-42% Lang Cove PS (Esquimalt) 56 69,538 45,710-34% Dockyard 75 61,878 67, % 1 Wilson ,265 87,782-57% 1 The pre and post rehab I&I rates are very similar. The increase is likely the results of changes in the metering technology used. The following table summarizes the status of Esquimalt's overflow management plan Page 18
29 Table 7: Prioritized Order of Esquimalt Overflow Management Plan (Update) No. Work Description Estimated Completion Estimated Cost ($2008) Status Update (2014) 1. Sewer Relining Relining and repairs to sewer mains rated poor and poorest 2. Combined manhole separation Started with 148 combined manholes 29 manholes separated in 2008 Separate 5 manholes per year from 2009 to Grafton PS New electrical power supply, kiosk and controls Completed n/a Complete 2025 $950,000 Ahead of schedule As of the end of 2013, less than 50 combined manholes remain to be separated $38,000 Complete 4. Grafton PS: Pump replacement 2012 $40,000 Complete 5. Sewer Main Replacement Replacement of undersize sewer main on Craigflower Road between Tillicum Road and Lampson Street 2009 $250,000 Complete 6. Municipal Wide Smoke and Dye Testing To identify cross connections in attempts to reduce I&I in the future. The full scope of the project has not yet been determined Unknown * The work items noted in this table are taken from the CRD Core Area LWMP (2010) table 5.3. The smoke testing is complete. The dye testing component is on hold pending the implementation of a program to address private property I&I Page 19
30 3.5 City of Langford The City of Langford is one of the fastest growing municipalities in the core area with a current population of 25,000. Langford is approximately 1,400 hectares in size of which 40% are on a sewer system and the remainder is on septic fields or undeveloped. Langford plans to have all septic fields disconnected and on the collection system by The total length of Langford s sanitary sewer system is about 110 km, at an average age of 10 years, and constructed out of PVC and reinforced concrete pipe ranging from 150 mm to 750 mm diameter. West Shore Environmental Services (WSES), through a partnership agreement with the City of Langford, owns, operates and maintains the municipal sewage system within the City of Langford. Langford sewers are constructed of PVC sewer pipe, which is known for its leak resistance. The flow data from Langford s pump stations is analyzed for I&I every two years. None of the catchments have elevated I&I. Langford is vigilant in monitoring its sewer system for I&I and fixes issues as they are identified. Langford has incentive to ensure that I&I remains low to preserve sewer capacity required for future growth. West Shore Environmental Services currently operates and maintains 14 sewage pump stations in Langford. WSES is very aware of the consequences arising from sewage overflows and has certain prevention practices currently in place. WSES maintenance personnel are on call 24/7 and are fully trained in spill prevention techniques and practices. None of the 14 pump stations have direct overflows. All but the smallest station (Strandlund Avenue) are monitored 24/7 by a web based SCADA system. This station is monitored via telephone alarms. All stations report high level alarms. 7 of the 14 stations are equipped with on-site generators ready to run each station when required. Plans are in place to add standby power at the Goldie Avenue station. A portable standby generator is available to operate any station during a power failure event. WSES maintains a current and up-to-date Sewer Master Plan (SMP) which identifies potential inadequacies in the sewer system. Plans are in place for infrastructure upgrades identified in the SMP. The following table summarizes the status of Langford s overflow management plan Page 20
31 Table 8: Prioritized Order of Langford Overflow Management Plan (Update) No. Work Description Estimated Completion Estimated Cost ($2008) Status Update (2014) 1. Sewer Master Plan Upgrades Continue with infrastructure upgrades as identified in the Sewer Master Plan. Ongoing $ Million Ongoing CCTV Inspection Continue to video inspect all new sewers that are installed to ensure that they are well constructed. Manhole Inspection Continue to visually inspect manholes to ensure that they do not leak. Annually $15,000 Ongoing Annually $15,000 Ongoing 4. Pump Station Maintenance Continue to maintain all pump station components to ensure that they run efficiently. Annually $200,000 Ongoing 5. Sewer System Maintenance Continue to keep the sewers clean and free from defects. Annually $250,000 Ongoing * The work items noted in this table are taken from the CRD Core Area LWMP (2010) table Page 21
32 3.6 District of Oak Bay Oak Bay is approximately 688 hectares in size with an approximate population of about 17,000 people. The entire municipality is 100% sewered with some of the earliest sewers dating back to the 1920 s. Oak Bay has 105 kilometres of sanitary sewer mains with the majority made of vitreous clay and varying in size from 150 mm to 600 mm in diameter. Thirteen kilometres of Oak Bay s sanitary sewer mains are combined sewers, which are located in the Uplands area. Oak Bay s sewer bylaw provides it with the ability to enforce the disconnection of storm water connections from the sewer system. Once disconnected, the storm water sources must be connected to the storm sewer system. Oak Bay requires that any homes undergoing building additions or repairs to perimeter drains must separate the storm from the sanitary sewer lines if municipal dye testing crews determine a combined system exists for the house. Oak Bay requires the upgrade of old service laterals to PVC when a house is demolished and a new building is constructed. Since 2008, Oak Bay has added most of its pump stations to CRD SCADA (see Table 10). The SCADA system can be used to generate flow data for each pump station which can be analyzed for I&I. However, in general, Oak Bay s pump station sewer catchments are small and are not that useful for generating I&I data. Oak Bay s sewers are video inspected by contractors or by Oak Bay staff. The videos are used to identify deficiencies. Public Works uses the data to carry out spot repairs. Oak Bay s engineering department uses the data to set sewer replacement priorities. Oak Bay targeted the Windsor area for a multi-year pilot rehabilitation study. In 2005, weirs were installed at two small catchments within the Windsor area to produce flow data for I&I analyses. One catchment received the following rehab work: minor spot repairs (2006/2007), cross-connection removal (2007/2008), spot repair and manhole sealing (2008/2009) and sewer main lining (2010/2011). The I&I rate didn t change as a result of the work but there is evidence that the private property laterals are the main source of I&I in this catchment. The second catchment received the following rehab: minor spot repairs (2006/2007), cross-connection removal (2007/2008), and spot repair and storm main pipe bursting (2008/2009). The I&I rate decreased by over 50% as a result of this work despite less rehab work than in the first catchment. It should be noted that the second catchment started with twice the I&I rate as the first catchment and ended up with a similar I&I rate to the first catchment. The lesson learned is that all sewer catchments are unique and should be investigated prior to rehab to determine the most cost effective I&I reduction method for that catchment. Between January 1, 2008 and December 31, 2012, Oak Bay replaced or relined approximately 1,070 meters of sewer pipe. In 2011, Oak Bay purchased four sewer flow meters to monitor their I&I Management Plan catchments. The meters were left in the same location until mid-2014 to ensure that adequate storm event flow data was available for I&I analyses. In mid-2014, the meters will be moved to monitor Oak Bay s remaining unmetered I&I Management Plan catchments. Oak Bay has the following overflow management mechanisms: Backup Power Haro Road pump station facility has permanent full-time back up power 663 Radcliffe, 963 Beach, 261 King George Terrace, 1860 Bowker Place, 2268 Satellite and 2058 Cedar Hill Cross Road are capable of having back-up generators hooked up Page 22
33 Extra Storage Satellite pump station has wet well storage for 12 hours Bowker pump station has wet well storage for 12 hours Radcliff pump station has wet well storage for 12 hours King George Terrace pump station has wet well storage for 4 hours Cedar Hill Cross Road over flows into UVic s sewer system Emergency Response Pumps at 963 Beach, 2268 Satellite, 1860 Bowker, Haro and 2058 Cedar Hill Cross Road are all SCADA monitored 24/7 and alarms are sent to cell phones for staff to respond. SCADA records and trending are fully archived and accessible via CRD. Pump stations all have high level light indicators. Public Works monitors the stations every day and are able to determine if a spill has happened. Lights stay on until they are manually reset. Haro Road station also has chart recorders to indicate flow trends. The following table summarizes the status of Oak Bay s overflow management plan Page 23
34 Table 9: Prioritized Order of Oak Bay Overflow Management Plan (Update) No. Work Description Estimated Completion Estimated Cost ($2008) Status Update (2014) 1. Uplands Sewer Separation 2015 $12,000,000 (est.) Oak Bay had a plan in place that would have resulted in the Uplands combined sewers being separated by However, many Uplands residents resisted this plan because most of the houses would need to install sewer pumps. The council of the day therefore decided to have staff re-visit other approaches for sewer separation in the Uplands. See page 22 for details. As of mid-2014, Oak Bay is still working on a plan to separate the Uplands sewers. 2. South Oak Bay I&I Rehab Project (Phased I&I reduction pilot project in the Windsor catchment) 2010 $1,000,000 (est.) Complete See page 23 for a summary of the work completed and results of the study. 3. Hydraulic Model 2014 $90,000 (est.) Estimated completion is The CRD is assisting with ongoing flow monitoring to aid in eventual calibration. 4. CCTV Inspections Annually $25,000 Ongoing. Starting in 2015, the plan is to CCTV the entire system over a period of five years to collect upto-date videos and pipe codes. 5. Pump Station Maintenance 6. SCADA Upgrade Sewer System Maintenance Annually $30,000 Ongoing Annually $180,000 (est.) Sewer Mains $237,000 Since 2008, Oak Bay has been adding one pump station per year to SCADA. 7 of 9 Oak Bay pump stations have been added so far. The remaining two pump stations are expected to be added by the end of Pump station data stored in SCADA can be used to generate flow data for the pump stations. Ongoing 8. Manhole Inspection Annually $15,000 Ongoing * The work items noted in this table are taken from the CRD Core Area LWMP (2010) table Page 24
35 Uplands Separation Up to 2010: Pursuit of the Low-Pressure Sewer System Option Leading up to 2010, Oak Bay (through its consultants) developed a plan to separate the combined sewers in the Uplands. The plan was to use the existing combined sewers infrastructure for stormwater drainage and to add a new low pressure sewer system to convey sanitary flows. As part of the plan, each property would need a sewer pump to pump into this low pressure system. The approach was estimated to cost approximately $7.5M (excluding private property works) and Oak Bay had successfully secured a $5 million dollar grant toward this work. The work was anticipated to be complete by the end of The low pressure sewer system approach included the following benefits: There would be no I&I because the pipes would be pressurized and thus wouldn t allow rainwater / groundwater to enter by gravity. With no I&I, storm event related overflows from the Uplands would be eliminated. Because the sewers are pressurized, they could be installed at a shallower depth and the width of the trench would be greatly reduced. This would result in less excavation and disruption on both public and private property. The approach would be significantly less expensive than the other available options. In January 2010, Oak Bay hosted an open house to present the low pressure sewer system approach to residents of the Uplands. Residents expressed strong opposition to the approach. They did not want to install sewer pumps in their homes as they anticipated ongoing maintenance and potential basement flooding during power outages. They also noted that the installation of the new sewers would impact established landscaping, rock work and driveways. Based on the feedback received at the open house, the Oak Bay council of the day decided to shelve the low pressure sewer system approach and to re-visit other approaches for sewer separation in the Uplands Mid 2014: Data Consolidation Oak Bay has been exploring various approaches to dealing with combined sewers in the Uplands. To support the review of options, Oak Bay collected and consolidated pertinent data including: Municipal staff completing a review of property files to determine: o the main floor-to-basement distances o which properties have completed the installation of a storm lateral o which properties are currently being serviced by a pump o right of way information Hiring a legal surveyor in May of 2014 to undertake detailed field survey work in the Uplands. The work took place over a three month period and included the surveying of: o main floor elevations of each house o property elevations in relation to the existing pipe location o street topography o right of way information Page 25
36 : Path Forward Fall 2014: Oak Bay staff are integrating the survey results with the existing data collected and carrying out a preliminary evaluation with respect to existing house and sewer main elevations. The results of this investigation will be presented to Council for approval to proceed with retaining consulting services for preparing more detailed plans of the options (i.e., new sewer or storm drains) including preliminary cost estimates (Class D). 2015: Consulting services will be retained to identify viable options and prepare detailed plans and preliminary cost estimates for presentation to Council for approval to proceed with a public consultation process. The results of the public consultation process will then be presented to Council, along with all information gathered to date, for consideration and approval of a preferred option. Consulting services will be retained to prepare the final detailed design, specifications and pretender cost estimate. 2016: Once the tender documents have been prepared, the project will be tendered for construction. Note: Additional community engagement will likely be required through this development phase. The content process, costing and timing will also need to be clarified by Oak Bay staff through feedback from Oak Bay Council Page 26
37 3.7 District of Saanich The District of Saanich is the largest of the seven core area municipalities with an approximate area and population of 8,944 hectares and 110,000 people. About 90% of the properties in Saanich are sewered while the remainder are on septic fields or undeveloped. The total length of Saanich s sanitary sewer system is about 585 km, at an average age of 30 years, and constructed out of PVC, reinforced concrete, and asbestos cement pipe ranging from 150 mm to 750 mm diameter. Saanich has low I&I rates. Saanich routinely maintains, repairs and upsizes its sewers when required for structural / operation reasons. Saanich carries out the following I&I related work: Replacement of no-corrode laterals up to the property line (approximately per year). Replacing sewer infrastructure that is at or near its service life through the use of open cut and trench-less technology methods. Camera inspecting (CCTV) approximately 15 km of sanitary sewer mains per year focusing on areas identified in a past "Critical Sewer Assessment Program." In 2005, Saanich developed a program of sewage lift station upgrading to address the fact that many stations were reaching the end of their service life and needed refurbishment. As part of the program, Saanich determines if standby power should be added to the pump stations as part of the upgrades. Saanich also considers removing overflows from the wet-wells when appropriate. In determining the order for rebuilding stations, Saanich considers: the general condition of the station; the number of failures of the station; the potential impacts of station failures; including overflows and backups into private property. The pump station rebuild program, which is expected to take 15 to 20 years and should greatly reduce / eliminate the number of overflows at Saanich pump stations. No overflows have occurred in the last five years. The following table summarizes the status of Saanich s overflow management plan Page 27
38 Table 10: Prioritized Order of Saanich Overflow Management Plan (Update) No. Work Description Estimated Completion Estimated Cost ($2008) Status Update (2014) 1. Dysart Pump Station Complete construction of the new Dysart pump station 2008 $2,500,000 (est.) Complete 2. The following pump stations will be upgraded. This includes rebuilding the pump station and adding a new standby generator: $500,000 Annually n/a Vantreight Lift Station Complete Murray #1 Pump Station Complete Murray #2 Pump Station Ready for Tender Arundel Pump Station Complete Glenwood Pump Station Ready for Tender Ashley Pump Station Ready for Tender Dunkirk Pump Station Complete Colquitz Pump Station Design being Completed Gorge Pump Station Design being Completed * The work items noted in this table are taken from the CRD Core Area LWMP (2010) table Page 28
39 3.8 City of Victoria The City of Victoria is one of the oldest municipalities within the CRD s sewerage system. Built as separate systems at the turn of the century, the majority of the sanitary sewer and storm water systems were built prior to the 1920s. The sanitary sewer system has a total length of approximately 217 km, mostly vitrified clay with some reinforced concrete, brick and PVC mains. Pipe diameters range from 150 mm to 1200 mm. Two-thirds of the wastewater is conveyed to the Clover Point outfall and one-third to the Macaulay Point outfall. Victoria is in the process of collecting camera inspection data and smoke testing data for the entire municipality. The smoke testing portion will likely be complete by 2016, while the camera inspections occur continuously on a five year rotational basis (the City is divided into five areas, and each area takes one year to complete.) In 2012, Victoria purchased twelve flow meters which have been installed to monitor Victoria s I&I Management Plan catchments. The meters will remain installed until sufficient storm event data is collected for I&I analyses, at which point they ll be moved into the catchment with the highest I&I in an effort to pin point and mitigate I&I sources. The data from these meters, along with Victoria s permanent meters will provide I&I rates for all of Victoria s I&I management plan catchments. (Note: The I&I rates for some of Victoria s catchments will be calculated mathematically using data from other flow meters.) The City of Victoria has a full-time employee to address sanitary sewer issues, including I&I. The City also has a full-time employee to address storm water quality and environmental related issues. Between January 1, 2008 and December 31, 2013, Victoria installed or relined approximately 5062 meters of sewer pipe. In 2010, Victoria completed the James Bay I&I Reduction Pilot Study. The study compared the effectiveness of different I&I reduction methods. In the study, James Bay was divided into five subcatchments and had different types of rehab in each. Table 12 summarizes the work completed and includes pre and post rehab I&I rates for the Niagara and Superior pump station catchments, located in James Bay. Figure 4 shows the study area. Table 11: James Bay I&I Pilot Project Summary and Results Catchment Name Niagara Superior Excludes Niagara I&I Reduction (Based on peak 1-hour I&I) 25% Reduction Pre-Rehab: 150,224 l/ha/day Post-Rehab: 114,704 l/ha/day 30% Reduction Pre-Rehab: 282,152 l/ha/day Post-Rehab: 197,955 l/ha/day Sub- Catchment ID Work Carried Out 100% of mainlines rehabbed (pipe bursting, cured FM-10 in place pipe) Removal of abandoned laterals 100% of manholes (11 total) rehabbed (coating and FM-11 chimney seals) FM-12 Control, no rehab conducted 67% of laterals (94 total) were rehabbed using CIPP or pipe bursting FM % of abandoned laterals were removed Cross-connected storm pipes were redirected away from the sanitary sewer FM-14 FM-15 No action. (Optional work was removed due to budget constraints) Removed 2 of 5 confirmed cross connections. (There were a total of 46 suspected property x- connections.) Page 29

40 Figure 4: James Bay I&I Pilot Project Map Page 30