Ammonia as a Transportation Fuel III
|
|
|
- Albert Williams
- 5 years ago
- Views:
Transcription
1 Ammonia as a Transportation Fuel III Denver Marriott West October, 2006 Norm Olson Iowa Energy Center
2 Meeting Objectives! Discuss Pro s and Con s of Ammonia as a Transportation Fuel! Provide Facts to Help Enlighten Perspectives! Determine Next Steps
3 Energy Independence Goals! Use U.S. Resources for U.S. Energy Needs! Eliminate Petroleum Imports! Provide a Bridge to Renewable Energy! Protect the Environment! Create U.S. Jobs/Improve Economy! Eliminate Ammonia Imports
4 Background Information
5 The Fossil Fuel Era % of total 100% Traditional Fossil Fuels Renewables 75% 50% - Biomass - Wind - Water - Animals - Mechanical - Combustion - High temperature - Electric - Low temperature - Catalysts 25% 0% Source: Ewald Breunesse, Shell Netherlands, 14th IAMA Annual World Conference, Montreux, June 14th 2004
6 aljazeera.net Increasing dependence on oil imports By Ahmad al-quni Sunday 10 August 2003, 12:43 Makka Time, 9:43 GMT Per Capita Consumption (BPY): US - 28, China - 2 US imports over 60% of Petroleum (2004) Iraq oil - the target for years By Ahmad Quni
7 Really?! Saudi Oil Exec: Only 18% of World's Crude Reserves Tapped Wednesday, September 13, 2006 VIENNA, Austria The world has tapped only 18 percent of the total global supply of crude, a leading Saudi oil executive said Wednesday, challenging the notion that supplies are petering out. Abdallah S. Jum'ah, president and CEO of the state-owned Saudi Arabian Oil Co., known better as Aramco, said the world has the potential of 4.5 trillion barrels in reserves enough to power the globe at current levels of consumption for another 140 years.
8 Oil Reserves

9 5897 Quads
10 Coal Reserves
11 World Recoverable Coal Reserves - January % South Africa 2% Poland 2% Serbia 7% Other 25% United States 7% Germany 7% India 9% Australia 23% Soviet Union 12% China World Total: 1089 Billion Short Tons Quads (5897 Ouads World Crude Oil Reserves in % OPEC)
12 US Coal
13 Hydrogen Sources! Renewables! Fossil Fuels! Nuclear
14 Renewable Energy Options! Wind! Solar! Hydro! OTEC! Biomass
15 Enough Biomass? 2002 Consumption Quads Petroleum Natural Gas Coal Nuclear 8.15 Renewable 5.25 Corn potential (including stalk, 10 bil. bu.) 8.40
16 Solar, Wind, Biomass Technology Converter Capacity Maximum Land per Year for: Efficiency Factor Packing km2/gw m2/gwh Flat-Plate PV 10-20% 20% 25-75% ,000 Wind Low to 20% 20% 2-5% ,000 Biomass 0.1% total High ,000 Source:
17 Fossil Fuel Hydrogen Sources! Petroleum! Natural Gas! Coal

18 Dakota Gasification Over 20 years of producing natural gas, ammonia and other valuable chemicals from US coal. Al Lukes - $4.50 Nat. Gas from new coal gasification plants.
19 China! # new plants! Chart of chemicals produced
20 Europe The Homepage of the R&D Component of the European Commission Clean Coal Technology Programme euro-cleancoal.net
21 Chemistry From Coal C + H2O CO + H2 CO + H2O CO2 + H2 CO + 3H CH4 + H2O (Natural Gas) or N2 + 3H NH3 (Ammonia) From Natural Gas CH4 + O CO2 + 2H2
22 Performance
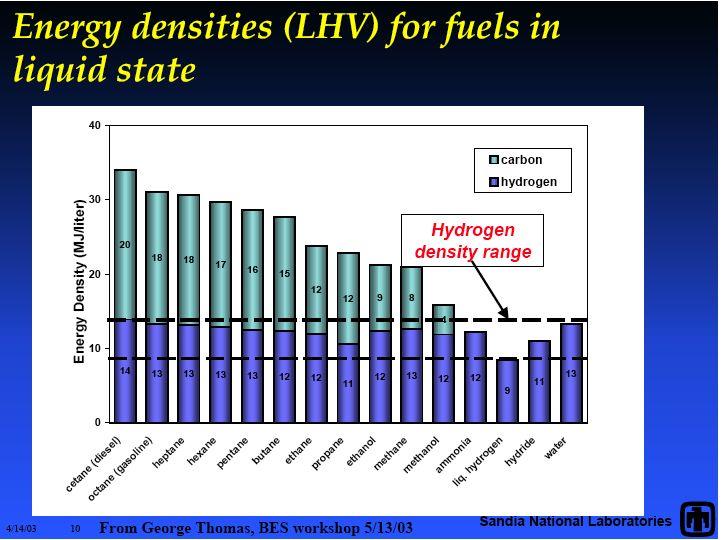
23 Hydrogen Carriers! Liquefied Hydrogen ( H 2 ) 100%! Compressed Hydrogen (H 2 ) 100%! Natural Gas (CH 4 ) 25.0%! Ammonia (NH 3 ) 17.6%! Ethanol (C 2 H 6 O) 13.0%! Methanol (CH 4 O) 12.5%
24 cng 10
25 Freedom Car Targets w/ 2005 NH3 Comparison Parameter Units NH3 (2005) Spec. Energy kwh/kg Energy Density kwh/l Storage Cost $/kwh Fuel Cost $/gal. Gas equiv * *$280/ton ammonia
26 Fuel Costs! June 2003 Chemical Market Reporter* $/MMBtu! Ammonia - $200/metric ton* $10.01! Gasoline - $1.20/gallon $10.52! Methanol - $0.79/gallon* $13.68! Ammonia - $270/short ton $14.86! Ethanol - $1.25/gallon* ($2.70, 9/05) $16.44! Gasoline - $2.00/gallon $17.54! Wind - $0.035/kwh x 2 (electrolyzer) $20.51! Gasoline - $2.50/gallon $21.92! Ethanol - $2.70/gallon (9/05) $35.51

27 Gasoline Costs March 2005


28 Future Compatibility Hydrogen + Nitrogen Ammonia Storage & Delivery Pipeline, Barge, Truck, Rail Stationary Power Fertilizer Transportation
29 Economic Impacts Current (2003) Imports: ~ 13 million bpd = $114 $24/bbl, $228 $48/bbl 2003 Gasoline Consumption 8,756,000 bbl/day 15.3 x Btu/year = 850 million ton/year ammonia 1250 new 650,000 ton/year each $562 billion million/plant 375,000 new jobs $5 billion annual new tax revenue/year (employees only)
30 Delivery Infrastructure
31 Typical New Infrastructure Filling Stations fuel tanks, Chicago Stations (20) Delivery (cold or pressurized?) Natural Gas Pipeline retrofit? One fuel (+pilot) simplifies fuel infra. Simplified refineries and formulations

32 Ammonia Pipeline


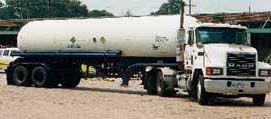

33 Ammonia Storage & Transport


34 Anhydrous Application Anhydrous ammonia expands into a gas as it is injected into the soil where it rapidly combines with soil moisture.
35 End Use Applications Spark-Ignition Internal-Combustion Engines (w/ethanol) Diesel Engines (w/biodiesel) Direct Ammonia Fuel Cells Gas Turbines Gas Burners
36 Health And Safety! Safety assessment of ammonia as a transportation fuel, Nijs Jan Duijm, Frank Markert, Jette Lundtang Paulsen, Riso National Laboratory, Denmark, February 2005
37 US DOT Statistics Chemical #Incidents Fatalities Rel. Freq. Gasoline x LPG x Anhyd. Ammonia
38 Scapegoat? Ammonia Ephedrine and Pseudoephedrine Methamphetamine NH3 C 10 H 15 NO C 10 H 15 N VOC s + NOx + O2 + Sunlight = ozone = smog+ NOx + H2O + ammonia = ammonium nitrate = smog- If the NOx doesn t form ammonium nitrate it goes to ozone (worse) Fossil fuels (the source of NOx ) are the problem, not ammonia Ammonia is actually used to clean up NOx emmissions at coal plants
39 Ammonia Toxicity Ratings Corresponding Toxicity Descriptive LD 50 (wt/kg) single LC 50 (ppm) 4 hours NFPA Index Rating Term oral dose rates inhalation rate 4 1 Extremely Toxic < 1 mg < Highly Toxic 1-50 mg Moderately Toxic mg Slightly Toxic mg , Practically non-toxic ,000 mg 10, ,000 6 Relatively Harmless > 15,000 mg > 100,000 Ammonia - NH 3 LD 50 = 350 LC 50 = 2000 The NFPA rating for ammonia is 3 taking into account the physical stress of emergency people. The actual NFPA health ratings based solely on the actual LD 50 and LC 50 numbers would be 2 and 1 respectively. Since we are most concerned with inhalation risks, the NFPA rating based on actual test data for ammonia should be 1 or slightly toxic.
40 NFPA Classifications Substance Health Flammability Reactivity Ammonia 3?! 1 0 Gasoline Benzene, Ethyl benzene MTBE 1?! 3 0 Natural gas, Methane Hydrogen LPG Methanol, Ethanol?, Toluene, Hexane NFPA ratings span from 0 to 4 (0 = no special hazards, 4 = severe hazards). Based on actual test data, the NFPA Health rating for ammonia should be 1 (as an inhalation risk). It is interesting to note that gasoline gets a Health Rating of 1, yet many of it s significant components have Health Ratings of 2 and 3.
41 Summary! Ammonia Meets Most 2015 Freedom Car Targets Today! Ammonia Has a Very Extensive, Worldwide Delivery and Storage Infrastructure Already in Place! Only H2 and NH3 Have No Tailpipe Greenhouse Gas Emissions! Only H2 and NH3 Can be Made From Electricity and Water (+air for NH3)! Ammonia From Fossil Fuels Now! Ammonia From Renewables in the Near Future! Diesel and Spark-Ignition IC Engines Now! Fuel Cells in the Future! Ammonia Looks Very Good Now and in the Future! Ammonia is Safer Than Gasoline and Hydrogen