ENVIRONMENTAL ASSESSMENT WORKSHEET
|
|
|
- Dora Stafford
- 5 years ago
- Views:
Transcription
1
2 ENVIRONMENTAL ASSESSMENT WORKSHEET Note to reviewers: The Environmental Assessment Worksheet (EAW) provides information about a project that may have the potential for significant environmental effects. This EAW was prepared by the Minnesota Pollution Control Agency (MPCA), acting as the Responsible Governmental Unit (RGU), to determine whether an Environmental Impact Statement (EIS) should be prepared. The project proposer supplied reasonably accessible data for, but did not complete the final worksheet. Comments on the EAW must be submitted to the MPCA during the 30-day comment period, which begins with notice of the availability of the EAW in the Minnesota Environmental Quality Board (EQB) Monitor. Comments on the EAW should address the accuracy and completeness of information, potential impacts that are reasonably expected to occur that warrant further investigation, and the need for an EIS. A copy of the EAW may be obtained from the MPCA by calling (651) An electronic version of the completed EAW is available at the MPCA Web site 1. Project Title: Pre-Finishing Specialists, Inc. (PSI) 2. Proposer: PSI 3. RGU: Minnesota Pollution Control Agency Contact Person Robert Heurung Contact Person William Lynott and Title Owner and Title Project Manager Address 314 Blattner Drive Address 520 Lafayette Road North Avon, Minnesota St. Paul, Minnesota Phone (320) Phone (651) Fax (320) Fax (651) bob@psi.clearwire.net william.lynott@state.mn.us 4. Reason for EAW Preparation: EIS Scoping Mandatory EAW Citizen Petition RGU Discretion Proposer Volunteered X If EAW or EIS is mandatory give EQB rule category subpart number and name: 5. Project Location: County Stearns City/Twp Avon SW 1/4 SE 1/4 Section 27, 28 Township 125 North Range 30 West p-ear1-04 TDD (for hearing and speech impaired only): (651) Printed on recycled paper containing 30% fibers from paper recycled by consumers
3 Tables, Figures, and Appendices attached to the EAW: Attachments 1 and 2 show the location of the facility on a road map and U.S. Geographical Survey (USGS) quadrangle map. Attachment 3 shows the facility location on a 2003 aerial photograph. Attachments Attachment 1 Site Location Attachment 2 USGS Map Attachment Aerial Photograph Attachment 4 Facility Layout Attachment 5 National Wetlands Inventory Attachment 6 Stearns County Soil Survey Attachment 7 Nearby Resources and Facilities Attachment 8 Emission Unit Summary Attachment 9 Total Estimated Facility Emissions Attachment 10 Emission Calculations Attachment 11 Modeled Air Concentrations at Closest Public Receptors Attachment 12 Air Emissions Risk Analysis (AERA) Summary Attachment 13 Pollution Control Options Attachment 14 Odor Analysis Report Attachment 15 Archaeological/Historical Resources Attachment 16 Minnesota Department of Natural Resources (DNR) Natural Heritage Report 6. Description: a. Provide a project summary of 50 words or less to be published in the EQB Monitor. Pre-Finishing Specialists Inc. (PSI ) of Avon, Minnesota, proposes to install new low emission millwork finishing equipment and partially replace solvent based coating materials with lower emission products in order to reduce plant emissions of volatile organic compounds (VOCs). The intent is to expand production capacity while reducing risks to human health and the environment. b. Give a complete description of the proposed project and related new construction. Attach additional sheets as necessary. Emphasize construction, operation methods and features that will cause physical manipulation of the environment or will produce wastes. Include modifications to existing equipment or industrial processes and significant demolition, removal or remodeling of existing structures. Indicate the timing and duration of construction activities. Introduction PSI of Avon, Minnesota (Attachments 1-3) is a millwork coating facility that puts finishes on various kinds of wooden doors, trim pieces, and windows. The work is done via automated equipment and spray booth workstations, depending on the type of millwork being finished and the coatings used. PSI has operated in Avon since 1989 and employs 35 workers who perform these operations. Until recently, the coating products used at the plant were exclusively organic solvent based. The operation has, therefore, been characterized by emissions of VOCs, as well as other gaseous chemical compounds that are not classified as VOCs (list, Attachment 9). PSI currently holds an Option D Permit, which is an air emission permit that limits PSI s VOC emissions to a total Pre-Finishing Specialists, Inc. (PSI) Environmental Assessment Avon, Minnesota 2 Worksheet
4 facility emission rate of 50 tons per year. Compounds other than VOCs that are emitted by the plant (acetone, for example) are not regulated or limited by this permit, nor is this required under law. The existing permit also does not regulate individual VOCs; the permit controls only mass VOC emissions. This will change with the new permit. Use of solvent based coatings holds several advantages for PSI. However, it also results in the emission of VOCs from the plant to the surrounding vicinity. These emissions are essentially uncontrolled, meaning they are vented to the atmosphere without treatment to mitigate them, and because there are no VOC emission controls on the plant, the MPCA assumes, for permitting and enforcement purposes, that all VOCs that enter the plant are subsequently emitted as air pollutants. PSI s location in Avon, near the residential district and other areas frequented by the public, has meant that local residents and area visitors can at times be exposed to these emissions, some of which may cause adverse human health effects in sufficient concentrations. Also, the emissions generally have a characteristic chemical odor that some people find objectionable and that has been reported to cause such human health effects as nausea, headaches, dizziness, and lightheadedness. This has led to a history of complaints about odors from the facility, which have been lodged with the city, the Minnesota Department of Health (MDH), and the MPCA. The most recent review of emissions from this facility was completed for the current AERA (see Item 23) in support of PSI s current permit application. Historical VOC usage (and assumed emission) rates as revealed by this review are: tons tons tons tons tons tons tons The MPCA requires that PSI report annual VOC emissions as a 12-month rolling sum, meaning that PSI must record, at the end of each month, what volume of VOCs entered the plant in the preceding 12 months. This volume of VOCs is assumed for permitting and enforcement purposes to have been released from the plant as air emissions during that same 12-month period. Note that from , the rate exceeded the permitted limit of 50 tons per year, which created the need for a new permit and changes in the operation. PSI was found in late 2003 to be in violation of its Option D Permit in that the volume of VOCs entering the plant (and assumed to be ultimately emitted) exceeded 50 tons per year. PSI was advised to submit an application for a new permit, one that would allow higher emission levels in exchange for more stringent regulatory oversight by the MPCA. The MPCA also ordered that an AERA, a screening level evaluation of the potential for chronic and acute health impacts, be included with the permit application. PSI has now submitted these documents. The new permit application triggered a petition for environmental review by local residents concerned about the potential for adverse effects of plant emissions on human health and the environment. PSI then volunteered to proceed immediately with an EAW, rendering the petition moot. Pre-Finishing Specialists, Inc. (PSI) Environmental Assessment Avon, Minnesota 3 Worksheet
5 In order to resolve the permitting issues and address the concerns of local residents, PSI now proposes efficiency and emission reduction improvements and alternative coating and cleaning materials substitution to minimize the emission of VOCs from plant operations. Environmental Analysis Environmental analysis of a project such as this one poses several challenges, and it is useful to keep a number of facts and assumptions in mind as the analysis unfolds. A key consideration is that, unlike many air emission projects that are analyzed in EAWs, PSI does not operate at a consistent level. Depending on the volume and timing of orders placed with PSI, one or more workstations may be idle for hours or days at a time. At other times, when orders are heavy, the plant may operate at full capacity for a period of time. This contrasts significantly with other air emission sources that MPCA regulates, whose operations, to a much greater degree, are characterized by full capacity operation on a more or less continuous basis. In the latter case, the facility in question typically operates at or near the permitted emission level more or less constantly. This will not always be the case with PSI once the new project is operational. PSI s operating level can in fact vary significantly, and emissions can vary significantly along with it. This emission variability will now increase because PSI will be using low- or no-voc emission materials some of the time, and solvent based materials at other times, at least initially. While PSI s goal is to eventually use water-based coatings exclusively, this will not be possible until acceptable materials are available and customer acceptance is assured. For the foreseeable future, while water based materials will be emphasized, the possibility of a particular customer insistence on solvent based finishes for a particular job cannot be ruled out. Thus, from one day to the next, or one job to the next, actual emissions can and will vary. PSI will, of course, not be allowed to exceed the permitted annual and hourly VOC emission limits, which will be regarded as maximums for enforcement purposes. The resulting health risk will, thus, not be allowed to exceed the levels posed by those limits (see Item 23 for more information on the health risk analysis). For risk assessment and environmental review purposes, the MPCA s mission to protect human health and the environment requires that it assume the worst case scenario that is, whatever emission rate is set as the permitted level (i.e., the maximum allowed by the permit) is assumed to be the routine operating level. Even if one or more workstations are actually idle for a number of hours per year (which is a practical certainty), it is assumed for review purposes to be operating (and emitting) at the full permitted level for the entire year. This is because the possibility (however remote) that the plant will, in fact, operate at full permitted capacity for an entire year cannot be ruled out, and therefore, ignored. This would, after all, be allowed by the permit, and businesses generally have every incentive to maximize production. It is the MPCA s routine practice to evaluate projects on this basis. But, this all means that this project is being evaluated at an annual emission level that most likely exceeds what will actually occur under operational conditions. How closely actual operational levels will track with those assumed in this analysis can only be conjectured. PSI recently reported that its VOC emissions for March and April of 2006 averaged 1.1 tons per month (see table, below). This monthly rate, if maintained for an entire year, would total only 13 tons per year of VOC emissions, well below the permitted maximum. However, PSI is unwilling to be limited by permit to this emission rate, because it represents a relatively low level of production, and PSI is proposing to add several new machines (therefore, more production capacity) to its current operation. PSI maintains that it needs the flexibility to respond if increased business Pre-Finishing Specialists, Inc. (PSI) Environmental Assessment Avon, Minnesota 4 Worksheet
6 becomes available. PSI has, thus, proposed an initial annual VOC emission limit of 70 tons. This provides the required flexibility, but also requires that the MPCA analyze the impact potential at that level. The following table shows the latest records of VOCs entering the plant and assumed for permitting purposes to be emitted. The Running Total VOC column shows the 12-month rolling sum that was calculated on each monthly reporting date. Note that PSI s emissions exceed a rolling sum rate of 50 tons per year until April 2006, meaning that it has been in violation of its Option D permit until just recently. Note also that the trend after that time is down, as operational changes and material substitutions have begun to have an effect on the annual emission rate. Note finally that none of the annual rolling sums exceeds 70 tons, which is the level at which the AERA calculated human health risk for this project (see Item 23). PSI intends to continue reducing the actual emission level, but wishes to retain the flexibility in permitted emission levels to be able to respond if new business becomes available. Month of Purchase Date of Entry Amount VOCs Amount PM Running Total VOCs Running Total PM Month 78 June /6/ Month 79 July /9/ Month 80 August /9/ Month 81 September /10/ Month 82 October /4/ Month 83 November /7/ Month 84 December /6/ Month 85 January /3/ Month 86 February /7/ Month 87 March /7/ Month 88 April /5/ Month 89 May /7/ Finally, in order to reduce the risk level calculated by the AERA based on the 70 ton per year emission rate (see Item 23), PSI has also proposed annual reductions of about five percent per year in the permitted maximum annual emission rate, until an annual permitted limit of 50 tons per year is reached in Staging the reductions in this manner is intended to give PSI time to transition from solvent based to water based materials, and work with its customers and suppliers to obtain acceptance of the new finishes, as well as take advantage of new developments in low emission materials and technology. As review of this EAW proceeds, it should be kept in mind that the human health risk estimates, as well as other impacts, were based on the assumption that the 70 ton per year permitted emission rate would actually be more or less constantly achieved. Since the permit would initially allow this (with phased reductions afterwards; see above and Item 31), it cannot be otherwise. However, actual emissions (and impacts) would likely be less. How much less is unknown and essentially impossible to predict. Also, it needs to be noted here that the annual emission level turned out not to be the crucial emission rate for human health risk analysis purposes. In this case, the hourly emission rates were found to be the more important factor. While, on an annualized basis, the hourly emissions may often be relatively low, as the trend in the above table indicates, it is possible that business Pre-Finishing Specialists, Inc. (PSI) Environmental Assessment Avon, Minnesota 5 Worksheet
7 needs may from time to time drive hourly production (and resulting emission) rates up to the permitted maximum level that was assessed in the AERA. For this reason, it was deemed essential to evaluate potential risk on an hourly basis as well, and impose hourly emission rate permit conditions to limit this risk to the level evaluated in the AERA. Specific hourly limits for each workstation will also be required by the permit for the same reason. Current Facility Configuration PSI s internal configuration has changed over the years as business has grown and new processes and materials have become available. The current equipment configuration (Attachment 4) and materials used are summarized in this section. In this description, the term EU means emission unit, and refers to specific workstations. In most cases (noted), an EU (a specific workstation) will have one unique stack vent, but in a few cases (noted), one stack vent may serve more than one workstation. It is a unique feature of this facility that, rather than one stack vent emission source, there are stacks by which emissions pass from the plant to the environment. All workstations except the UV workstations (EU 009, EU 021, and EU 022) have the flexibility to use any available coatings. Materials used include, but are not limited to, stains, lacquers, sealers, cleaners, topcoats, urethanes, etc. These materials can be solvent based or water based. Until recently, PSI exclusively used organic solvent-based coatings as its finishing material. These coatings have the following advantages: Low cost Consistent product quality and customer acceptance Minimize cleanup Equipment designed for solvent based use In 2005, materials containing approximately 61 tons of VOCs were purchased and reported to the MPCA (see table, previous page). To date, PSI has not been required to track actual VOC use by individual emission units and, therefore, there is no effective means of estimating individual historical emissions by unit. The following list, therefore, does not contain individual emission rates by unit. [It should be noted that, in preparing the AERA (see Item 23), PSI used a slightly different numbering system than the one used in this EAW and in the permit. The reason for the difference is that PSI reserved some unused numbers for future use, and these numbers were scattered throughout the list. However, the MPCA s computerized permitting database requires all active emission sources to be listed sequentially, and cannot account for gaps in an enumerated list of active emission sources. This is a trivial issue for review purposes, but should be kept in mind if the AERA calculations are reviewed in detail. EU numbers in this EAW and permit are identical.] EU 001. This workstation is the Clean Room Spray Booth. It has a specific stack vent (SV 001) that is unique to this workstation. The Clean Room Spray Booth uses manual spraying to complete custom finishing operations. This workstation will be decommissioned as part of the project. Pre-Finishing Specialists, Inc. (PSI) Environmental Assessment Avon, Minnesota 6 Worksheet
8 EU 002. This workstation is the Door Line Finish Machine. It has a specific stack vent (SV 002) that is unique to this workstation. The Door Line Finish Machine is an automated machine that sprays coatings on wooden doors. This machine is a new replacement for a machine that was destroyed by fire in PSI was allowed to start up this new machine in February of this year under the terms of a Compliance Agreement with the MPCA. EU 003. This workstation is the Door Line Stain Machine. It has a specific stack vent (SV 003) that is unique to this workstation. The Door Line Stain Machine is an automated machine that sprays coatings on wooden doors. EU 004. This workstation is the Job Shop Spray Booth. It has a specific stack vent (SV 004) that is unique to this workstation. The Job Shop Spray Booth uses manual spraying to complete custom finishing operations. EU 005. This workstation is the Paint Room Spray Booth. It has a specific stack vent (SV 005) that is unique to this workstation. The Paint Room Spray Booth uses manual spraying to complete custom finishing operations. EU 006. This workstation is Stain Line Machine #1. It has a specific stack vent (SV 006) that is unique to this workstation. The Door Line Stain Machine #1 is an automated machine that sprays coatings on miscellaneous wooden parts. EU 007. This workstation is Stain Line Machine #2. It has a specific stack vent (SV 007) that is unique to this workstation. The Door Line Stain Machine #2 is an automated machine that sprays coatings on miscellaneous wooden parts. EU 008. This workstation is Stain Line Machine #3. It has a specific stack vent (SV 008) that is unique to this workstation. The Door Line Stain Machine #3 is an automated machine that sprays coatings on miscellaneous wooden parts. EU 009. This workstation is the ultraviolet (UV) Vacuum Coater/Sealer. It is actually two workstations (EU 009a and EU 009b) that exhaust to one common stack vent (SV 009). The UV Vacuum Coater is an automated machine that sprays 100 percent solids coatings (non VOC) on miscellaneous wooden parts. The Sealer is an automated machine that sprays coatings on miscellaneous wooden parts. EU 010. This workstation is the Stain Operation. It does not have a specific stack vent because operations are conducted at a manual workstation rather than by a vented machine. It is closest to the Job Shop Spray Booth and, therefore, it is assumed to share that workstation s stack vent (SV 004). The Stain Operation uses manual hand spreading to complete custom finishing operations. EU 011. This is Air Makeup Unit #1. Natural gas is burned to heat outside air in the winter. The makeup air units replenish air that is lost at the individual workstation stack vents. The air makeup units maintain building pressure at or below a pressure of inches of water. Pressures less than inches of water help to ensure that all building emissions occur at the stack vents. The air makeup units exhaust internally and are assumed for review purposes to vent through the Job Shop Spray Booth stack vent (SV 004). EU 012. This is Air Makeup Unit #2. Natural gas is burned to heat outside air in the winter. The makeup air units replenish air that is lost at the individual workstation stack vents. The air Pre-Finishing Specialists, Inc. (PSI) Environmental Assessment Avon, Minnesota 7 Worksheet
9 makeup units maintain building pressure at or below inches of water. Pressures less than inches of water help to ensure that all building emissions occur at the stack vents. The air makeup units exhaust internally and are assumed for review purposes to vent through the Job Shop Spray Booth stack vent (SV 004). EU 013. This is the Small Boiler. Natural gas is burned to heat water. The Small Boiler has a specific stack vent (SV 012). EU 014. This is the Large Boiler. Natural gas is burned to heat water. The Large Boiler has a specific stack vent (S V013). EU 015. This is a large baghouse that collects particulate emissions from various operations and is vented inside the building. EU 016. This workstation is the Stain Spray Booth. It has a specific stack vent (SV014) that is unique to this workstation. The Paint Room Spray Booth uses manual spraying to complete custom finishing operations. EU 017. This is a proposed workstation that replaces the existing EU 001. See following section for description. EU 018. This is Air Makeup Unit #3. Natural gas is burned to heat outside air in the winter. The makeup air units replenish air that is lost at the individual workstation stack vents. The air makeup units maintain building pressure at or below inches of water. Pressures less than inches of water help to ensure that all building emissions occur at the stack vents. The air makeup units exhaust internally and are assumed for review purposes to vent through the Job Shop Spray Booth stack vent (SV 004). EU 019. This is the Warehouse Heater #1. Natural gas is burned to heat room air. The Warehouse Heater #1 has a specific stack vent (SV 018). EU 020. This is the Warehouse Heater #2. Natural gas is burned to heat room air. The Warehouse Heater #1 has a specific stack vent (SV023). EU021. This is a proposed workstation. See following section for description. EU022. This is a proposed workstation. See following section for description. EU023. This is a proposed workstation. See following section for description. EU 024. This is a small baghouse that collects particulate emissions from various operations and is vented inside the building. Proposed Project PSI has already begun use of two new coatings and one new cleaner. These changes have been in place since the beginning of March The new coatings and cleaner replaced the majority (up to 70 percent) of higher VOC content-based materials. With the startup of EU 002 and the use of these lower VOC materials, facility VOC tracking in March and April of 2006 shows a facility monthly average VOC use of 1.1 tons VOC per month. This monthly rate extrapolates to a yearly rate of approximately 13 tons VOC per year. At 2005 production rates this would amount to a net VOC reduction of greater than 70 percent (the 2005 VOC use rate was 60.7 tons Pre-Finishing Specialists, Inc. (PSI) Environmental Assessment Avon, Minnesota 8 Worksheet
10 VOC per year). Attachment 8 summarizes the estimated facility and non-combustion emission unit emissions for the proposed changes at both proposed permitted rates and 2005 production rates. Following is a description of the configuration of the facility with all the new project features in place and operational. EU 002. This new workstation will be approximately 30 percent more efficient in material consumption than the replaced workstations. This workstation will mainly use low VOC coatings. Attachment 8 summarizes proposed permitted and 2005 production rate VOC actual emission estimates. EU 003. This workstation will mainly use low VOC coatings. Attachment 8 summarizes proposed permitted and 2005 production rate VOC actual emission estimates. Water based stains will replace approximately 70 percent of VOC based stains. EU 004. This workstation will mainly use low VOC coatings. Attachment 8 summarizes proposed permitted and 2005 production rate VOC actual emission estimates. EU 005. This workstation will mainly use low VOC coatings. Attachment 8 summarizes proposed permitted and 2005 production rate VOC actual emission estimates. EU 006. This workstation will mainly use low VOC coatings. Attachment 8 summarizes proposed permitted and 2005 production rate VOC actual emission estimates. Water based stains will replace approximately 70 percent of VOC based stains. EU 007. This workstation will mainly use low VOC coatings. Attachment 8 summarizes proposed permitted and 2005 production rate VOC actual emission estimates. EU 008. This workstation will mainly use low VOC coatings. Attachment 8 summarizes proposed permitted and 2005 production rate VOC actual emission estimates. Water based stains will replace approximately 70 percent of VOC based stains. EU 009. This workstation will mainly use low VOC coatings. Attachment 8 summarizes proposed permitted and 2005 production rate VOC actual emission estimates. EU 010. This workstation will mainly use low VOC coatings. Attachment 8 summarizes proposed permitted and 2005 production rate VOC actual emission estimates. EU 011. This is Air Makeup Unit #1. Natural gas is burned to heat outside air in the winter. The makeup air units replenish air that is lost at the individual workstation stack vents. The air makeup units maintain building pressure at or below inches of water. Pressures less than inches of water help to ensure that all building emissions occur at the stack vents. The air makeup units exhaust internally and are assumed to vent through the Job Shop Spray Booth stack vent (SV 004). Pre-Finishing Specialists, Inc. (PSI) Environmental Assessment Avon, Minnesota 9 Worksheet
11 EU 012. This is Air Makeup Unit #2. Natural gas is burned to heat outside air in the winter. The makeup air units replenish air that is lost at the individual workstation stack vents. The air makeup units maintain building pressure at or below inches of water. Pressures less than inches of water help to ensure that all building emissions occur at the stack vents. The air makeup units exhaust internally and are assumed to vent through the Job Shop Spray Booth stack vent (SV 004).. EU 013. This is the Small Boiler. Natural gas is burned to heat water. The Small Boiler has a specific stack vent (S 012). EU 014. This is the Large Boiler. Natural gas is burned to heat water. The Large Boiler has a specific stack vent (SV 013). EU 015. This is a large baghouse that collects particulate emissions from various operations and is vented inside the building. EU 016. This workstation will mainly use low VOC coatings. Attachment 8 summarizes proposed permitted and 2005 production rate VOC actual emission estimates. EU 017. This is a proposed workstation. Known as a Door Line Sealer Machine, it will have a specific stack vent (SV015) that will be unique to this workstation. The Door Line Sealer Machine will be an automated machine that sprays coatings on miscellaneous wooden parts (usually doors). This workstation will mainly use low VOC coatings. Attachment 8 summarizes proposed permitted and 2005 production rate VOC actual emission estimates. EU 018. This is Air Makeup Unit #3. Natural gas is burned to heat outside air in the winter. The makeup air units replenish air that is lost at the individual workstation stack vents. The air makeup units maintain building pressure at or below inches of water. Pressures less than inches of water help to ensure that all building emissions occur at the stack vents. The air makeup units exhaust internally and are assumed to vent through the Job Shop Spray Booth stack vent (SV 004). EU 019. This is the Warehouse Heater #1. Natural gas is burned to heat room air. The Warehouse Heater #1 has a specific stack vent (SV 018). EU 020. This is the Warehouse Heater #2. Natural gas is burned to heat room air. The Warehouse Heater #1 has a specific stack vent (SV 019). EU 021. This is a proposed workstation. Known as UV Spray Coater #1, it will exhaust to a specific stack vent (SV 020). The UV Spray Coater #1 will be an automated machine that sprays 100 percent solids coatings (non VOC) on miscellaneous wooden parts. EU 022. This is a proposed workstation. Known as UV Spray Coater #2, it will exhaust to a specific stack vent (SV 021). The UV Spray Coater #2 will be an automated machine that sprays 100 percent solid coatings (non VOC) on miscellaneous wooden parts. Pre-Finishing Specialists, Inc. (PSI) Environmental Assessment Avon, Minnesota 10 Worksheet
12 EU 023. This is a proposed workstation. Known as Stain Line Machine #4, it will have a specific stack vent (SV 022) that will be unique to this workstation. The Stain Line Machine #4 will be an automated machine that sprays coatings on miscellaneous wooden parts. This workstation will mainly use low VOC coatings. EU 024. This is a small baghouse that collects particulate emissions from various operations and is vented through a filter into the building. Even though new equipment is being added to the facility that will allow increased production, the improved efficiency of the new and replacement equipment, together with use of low emission coatings, will result in a 70 percent reduction in VOC emissions compared to 2005 emission rates, assuming a constant level of plant activity. This is expected to have an immediate effect on actual hourly and annual VOC emission rates, as the table above indicates. Had these improvements all been available and in operation during the 2005 production year, the result would have been a 2005 annual VOC emission rate of about 20 tons, rather than the 60 tons that actually were emitted in that year. However, PSI is not willing to accept a low emission rate such as this as its permitted maximum, since this would curtail its ability to respond to additional production and growth opportunities that may occur in the future. PSI states that it continues to experiment with more environmentally friendly coatings and will continue to employ these and other low impact coatings as long as they meet reasonable business needs and customer expectations. PSI s goal is to reduce total VOC emissions initially and over time. Accordingly, PSI has proposed to reduce its permitted VOC emission limit from the initial 70 tons per year to 50 tons per year by This will have the effect of reducing the potential health risk as calculated in the AERA analysis. PSI believes that this would give a reasonable amount of time to test and take advantage of new coating materials and operational methods, and seek customer acceptance of the new finishes. c. Explain the project purpose; if the project will be carried out by a governmental unit, explain the need for the project and identify its beneficiaries. The project s purpose is to install new, more efficient equipment and reduce emissions of regulated air pollutants. d. Are future stages of this development including development on any outlots planned or likely to happen? Yes No If yes, briefly describe future stages, relationship to present project, timeline and plans for environmental review. There no current plans for future site development. Pre-Finishing Specialists, Inc. (PSI) Environmental Assessment Avon, Minnesota 11 Worksheet
13 e. Is this project a subsequent stage of an earlier project? Yes No If yes, briefly describe the past development, timeline and any past environmental review. PSI was first constructed on the present site in It occupies a 1.2-acre lot. The site had been used for agriculture prior to that time and has been zoned light industrial. The initial facility comprised 10,800 square feet. Additions to the facility were completed in 1996 and In 2005, the facility again expanded to reach its present size of nearly 50,000 square feet. 7. Project Magnitude Data Total Project Area (acres) 1.2 or Length (miles) Number of Residential Units: Unattached 0 Attached 0 maximum units per building 0 Commercial/Industrial/Institutional Building Area (gross floor space): total square feet 50,000 Indicate area of specific uses (in square feet): Commercial, industrial or institutional building area (gross floor space) - approximately 50,000 Office 1,800 Manufacturing 0 Retail 0 Other Industrial 0 Warehouse 12,000 Institutional 0 Light Industrial 36,137 Agricultural 0 Other Commercial (specify) 0 Building height 18 feet If over 2 stories, compare to heights of nearby buildings Emission units (stacks): 30 feet (above ground level; 12 feet higher than the building height). The height of the building and stacks is comparable to surrounding buildings. 8. Permits and approvals required. List all known local, state and federal permits, approvals and financial assistance for the project. Include modifications of any existing permits, governmental review of plans, and all direct and indirect forms of public financial assistance including bond guarantees, Tax Increment Financing and infrastructure. Unit of Government Type of Application Status MPCA Air Emissions Risk Analysis Completed MPCA State Operating Permit Pending 9. Land use. Describe current and recent past land use and development on the site and on adjacent lands. Discuss project compatibility with adjacent and nearby land uses. Indicate whether any potential conflicts involve environmental matters. Identify any potential environmental hazards due to past site uses, such as soil contamination or abandoned storage tanks, or proximity to nearby hazardous liquid or gas pipelines. Prior to construction of PSI, the land was used for agricultural production. The land and surrounding properties are zoned as commercial light industrial property. Immediately east of PSI, a parcel is still agricultural (see Attachment 3). Tischler Wood Products, another light industrial facility, is located across the street from PSI. Surrounding properties include a post office, restaurants, a hotel, gas stations, convenience stores, residences, and Interstate 94. On the opposite side of I-94, numerous commercial and light industrial businesses are found. The elementary school is located approximately 3/5 of a mile north of the PSI site. Area residents have petitioned the MPCA based on concerns about chemical odors and possible human health risks from PSI emissions. These issues are addressed below in Items 23 and 24. Aside from the concerns about emissions, the facility is compatible with surrounding properties, which include Pre-Finishing Specialists, Inc. (PSI) Environmental Assessment Avon, Minnesota 12 Worksheet
14 similar light industrial facilities, and is consistent with the commercial zoning of the area as set forth in the City of Avon Comprehensive Plan. There are no known environmental hazards from past land use. 10. Cover Types. Estimate the acreage of the site with each of the following cover types before and after development: Before After Before After Types 1-8 wetlands Lawn/landscaping Wooded/forest Impervious Surfaces Brush/grassland Other (describe) Cropland TOTAL Fish, Wildlife, and Ecologically Sensitive Resources. a. Identify fish and wildlife resources and habitats on or near the site and describe how they would be affected by the project. Describe any measures to be taken to minimize or avoid impacts. There is essentially no habitat for fish or wildlife on the project site (See Attachments 2 and 3). The site is light industrial, and most of the property is comprised of the buildings, lawn or impervious driveways and parking lots. A portion of the property is unpaved but is used for equipment storage and movement of machinery. These land uses, and the fact that the site was previously used for crop production, result in the property having little or no value as habitat. The National Wetland Inventory (NWI) indicates that there is one wetland on the project site (Attachment 5). This wetland is identified as palustrine with emergent vegetation that is temporarily flooded and partially ditched or drained (Cowardin Type PEMAd; Circular 39 Type 1). However, this wetland no longer exists. A stormwater retention pond is located between the PSI property and I-94. This pond is considered to be of minimal value as habitat. Several wetlands within 0.5 miles of the project site are identified by the NWI (Attachment 5). Some of these wetlands may no longer exist due to development. The wetland types in this area are as follows: Pre-Finishing Specialists, Inc. (PSI) Environmental Assessment Avon, Minnesota 13 Worksheet
15 Wetland Type Circular Cowardin 39 PEMAd Type 1 Description of Wetland Type Palustrine, emergent vegetation, temporarily flooded, partially ditched or drained PEMC Type 3 Palustrine, emergent vegetation, seasonally flooded PEMCd Type 3 Palustrine, emergent vegetation, seasonally flooded, partially ditched or drained PEMF Type 4 Palustrine, emergent vegetation, semi-permanently flooded PEMFx Type 4 Palustrine, emergent vegetation, semi-permanently flooded, excavated PSS1Cd Type 6 Palustrine, deciduous shrub-scrub vegetation, seasonally flooded, partially ditched or drained L1UBH N/A Lacustrine with limnetic area, unconsolidated bottom, permanently flooded The closest habitat for fish and wildlife is provided by area lakes and associated wetlands and shoreline vegetation (Attachments 2 and 3). The project site is approximately 900 feet from Linneman Lake, 1,230 feet from Minnie Lake, 2,000 feet from Lake Anna, 2,200 feet from Lower Spunk Lake, and 4,400 feet from Middle Spunk Lake. b. Are any state (endangered or threatened) species, rare plant communities or other sensitive ecological resources such as native prairie habitat, colonial waterbird nesting colonies or regionally rare plant communities on or near the site? Yes No If yes, describe the resource and how it would be affected by the project. Indicate if a site survey of the resources has been conducted and describe the results. If the DNR Natural Heritage and Nongame Research program has been contacted give the correspondence reference number. ERDB Describe measures to minimize or avoid adverse impacts. Correspondence from the DNR Natural Heritage and Nongame Research Program (see Attachment 16) indicates that there are no known occurrences of rare natural features or protected species in the immediate vicinity of the PSI property. The DNR database reported known occurrences of natural communities and protected species within approximately one mile of the facility and all in Township 125 North, Range 30 West. Three oak forests are noted in Sections 20, 26, and 32, and an alder swamp is located in Section 26. None of these native plant communities occur on or in close proximity to the PSI property. Five occurrences of protected species are known from the general area, none of which occur on or in close proximity to the facility. Blanding s turtle (Emydoidea blandingii; state threatened) was observed in 1986 near a marsh on the northwest side of Lake Anna in the northwest quarter of Section 27. Two special concern fish species have been reported from the northwest portion of Upper Spunk Lake in Section 32 in 1997: the least darter (Etheostoma microperca) and the pugnose shiner (Notropis anogenus). Finally, two nesting locations of the special concern species, red-shouldered hawk (Buteo lineatus) have been reported from forests in Sections 33 and 35. Site visits by Barr Engineering scientists and engineers confirm that the PSI property supports none of the noted natural communities or appropriate habitat for protected species. Consequently, this project is not anticipated to have any detrimental effects on rare natural features or protected species. Pre-Finishing Specialists, Inc. (PSI) Environmental Assessment Avon, Minnesota 14 Worksheet
16 12. Physical Impacts on Water Resources. Will the project involve the physical or hydrologic alteration (dredging, filling, stream diversion, outfall structure, diking, and impoundment) of any surface waters such as a lake, pond, wetland, stream or drainage ditch? Yes No If yes, identify water resource affected. Describe alternatives considered and proposed mitigation measures to minimize impacts. Give the DNR Protected Waters Inventory (PWI) number(s) if the water resources affected are on the PWI. All project activities will take place within existing buildings. Therefore, there will be no alteration of water resources. 13. Water Use. Will the project involve installation or abandonment of any water wells, connection to or changes in any public water supply or appropriation of any ground or surface water (including dewatering)? Yes No If yes, as applicable, give location and purpose of any new wells; public supply affected, changes to be made, and water quantities to be used; the source, duration, quantity and purpose of any appropriations; and unique well numbers and DNR appropriation permit numbers, if known. Identify any existing and new wells on the site map. If there are no wells known on site, explain methodology used to determine. The facility receives water from the city of Avon municipal water supply. No changes in water use are anticipated as a result of this project. 14. Water-related land use management districts. Does any part of the project involve a shoreland zoning district, a delineated 100-year flood plain, or a state or federally designated wild or scenic river land use district? Yes No If yes, identify the district and discuss project compatibility with district land use restrictions. The facility is approximately 900 feet north of Linneman Lake and, therefore, is within a shoreland zoning district. Applicable land use restrictions pertain to stormwater management. Stormwater from the PSI facility flows into the retention pond south of the property or into the city of Avon municipal storm sewer system. 15. Water Surface Use. Will the project change the number or type of watercraft on any water body? Yes No If yes, indicate the current and projected watercraft usage and discuss any potential overcrowding or conflicts with other uses. The project does not involve watercraft. 16. Erosion and Sedimentation. Give the acreage to be graded or excavated and the cubic yards of soil to be moved: 0 acres; 0 cubic yards. Describe any steep slopes or highly erodible soils and identify them on the site map. Describe any erosion and sedimentation control measures to be used during and after project construction. Because all aspects of this project occur within existing structures, no grading or excavation will be conducted, and erosion and sedimentation controls will not be necessary. Pre-Finishing Specialists, Inc. (PSI) Environmental Assessment Avon, Minnesota 15 Worksheet
17 17. Water Quality Surface-water Runoff. a. Compare the quantity and quality of site runoff before and after the project. Describe permanent controls to manage or treat runoff. Describe any storm-water pollution prevention plans. There will be no changes to site runoff as a result of this project. b. Identify routes and receiving water bodies for runoff from the site; include major downstream water bodies as well as the immediate receiving waters. Estimate impact runoff on the quality of receiving waters. Runoff from the site goes to two locations: the stormwater pond south of the property, or the municipal storm sewer system via Blaetner Street. 18. Water Quality Wastewater. a. Describe sources, composition and quantities of all sanitary, municipal and industrial wastewater produced or treated at the site. All wastewater from PSI goes to the city of Avon municipal wastewater treatment facility. b. Describe waste treatment methods or pollution prevention efforts and give estimates of composition after treatment. Identify receiving waters, including major downstream water bodies, and estimate the discharge impact on the quality of receiving waters. If the project involves on-site sewage systems, discuss the suitability of site conditions for such systems. PSI does not have on-site wastewater treatment facilities. c. If wastes will be discharged into a publicly owned treatment facility, identify the facility, describe any pretreatment provisions and discuss the facility s ability to handle the volume and composition of wastes, identifying any improvements necessary. All wastewater goes to the city of Avon municipal wastewater treatment facility. The facility is a Class A wastewater treatment facility employing oxidation ditches. The facility is designed to handle any general municipal wastes. d. If the project requires disposal of liquid animal manure, describe disposal technique and location and discuss capacity to handle the volume and composition of manure. Identify any improvements necessary. Describe any required setbacks for land disposal systems. The project does not involve animal manure. 19. Geologic hazards and soil conditions. a. Approximate depth (in feet) to Ground water: 40+ minimum; average. Bedrock: 50+ minimum; 100+ average. Describe any of the following geologic site hazards to ground water and also identify them on the site map: sinkholes, shallow limestone formations or karst conditions. Describe measures to avoid or minimize environmental problems due to any of these hazards. Pre-Finishing Specialists, Inc. (PSI) Environmental Assessment Avon, Minnesota 16 Worksheet
18 The project area is located within outwash deposits associated with the Des Moines Lobe map unit. The city of Avon and the project area are found within a melt water area that is associated with coarse textured gravels and sands. There are no sinkholes, shallow limestone formations or karst conditions within the project area (Geologic Atlas of Stearns County, Minnesota, 1995). b. Describe the soils on the site, giving SCS classifications, if known. Discuss soil granularity and potential for ground-water contamination from wastes or chemicals spread or spilled onto the soils. Discuss any mitigation measures to prevent such contamination. The following soil series are mapped by the Stearns County Soil Survey within 0.5 miles of the facility (Figure 6): Map Unit Map Unit Name Hydric or Non-hydric 41A Estherville sandy loam, 0-2% slopes Non-hydric 155B Chetek sandy loam, 1-6% slopes Non-hydric 454C Mahtomedi loamy coarse sand, 8-15% slopes Non-hydric 543 Markey muck Hydric 566 Regal loam Hydric 1015 Psamments, sloping Non-hydric 1055 Histosols and Haplaquolls, ponded Hydric Map units 543, 566 and 1055 are listed as hydric soils and occur in or on the edge of depressional or swale areas. These soil units are high in organic matter and are either poorly or very poorly drained. The seasonal high water table is generally within one to two feet from the soil surface. Units 41A, 155B, 454C and 1015 are somewhat excessively to excessively drained soils that are coarse textured with low to moderate organic matter. They have moderately rapid to rapid permeability, with a seasonal water table generally greater than six feet below the soil surface. Water easily infiltrates through these soils; however, the filtering ability is low. The soil at the PSI property, 155B - Chetek sandy loam, is included in this group of rapidly permeable soils. There are no soils identified as prime farmland in the project area. Map units 41A and 155B are listed as farmland of statewide importance. The potential for ground-water contamination from the facility is low. All chemicals are kept within the building. The floors and walls provide a means of containing any spills. Stored chemicals that are not actively in use in the facility are stored in a recently constructed chemical storage room. Any barrels outside of the facility have been emptied and sealed and will be returned to the supplier for reuse. Because these barrels have been emptied, only small amount of residual chemical is present within them. Therefore, the potential for ground-water contamination is considered minimal. Mitigation measures to prevent contamination include the above-mentioned practices of indoor storage within a chemical storage room and restricting outdoor storage to empty containers. 20. Solid Wastes, Hazardous Wastes, Storage Tanks. Pre-Finishing Specialists, Inc. (PSI) Environmental Assessment Avon, Minnesota 17 Worksheet
19 a. Describe types, amounts and compositions of solid or hazardous wastes, including solid animal manure, sludge and ash, produced during construction and operation. Identify method and location of disposal. For projects generating municipal solid waste, indicate if there is a source separation plan; describe how the project will be modified for recycling. If hazardous waste is generated, indicate if there is a hazardous waste minimization plan and routine hazardous waste reduction assessments. Non-hazardous solid wastes are placed in dumpsters and disposed of in a sanitary landfill. Separate dumpsters are maintained for discarded filters and material captured in particle collectors, which are incinerated off site. Approximately two 55-gallon barrels of liquid hazardous waste are generated per month. This liquid hazardous waste is the by-product of staining and finishing operations. The composition includes chemicals discussed in Item 23, Stationary Source Air Emissions (see Attachment 9). PSI contracts with Safety Clean, a licensed hazardous waste handler, for proper removal and disposal of all hazardous wastes. b. Identify any toxic or hazardous materials to be used or present at the site and identify measures to be used to prevent them from contaminating ground water. If the use of toxic or hazardous materials will lead to a regulated waste, discharge or emission, discuss any alternatives considered to minimize or eliminate the waste, discharge or emission. The chemicals used by PSI are listed in Attachment 9. All chemicals are kept within the building. The floors and walls provide a means of containing any spills. Stored chemicals that are not actively in use in the facility are stored in a recently constructed chemical storage room. c. Indicate the number, location, size and use of any above or below ground tanks to store petroleum products or other materials, except water. Describe any emergency response containment plans. No materials are stored in above or below ground tanks. Chemicals are stored in barrels inside the building, and particulates from sanding operations are captured in collectors. Disposal is discussed above in Item 20b. PSI employs several means to prevent fires and minimize the effects if fire does occur, as follows: 1. facility wide sprinkler system is wired to alert the fire department; 2. fire extinguishers are located throughout the facility; 3. employees are trained in extinguisher use (records are on file); 4. local fire department is familiar with the facility and has toured the building; 5. local fire department is aware of the chemicals and products used at PSI and their storage location; 6. PSI employees are trained for evacuation process and exit routes are posted throughout the building; drills are held regularly; 7. exits are clearly marked and have exit lights above the doors; 8. PSI is building a covered structure over the dumpsters to prevent fires from the heat of the sun; this will be completed the first week of July; 9. PSI has a prevention plan in place for dumpster fires; and 10. In case of fire, PSI will notify the closest neighboring businesses. The fire department will address and manage any necessary evacuation of the area. 21. Traffic. Parking spaces added: 0 Existing spaces (if project involves expansion): 48 Estimated total average daily traffic generated: Estimated maximum peak hour traffic Pre-Finishing Specialists, Inc. (PSI) Environmental Assessment Avon, Minnesota 18 Worksheet
20 generated (if known) and its timing: Provide an estimate of the impact on traffic congestion affected roads and describe any traffic improvements necessary. If the project is within the Twin Cities metropolitan area, discuss its impact on the regional transportation system. Up to 48 employees arrive and depart the facility daily. The daily shift runs from 6:00 AM to 5:00 PM, which is when employees arrive and depart. Daily truck traffic averages approximately two non-psi delivery trucks and two departures and arrivals by a PSI truck. Minimal impact is anticipated to traffic congestion. The facility is on a lightly used street, and the relatively small number of vehicles that visit the site daily should not create traffic congestion problems. 22. Vehicle-related Air Emissions. Estimate the effect of the project s traffic generation on air quality, including carbon monoxide levels. Discuss the effect of traffic improvements or other mitigation measures on air quality impacts. Note: If the project involves 500 or more parking spaces, consult EAW Guidelines about whether a detailed air quality analysis is needed. Vehicle emissions from PSI activities are considered minimal. Vehicles arrive and depart the facility, but PSI operations do not involve extended periods of stationary vehicle emissions. Vicinity vehicle emissions, which are not limited to PSI-related emissions, are considered insignificant in comparison to emissions from the adjacent Interstate Stationary Source Air Emissions. Describe the type, sources, quantities and compositions of any emissions from stationary sources of air emissions such as boilers, exhaust stacks or fugitive dust sources. Include any hazardous air pollutants (consult EAW Guidelines for a listing), any greenhouse gases (such as carbon dioxide, methane, and nitrous oxides), and ozone-depleting chemicals (chlorofluorocarbons, hydrofluorocarbons, perfluorocarbons or sulfur hexafluoride). Also describe any proposed pollution prevention techniques and proposed air pollution control devices. Describe the impacts on air quality. Public Concerns Local residents have raised concerns and questions related to PSI air emissions and their potential for adverse effects on human health and the environment. There is, for example, a history of complaints from local people regarding odors from the plant and the potential for human health impacts. Concerns have been expressed about possible carcinogenic properties of the emissions, as well as their potential to cause such non-cancer effects as breathing problems, headaches, nausea, and eye and throat irritation. The petition for environmental review that was submitted to the EQB (and later, to the MPCA) in January 2006 was largely based on concerns regarding the potential for chronic (cancer) effects, as well as acute (non-cancer) health effects such as breathing problems, headaches, nausea, and eye and throat irritation. Concerned citizens in the city of Avon requested that the MDH conduct a preliminary evaluation of cancer rates in Avon (zip code 56310) between 1988 and Although data concerning these cancer rates are not useful in determining health effects from a particular point source of pollution, the data are readily available and public, so the data were provided to the citizens at their request. The MDH's evaluation noted that three types of cancer were elevated (breast and colo-rectal cancer in women and prostate cancer in men); one (lung cancer in men) occurred less often than expected. Two of the elevations occurred throughout the time period; one (prostate) occurred in the time period alone. Prostate cancer was elevated for all of Stearns County from and is believed to be due to regional prostate cancer screening practices. Pre-Finishing Specialists, Inc. (PSI) Environmental Assessment Avon, Minnesota 19 Worksheet
21 The MDH noted that cancer rates that are higher than expected do not by themselves indicate environmental contamination, and low or normal rates do not necessarily indicate the lack of some environmental problem. There are many potential confounders that are difficult to take into account when evaluating and interpreting cancer data. The mobility of people is problematic given the long latency period of most cancers; normal variation of cancer rates is greater with small populations; local and regional medical practices can and do affect cancer rates; and many of the cancers have little or no evidence of being caused by environmental pollutants given the available information in the scientific literature today. The MDH also noted that the AERA evaluated the incremental cancer risk from the facility s air emissions, and this risk estimate was well below the additional lifetime risk threshold (see AERA Findings, below). In addition, citizens in the city of Avon have expressed concerns that the facility s air emissions may exacerbate asthma. The MDH Asthma Program has received requests for asthma surveillance data by zip code for the city of Avon and surrounding areas. The MDH collects data on asthma prevalence (i.e., the number of people with asthma) for the state, Twin Cities Metropolitan area and greater Minnesota as a whole, but does not have data on the prevalence of asthma by county or zip code. The Asthma Program also collects data on asthma hospitalizations and emergency department (ED) visits, which are indications of asthma exacerbations that could be related to any or all of the following: asthma severity, exposure to asthma triggers, poor asthma management, or lack of access to regular health care. The Asthma Program provides rates of asthma hospitalizations and ED visits by county; but cannot provide data by zip code when, as in this situation, the number of asthma hospitalizations and ED visits are too few to conduct meaningful analyses or to protect data privacy. Between fall 2004 and spring 2005, the MDH Asthma Program conducted an evaluation of its school asthma training program in the Albany school district, which includes Avon Elementary School. Asthma policies and procedures at each school in the district were reviewed before and after staff attended an MDH asthma training, to see if the training resulted in actual changes in the schools. While planning for this activity, the MDH Asthma Program staff learned that the health offices in Albany district schools keep track of students with asthma. These data would need to be interpreted with care since tracking of asthma cases is generally based on parent report of physician diagnosis, meaning that any observed increase in the percentage of students with asthma may in part be an indication of physicians increased recognition of the disease. Given this limitation and the lack of data to adequately evaluate exposures to air pollutants for the study population from potential indoor and outdoor air pollution sources, it would be difficult, if not impossible, to associate school asthma data with emissions from the facility. Another incidence of local involvement was a request made by local residents that the legislature appropriate funding for a study of air quality in the Avon area. In its original form, the legislation called for an assessment of xylene in the ambient air and appropriated $6,000 for the study. This legislation did not pass. But it did lead to a legislative request that MPCA monitor air quality at the local elementary school, which is approximately 3/5 of a mile from the facility. The MPCA agreed to perform limited air sampling in response to this request. The air sampling was undertaken in response to a specific legislative request for information on the extent to which school children are being affected by PSI emissions. Available staff resources and the press of other work limited the level of effort that could be devoted to this work. Each sample was collected for one hour when winds prevailed from the south in an effort to assess the potential impact of emissions from PSI and other sources. Analysis of the samples did not reveal elevated levels of VOCs. Pollutant concentrations were generally low compared with other (and larger) Pre-Finishing Specialists, Inc. (PSI) Environmental Assessment Avon, Minnesota 20 Worksheet
22 urban monitoring sites but were comparable to data collected for residential areas in small communities. To this extent, the results suggest a low level of concern about exposure to potential health risks from VOC exposures at the school. The MPCA believes that, given its resource and time constraints, the conclusion above is reasonable and responds to the specific concern that was expressed. The MPCA also believes that this is the only conclusion that can reasonably be drawn based on this limited study. Although the scope of the study was necessarily limited due to staff and time limitations, the onehour samples were collected at the school when winds prevailed from the south where the majority of the VOC sources are located with respect to the school. These sources include PSI, Tischler Wood Products, Columbia Gear Corporation, mobile source emissions from Interstate 94, gas stations, an automotive body shop and a propane facility. Collecting one-hour samples downwind from the emission source(s) is considered a worst-case sampling approach that typically produces the highest pollutant concentrations. At the same time, it must be remembered that no information is currently available about the level of production activity (and resulting emission levels) at any of the VOC sources in the area at the time of sampling. Nevertheless, MPCA technical staff believe that, in this case, collecting additional samples over longer averaging times such as 24 hours or when winds are not prevailing from the direction of the emission source(s) is unlikely to reveal higher ambient VOC concentrations. Finally, the MDH received a request from a citizen to perform a health consultation to assess potential health risks from PSI s air emissions. Health consultations are usually performed in situations where environmental review is not being done. In addition, the MDH has been actively involved in the AERA and EAW for this facility. MDH concluded that the concerns about health risks from air emissions will be addressed through the environmental review process that currently is in progress and, therefore, MDH recommended not conducting a health consultation. Note that this does not eliminate the possibility that a health consultation may be requested at some time in the future if there are additional or ongoing concerns regarding potential health risks. Facility Emissions The majority of PSI s emissions are VOC emissions from the spray application of stains and finishes (list, Attachment 9). The listed chemicals are those that have been used at the facility since June Additional chemicals that have not been used since June 2005 but have been used previously are also listed in Attachment 9 as potentially emitted, since they may be emitted in the future depending on business demands. As production levels rise and fall based on orders received, emissions will change qualitatively and quantitatively, but the total mass of VOCs emitted will not be allowed to exceed total permitted levels. Attachment 8 summarizes the emission units by emission unit number, facility designation, emission type, proposed limited capacity, and proposed permitted VOC potential to emit. Detailed air emission calculations are presented in Attachment 10. Pre-Finishing Specialists, Inc. (PSI) Environmental Assessment Avon, Minnesota 21 Worksheet
23 PSI also emits non-voc pollutants, but they are emitted in trivial amounts, with one exception. Acetone is an organic compound but is not classified as a VOC. ( VOC is a regulatory, rather than scientific, term, and refers to chemicals known to contribute to ozone formation in the atmosphere. Acetone does not do this.) Because it is not a VOC, acetone emissions are not limited by the permit, which is also true of the other non-voc emissions. Fugitive dust emissions are negligible for the facility. Parking areas are paved. No storage piles or other fugitive sources are present at the facility. Air Emission Risk Analysis The proximity of the PSI facility to residential areas, businesses, and other areas frequented by the public, the history of complaints about chemical odors from the facility, and expressed public concerns about human health risks from facility emissions all led MPCA staff to direct that PSI accompany its permit application with an Air Emission Risk Analysis (AERA). PSI has complied with this request (see Attachment 12). Because of expressed community concerns regarding potential health effects from air emissions from this facility, the MPCA requested that the MDH provide consultation on the AERA and environmental review process for this facility. As a result, MDH staff participated in regular technical discussions with the MPCA review group and provided technical guidance on the AERA and EAW. An AERA is an assessment of the potential for human health risk from exposure to air emissions from an emission source. This analysis is intentionally conservative, meaning that it is based on a worst case scenario of exposure intensity and duration. Among the assumptions in this case are that the facility will routinely emit VOCs at maximum permitted hourly and annual rates. As discussed elsewhere, neither is a likely scenario. On the other hand, an AERA evaluates the emissions and human health risks solely from the source in question, and does not itself consider the potential for cumulative impacts from that source and any other sources that may exist in the area, except as a qualitative assessment. The inherent conservatism in AERAs is justified by the nature of the risks being evaluated; by the fact that MPCA and MDH-approved inhalation health benchmarks do not exist for some emitted pollutants, so there is no way to quantitatively evaluate the risk those chemicals pose; and by the fact that full facility operation and emission at the full permitted rate on a continuous basis is, in fact, allowed by the permit and is at least a theoretical possibility. In its essentials, an AERA analysis consists of comparing predicted potential levels of human exposure to individual chemicals with published and agency-approved inhalation human health benchmarks and thresholds for those chemicals. Air emission modeling is used to predict ambient pollutant concentrations in the area surrounding the emission source. Human health benchmarks (i.e., Health Risk Values) come from the scientific literature and are defined by MDH as the concentration of a chemical or defined mixture of chemicals in ambient air, at or below which the chemical or defined mixture of chemicals is unlikely to cause an adverse health effect to the general public, including susceptible populations. If the modeled exposure levels are high enough to approach the health benchmarks and thresholds or exceed them, then the AERA is indicating that the potential for adverse effects on human health exists. This is not a certainty, since the response of individual people to health risks is variable. For this and other reasons, health benchmarks and risk thresholds cannot be interpreted as bright lines that, if exceeded, definitely predict serious health effects. They do, however, give an indication of the point at which air concentrations of pollutants may be a potential concern, and indicate the increasing desirability of pollutant mitigation to reduce potential human exposure. Pre-Finishing Specialists, Inc. (PSI) Environmental Assessment Avon, Minnesota 22 Worksheet
24 To make this determination, the AERA process divides the highest modeled exposure level for each emitted pollutant by its published health benchmark, if available. If the two numbers are close together in magnitude, the quotient (known as the hazard quotient ) will approximate 1.0. When, as in this case, there are numerous pollutants to evaluate, the individual hazard quotients are summed to produce what is known as a hazard index. If the sum approaches or exceeds 1.0, this is interpreted as an indication of potential health risk. In sum, a hazard index at or near 1.0 is regarded as an indicator of the potential for (not a predictor of) human health effects. Once the calculation component is completed, interpretation is required that takes the result into account along with other factors that are relevant to the analysis. This is addressed in more detail below. Air Emission Modeling Air emission dispersion modeling was conducted for the AERA to estimate the concentration of emissions of VOCs and hazardous air pollutants (HAPs) to which people may be exposed in the vicinity of the facility. The same modeling was used in the analysis of odor impacts (see Item 24). Modeling is a computer driven set of calculations that shows how emissions move, disperse, and change with distance away from the source. The result is a grid that shows what the air concentrations of the modeled pollutants will be at various locations in the vicinity of the source. A modeling exercise always identifies a location in an area frequented by the public at which the highest potential exposure concentrations for each pollutant are predicted to occur. These highest modeled exposure levels are then carried forward as the basis for the AERA analysis. As noted above, they are assumed for analysis purposes to be the set of individual chemical air concentrations that people would be exposed to with the project, and are compared with the published health benchmarks to determine if people are likely to be at risk from project air emissions. Maximum one-hour and annual air concentrations are derived from the air dispersion modeling by assuming that all the existing and proposed emission sources at the facility (EU 001 will be removed and was not modeled) are operating at maximum permitted capacity continuously (24 hours per day, 365 days per year). AERA Findings The AERA findings indicate that chronic cancer and non-cancer risks associated with air emissions from the facility are well below levels of health concern. However, the acute risk estimate (i.e., hazard index) based on hourly emissions was 0.8, which is approaching 1.0. Given that less than 40 percent of the VOC mass was assessed in the AERA, and given the proximity of the facility to receptors, the AERA concluded that acute exposures to hourly emissions from the facility, without mitigation or pollution prevention, at locations near the facility could be approaching levels of health concern, especially for susceptible populations. As also noted, this is especially true for those who already have unrelated breathing difficulties, such as those with asthma, emphysema, or other respiratory conditions. The potentially affected susceptible population also includes children and the elderly. Acute effects can also affect Pre-Finishing Specialists, Inc. (PSI) Environmental Assessment Avon, Minnesota 23 Worksheet
25 otherwise healthy people, by causing throat and eye irritation, chest tightness, headaches and nausea. This is not to be interpreted as meaning that these air emissions cause these conditions, only that the emissions may aggravate them. Chronic health risks, such as cancer risk, were found to be minimal in this analysis. None of the cancer risk analyses found a significant cancer risk. This analysis is inconclusive with regard to possible elevated cancer rates in the Avon zip code area, and this limited analysis does not indicate any association between these cancer rates and PSI emissions. The primary driver for the acute risk finding is isopropyl alcohol, also known as isopropanol or IPA. This chemical accounts for fully 78 percent of the risk calculated by the AERA. It has been shown to cause eye and respiratory irritation at high levels of exposure. Isopropyl alcohol is not considered highly toxic in relatively low concentrations but may indicate health risks at elevated concentrations or high volumes. That is the case here. This means that product substitutions or other mitigation that can reduce isopropyl alcohol concentrations in ambient air can in turn reduce health risks as long as the substitutes do not pose similar risks themselves. Exposure to other compounds, such as the benzene ring chemicals (including toluene and xylene), were found by the analysis to be well below levels of health concern, either in the chronic or acute analysis. In evaluating this result, the MPCA staff has considered not only the calculated results, but also the particular circumstances surrounding this case. The circumstances considered included the fact that the facility is located quite close to residential areas, businesses, and other areas frequented by the public. It is also true that agency-approved or acceptable inhalation health benchmarks can be used to assess only 37 percent of the VOC mass emitted by PSI. This means that more than 60 percent of the emitted VOC chemical mass is not accounted for in the AERA risk estimate. Without benchmarks, it is impossible to know whether the unaccounted-for pollutants represent additional risk or not. Another consideration is that, as reported in the scientific literature, simultaneous exposure to acetone and isopropyl alcohol may increase the acetone body burden in exposed individuals. This is because isopropyl alcohol is metabolized to acetone in the liver. However, aside from the acute effects of isopropyl alcohol exposure as addressed in the AERA, the resultant human health effects are not likely to be significant, because acetone does not cause toxicity except in high concentrations, it is readily excreted by healthy humans, and it is a natural product of human metabolism. Although acetone is emitted at relatively high levels by PSI operations (see Attachment 9), the analysis does not indicate that acetone is a likely driver of significant health risk. Against all this must be arrayed the inherent conservatism of the analysis. The modeling analysis assumes that all workstations are operating at full permitted capacity, 24 hours a day, 365 days a year, a condition unlikely to actually occur. (It should be noted, however, that it is not the annual but the hourly or acute exposure that is of primary concern. Hourly emission rates may reach the levels assessed in the AERA for periods of varying duration if business levels warrant. To that extent, the analysis is less inherently conservative.) Although the modeling predicts that the highest human exposure levels for individual pollutants will occur at different locations, the AERA analysis sums the individual hazard quotients (which adds up to the hazard index of 0.8) as if they all occurred in the same place and a human receptor could be exposed to all of them simultaneously. Having considered the above facts and the results of the analysis in this case, the MPCA staff has concluded, based on the particular circumstances surrounding this case, that a hazard index of 0.8 Pre-Finishing Specialists, Inc. (PSI) Environmental Assessment Avon, Minnesota 24 Worksheet
26 indicates the need for additional mitigative steps to be taken to further reduce the project s potential human health risk. Mitigation Analysis There are several available approaches to risk reduction at a facility such as PSI. The list would include actual controls on the pollutant stream that act as or before the pollutants are emitted; changes in materials and/or machines; and operational limitations. Controls on the pollutant stream. As noted elsewhere, VOC emissions from PSI are essentially uncontrolled, meaning they are vented to the atmosphere without treatment to mitigate them. This relies on dispersion and dilution in the atmosphere to mitigate potential adverse impacts on human health and the environment. As part of the environmental evaluation of the proposed project and planning for project implementation, PSI evaluated the availability and feasibility of VOC controls on plant emissions. Computer software known as U.S. Environmental Protection Agency (EPA) s Air Compliance Advisor (Version 7.5) was used to evaluate pollution control alternatives for the facility. The various alternatives offer ways of destroying or capturing VOCs rather than releasing them. Methods of destruction include four types of incinerators and a flare. Capture methods include a water absorption scrubber, adsorption by carbon, or concentration by a condenser. The EPA Air Compliance Advisor considers emission concentrations, air flow rates, and fuel and equipment costs to determine which, if any, control technologies are technically or economically feasible. The Air Compliance Advisor software uses 2003 costs. To account for inflation, values were adjusted by means of Vatavuk Air Pollution Control Cost Indexes published in February The EPA guidance for Best Available Control Technology sets an upper limit of approximately $10,000 per year per ton of pollutant controlled as an upper limit for reasonable control technology costs. Above $10,000 per ton per year, the EPA considers control to be cost prohibitive. On this basis, add-on pollution control equipment was found to be either technically infeasible or cost prohibitive. Attachment 13 summarizes the pollution control alternatives evaluated and Vatavuk Air Pollution Control Cost Indexes. As the table indicates, all pollution control alternatives except product substitution are either technically infeasible or cost prohibitive. All technically feasible options would cost more than $10,000 per year per ton of pollutant, and most were significantly greater than the threshold value. The output from EPA s Air Compliance Advisor program and cost information for a carbon adsorption unit is quite voluminous and is, therefore, not attached to this EAW, but is available to reviewers upon request. Another form of control would involve passing facility air emissions through a biofilter. Biofilters work by supporting living biomass (bacteria, molds, yeasts) that consume the pollutants as the pollutant stream passes through the biofilter medium. Biofilters have been used successfully to reduce odorous impacts at feedlots. A significant obstacle to the above types of pollution control is the high air flow rate coming out of PSI, which is necessary for adequate ventilation and to minimize exposure of PSI employees. Also, building air is released from the building through a total of 19 separate stack vents. Pre-Finishing Specialists, Inc. (PSI) Environmental Assessment Avon, Minnesota 25 Worksheet
27 Pollution Prevention by Product Substitution. Another option for reducing emissions is product substitution to take advantage of new coating and other materials that contain lower volumes of VOCs. Having considered the available options, PSI proposes mitigation by product substitution, using water based rather than organic solvent based materials, as long as the resulting final products meet PSI s standards for quality and those of its customers. In March 2006, PSI began using a non VOC/non HAP cleaner, an ultra low VOC coating, and a water based stain. The cleaner substitution is more expensive but has significantly reduced the use of a higher VOC content product. The new cleaner replaces approximately 50 percent of the existing sealer blend cleaner, which has reduced total facility emissions of isopropyl alcohol (the primary acute human health risk driver) by approximately 3,000 pounds per year based on 2005 production rates. The ultra low VOC coating substitution has replaced the largest volume coating within PSI. This substitution has reduced isopropyl alcohol by approximately 2,800 pounds per year based on 2005 production rates. Water borne stains have replaced nearly 70 percent of the solvent borne stains historically used and that percentage is anticipated to increase in the future. The water borne stains have reduced total facility emissions of isopropyl alcohol by 4,000 pounds per year based on 2005 production rates. In combination, these product substitutions have decreased total facility VOC emissions by nearly 50 tons per year based on 2005 production rates. At 2005 production rates PSI anticipates a total facility VOC emission rate of less than 20 tons per year. PSI will continue to experiment with new product formulations to reduce VOC emissions and use them when product quality and specifications can be met. Operational Limitations. The PSI facility is capable of operating at a level considerably higher than what will be allowed under the new permit. The facility operates only one shift per day, five days per week. Restricting the operating level is another way to limit emissions to acceptable rates. PSI has requested an initial facility operating limit of 70 tons per year VOC, which is the emission rate assumed in the AERA analysis. PSI expects that this level will meet any future growth potential that it may need while assuring that human health risks are maintained at or below the level calculated by the AERA. PSI is also proposing to substitute a new stain material that consists of a greatly reduced isopropyl alcohol component over that currently used (1.79 percent isopropyl alcohol vs percent). This would reduce the AERA calculated human health risk. By PSI s calculations, the hazard index would be reduced from 0.8 to 0.6. Finally, PSI is proposing that the permitted annual emission rate be reduced by about five percent per year until a 50 ton per year permitted maximum is reached in This will have the effect of reducing the maximum permitted human health risk in a series of steps over time. This will give PSI a reasonable amount of time to identify and phase in new low emission materials and seek customer acceptance of them. 24. Odors, noise and dust. Will the project generate odors, noise or dust during construction or during operation? Yes No If yes, describe sources, characteristics, duration, quantities or intensity and any proposed measures to mitigate adverse impacts. Also identify locations of nearby sensitive receptors and estimate impacts on them. Discuss potential impacts on human health or quality of life. (Note: fugitive dust generated by operations may be discussed at item 23 instead of here.) Pre-Finishing Specialists, Inc. (PSI) Environmental Assessment Avon, Minnesota 26 Worksheet
28 Odors The PSI facility emits VOCs into the atmosphere during its hours of operation, which typically comprises weekdays from 6:00 AM to 5:00 PM. These compounds include alcohols, esters, ketones, ethers, and aromatic hydrocarbons. Air quality modeling was performed to estimate the concentrations of the individual organic gases at receptors in the vicinity, based on the projected emission rates for the proposed PSI project (see Item 23). In addition to being compared with health benchmarks, the resulting highest modeled concentrations were compared with odor detection threshold concentrations from the scientific literature. The analysis found that the predicted concentrations of several compounds exceed the published odor threshold concentrations for those compounds. The odor detection threshold concentration is defined as the concentration of any gas at which 50 percent of the population can detect the gas s odor. It must be emphasized that this analysis determines the potential for detection, not annoyance. There is little information in the literature regarding odor annoyance levels for the pollutants emitted by PSI. As a rule of thumb, dividing the maximum hourly concentration of a gaseous compound at a receptor by the odor detection threshold concentration (taken from the scientific literature) gives an odor number, which, in turn, gives an index to the number of people likely to detect the odor. The odor analysis found that in this case an ester known as n-butyl acetate would likely have the highest odor number for the proposed project. The entire odor analysis is included as Attachment 14. This ester is characterized as having a sweet odor and is a major contributor to the odor of bananas. Population response curves suggest that 88 percent of the population could detect the estimated maximum n-butyl acetate concentration. The other modeled gases only had modeled maximum concentrations sufficiently high to be detected by less than six percent of the population. The analysis suggests that n-butyl acetate could be the dominant odorous gas after implementation of the PSI Emission Reduction Project. A frequency analysis was performed to determine how often detectable concentrations of n-butyl acetate existed at the location that yielded the maximum hourly n-butyl acetate concentration. The modeling results indicate that 99.5 percent of the time the n-butyl acetate concentrations will be below the odor threshold concentration. This means that only about 0.5 percent of the time will more than 50 percent of the population be able to detect the n butyl acetate. Also, this would occur only at the location of the highest concentration of n-butyl acetate. At other locations in the vicinity, the impact would be expected to be lower. Thus, the odor analysis suggests that the frequency at which n-butyl acetate would be detected by a substantial fraction of the population is low. It should also be remembered that n-butyl acetate is not the primary risk driver for acute and chronic human health risk, and is not associated with high toxicity. Noise Noise from the facility is considered minimal. All manufacturing and processing activities are inside the building. Fans from dust collectors generate detectable noise outside the facility, but it is not considered to be significant. Pre-Finishing Specialists, Inc. (PSI) Environmental Assessment Avon, Minnesota 27 Worksheet
29 Dust Dust is generated by sanding operations. Resulting particulates are vented and captured in filter collectors located on the outside of the facility. Fugitive dust emissions are negligible for the facility. Parking areas are paved. No storage piles or other fugitive sources are present at the facility. 25. Nearby resources. Are any of the following resources on or in proximity to the site? a. Archaeological, historical, or architectural resources? Yes No b. Prime or unique farmlands or land within an agricultural preserve? Yes No c. Designated parks, recreation areas, or trails? Yes No d. Scenic views and vistas? Yes No e. Other unique resources? Yes No If yes, describe the resource and identify any project-related impacts on the resources. Describe any measures to minimize or avoid adverse impacts. The State Historic Preservation Office noted that no archaeological, historic or architectural resources are known from the project site (Attachment 15). Historic structures are present in Avon including commercial buildings, a bank building, depot, grain mill, church, school and at least one residence. Most of these structures are in the downtown area, and none are immediately adjacent to PSI (Attachment 7). Because PSI does not propose to excavate or expand their facilities, no impacts to archeological or historic structures will result. A city park, beach, ballfields, and the Lake Wobegon Regional Trail are present in the city of Avon. None of these facilities are adjacent to the PSI property (Attachment 7). No significant impacts are anticipated from PSI operations. 26. Visual impacts. Will the project create adverse visual impacts during construction or operation? Such as glare from intense lights, lights visible in wilderness areas and large visible plumes from cooling towers or exhaust stacks? Yes No If yes, explain. 27. Compatibility with plans and land use regulations. Is the project subject to an adopted local comprehensive plan, land use plan or regulation, or other applicable land use, water, or resource management plan of a local, regional, state or federal agency? Yes No If yes, describe the plan, discuss its compatibility with the project and explain how any conflicts will be resolved. If no, explain. The property is zoned commercial according to the City of Avon Comprehensive Plan, which is appropriate for the PSI facility. 28. Impact on infrastructure and public services. Will new or expanded utilities, roads, other infrastructure or public services be required to serve the project? Yes No If yes, describe the new or additional infrastructure or services needed. (Note: any infrastructure that is a connected action with respect to the project must be assessed in the EAW; see EAW Guidelines for details.) Pre-Finishing Specialists, Inc. (PSI) Environmental Assessment Avon, Minnesota 28 Worksheet
30 29. Cumulative impacts. Minn. R , subp. 7, item B requires that the RGU consider the cumulative potential effects of related or anticipated future projects when determining the need for an environmental impact statement. Identify any past, present or reasonably foreseeable future projects that may interact with the project described in this EAW in such a way as to cause cumulative impacts. Describe the nature of the cumulative impacts and summarize any other available information relevant to determining whether there is potential for significant environmental effects due to cumulative impacts (or discuss each cumulative impact under appropriate item(s) elsewhere on this form). Besides PSI, there are three businesses that emit VOCs in the city of Avon. The combined emissions may influence the hazard and nuisance conditions in the community. The other VOC emitting businesses are (Attachment 7): Avon Body Shop 430 County Road 50 Avon, Minnesota Columbia Gear Corporation 530 County Road 50 Avon, Minnesota Tischler Wood Products Inc. 401 Blanttner Drive Avon, Minnesota Avon Body Shop and Tischler Wood Products annually use between 790 and 1,300 gallons of VOC containing solutions, of which approximately 30 to 40 percent are actual VOCs. The following table compares MPCA reported annual VOC acquisitions (and presumably emission) for the four businesses: Year Avon Body Shop (estimated tons) Tischler Wood Products (estimated tons) Columbia Gear Corporation (reported tons) PSI (reported tons) Unknown Unknown Unknown Unknown Unknown Among the four businesses in the city of Avon that emit VOCs, PSI is the leading VOC emission source. Through equipment upgrades and product substitution, PSI is making efforts to reduce its contribution to VOC emissions in the city of Avon. No additional facility expansions or increases in emissions are planned by PSI. Pre-Finishing Specialists, Inc. (PSI) Environmental Assessment Avon, Minnesota 29 Worksheet
31 I-94 is also a source of VOCs, generated by vehicle traffic. Unfortunately, the MPCA s ability to evaluate the freeway s contribution to cumulative effects in this case is limited. The MPCA has limited census tract data from 1999 that includes some emissions in common with PSI. Unfortunately, census tract data is not directly comparable with that generated for the AERA analysis, and, unfortunately, this data does not include isopropyl alcohol concentrations. This eliminates the ability to assess cumulative impacts related to the primary risk driver for this project with vicinity mobile sources. The key consideration here is that, of the health risks evaluated in the AERA, the only one showing levels of potential health concern is the acute exposure hazard index. The primary driver of this potential risk is isopropyl alcohol. There is no census tract data on air concentrations of isopropyl alcohol. There are no emission factors in the scientific literature for isopropyl alcohol from mobile sources, so the potential isopropyl alcohol impacts from I-94 cannot be modeled. Other VOCs emitted by the other sources will likely add somewhat to the cumulative total VOC impact, but the increase is likely minimal in comparison with the risk posed by PSI emissions of isopropyl alcohol. Since the permit will require phased annual reductions in VOC emissions, as well as reductions in the permitted use of isopropyl alcohol at PSI by 2008, based on the AERA findings, significant cumulative effects do not appear likely. Specific concentrations were not modeled or assessed with regard to nearby VOC emitting facilities. 30. Other Potential Environmental Impacts. If the project may cause any adverse environmental impacts not addressed by items 1 to 28, identify and discuss them here, along with any proposed mitigation. No additional environmental impacts are anticipated beyond those addressed in Items 1 to Summary of issues. List any impacts and issues identified above that may require further investigation before the project is begun. Discuss any alternatives or mitigative measures that have been or may be considered for these impacts and issues, including those that have been or may be ordered as permit conditions. Based on the AERA findings and the qualitative considerations associated with the PSI project, the individual site permit for this project will contain the following terms and conditions: 1. An initial maximum permitted annual emission rate of 70 tons total mass VOC. 2. An annual five percent reduction in this permitted rate until an annual rate limit of 50 tons is reached in Hourly maximum VOC usage limits for each workstation. 4. A requirement that substitute coating material not exceeding 1.80 percent isopropyl alcohol be the only material used in EU 003 and EU 006 after July 1, 2008; and that use of the higher isopropyl alcohol material now in use be eliminated by that date. 5. A companion requirement that total permitted plant isopropyl alcohol emissions be reduced after July 1, 2008, to reflect the reduction achieved by elimination of the higher isopropyl alcohol material in those two machines. These terms and conditions will help reduce the estimated human exposures to VOCs and potential health risks associated with isopropyl alcohol, both by steps to be taken immediately and additional steps to be taken over time. Pre-Finishing Specialists, Inc. (PSI) Environmental Assessment Avon, Minnesota 30 Worksheet
32
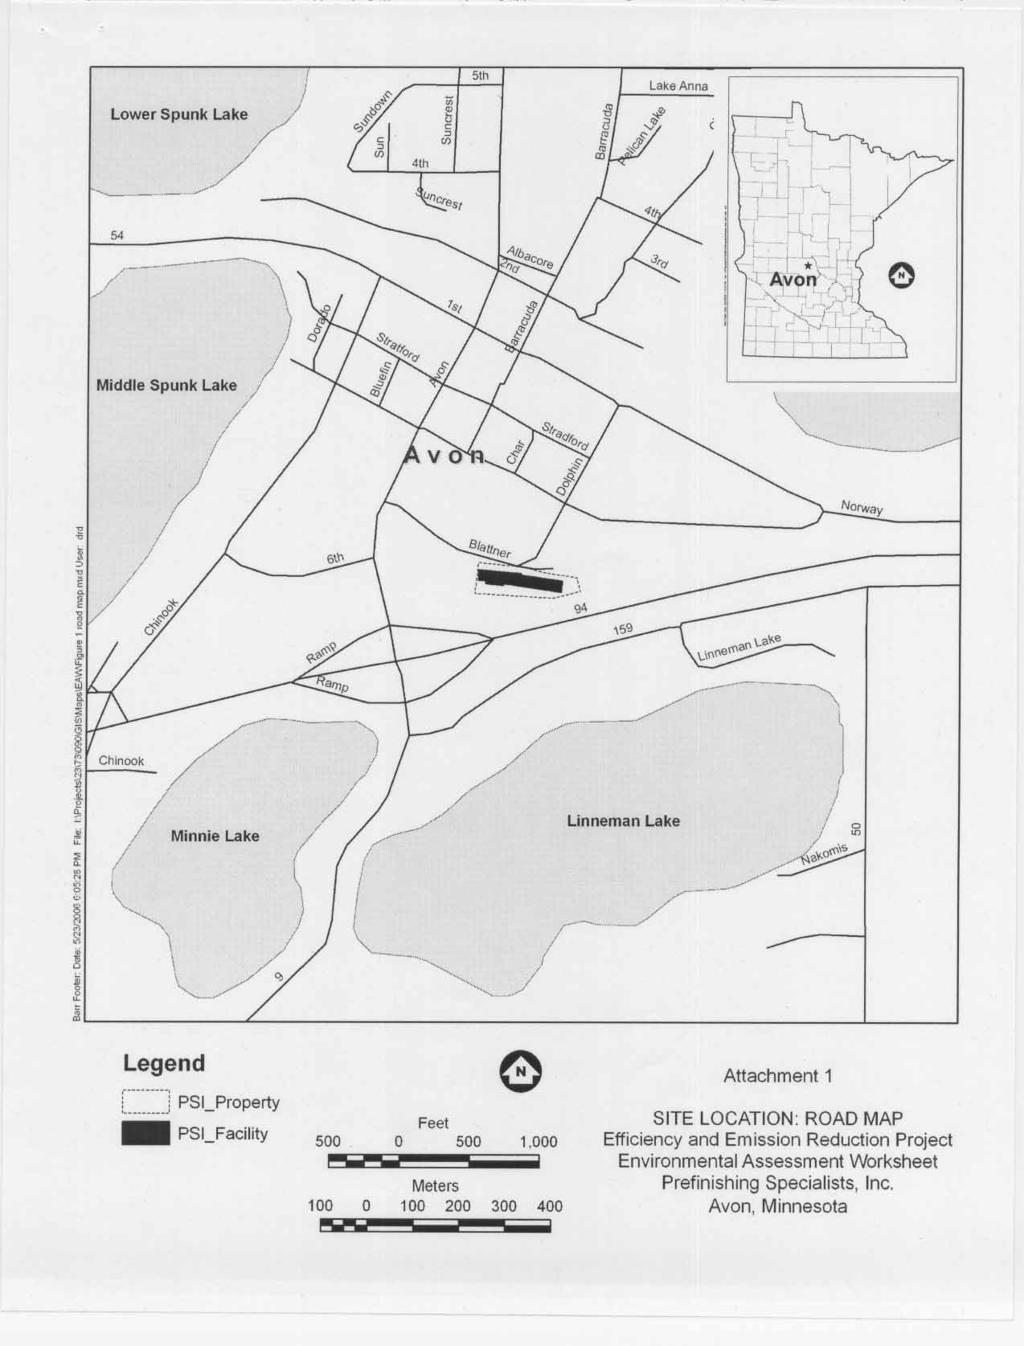
33
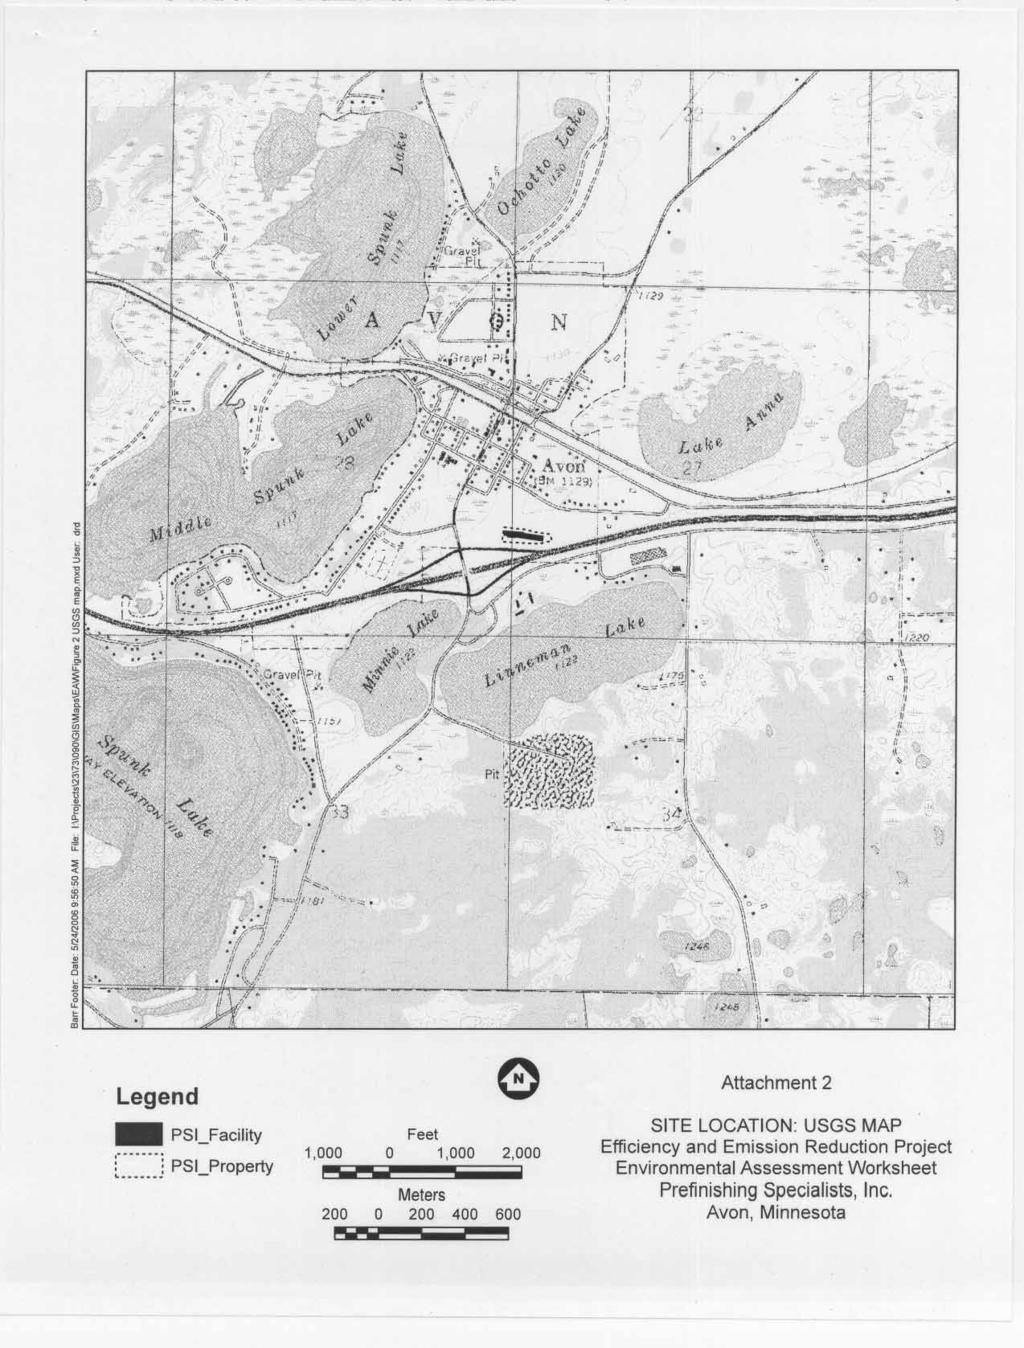
34
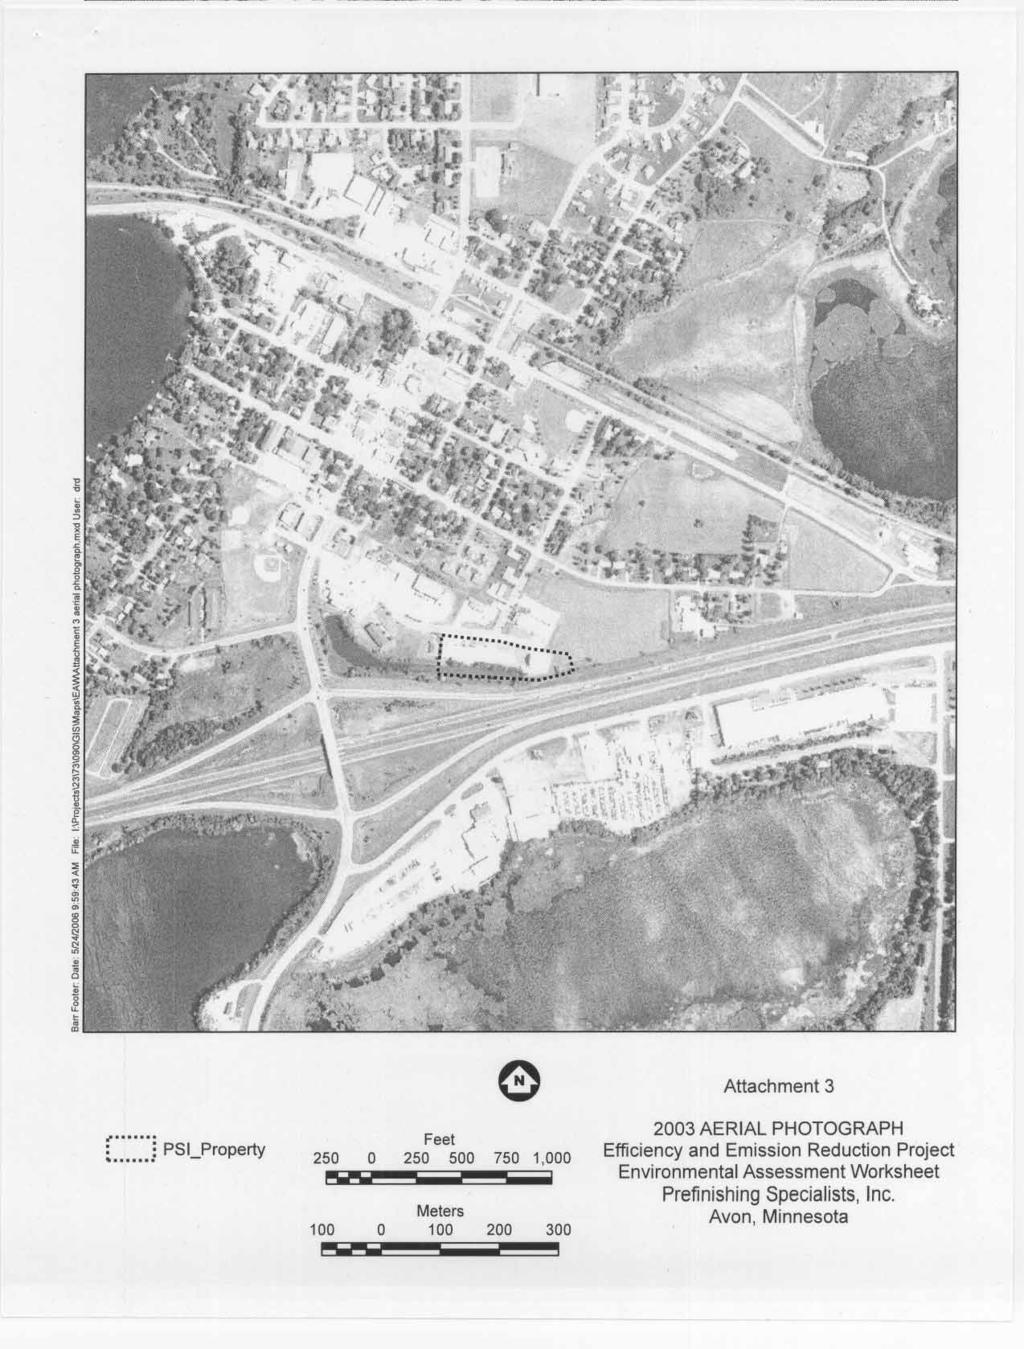
35
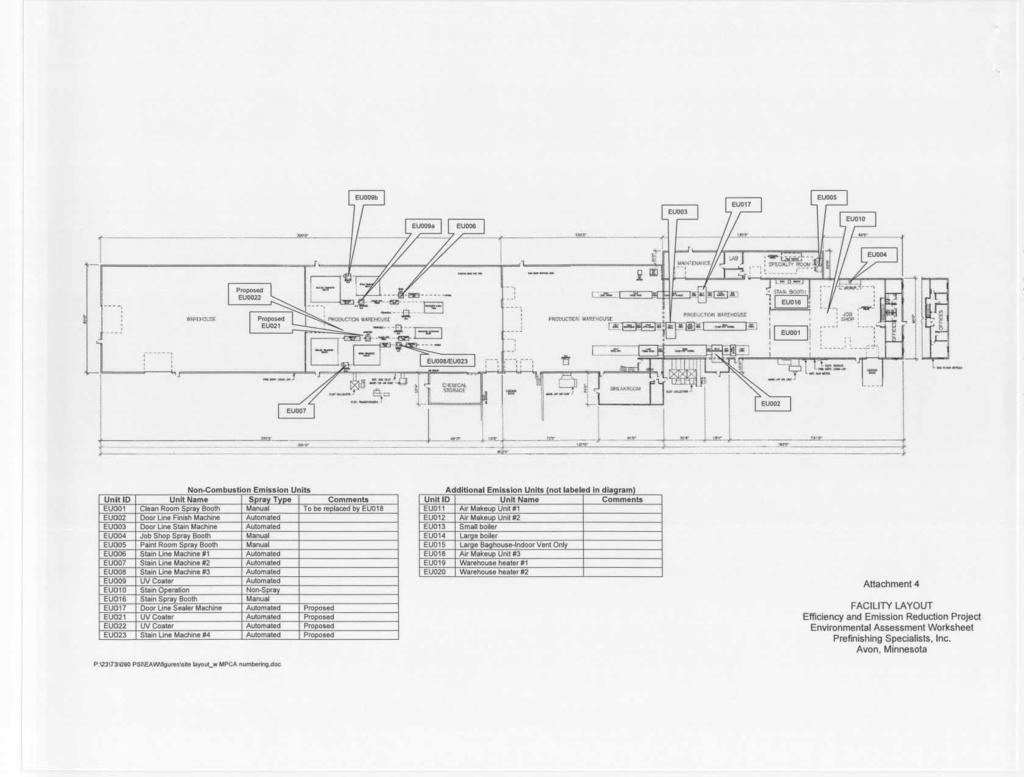
36
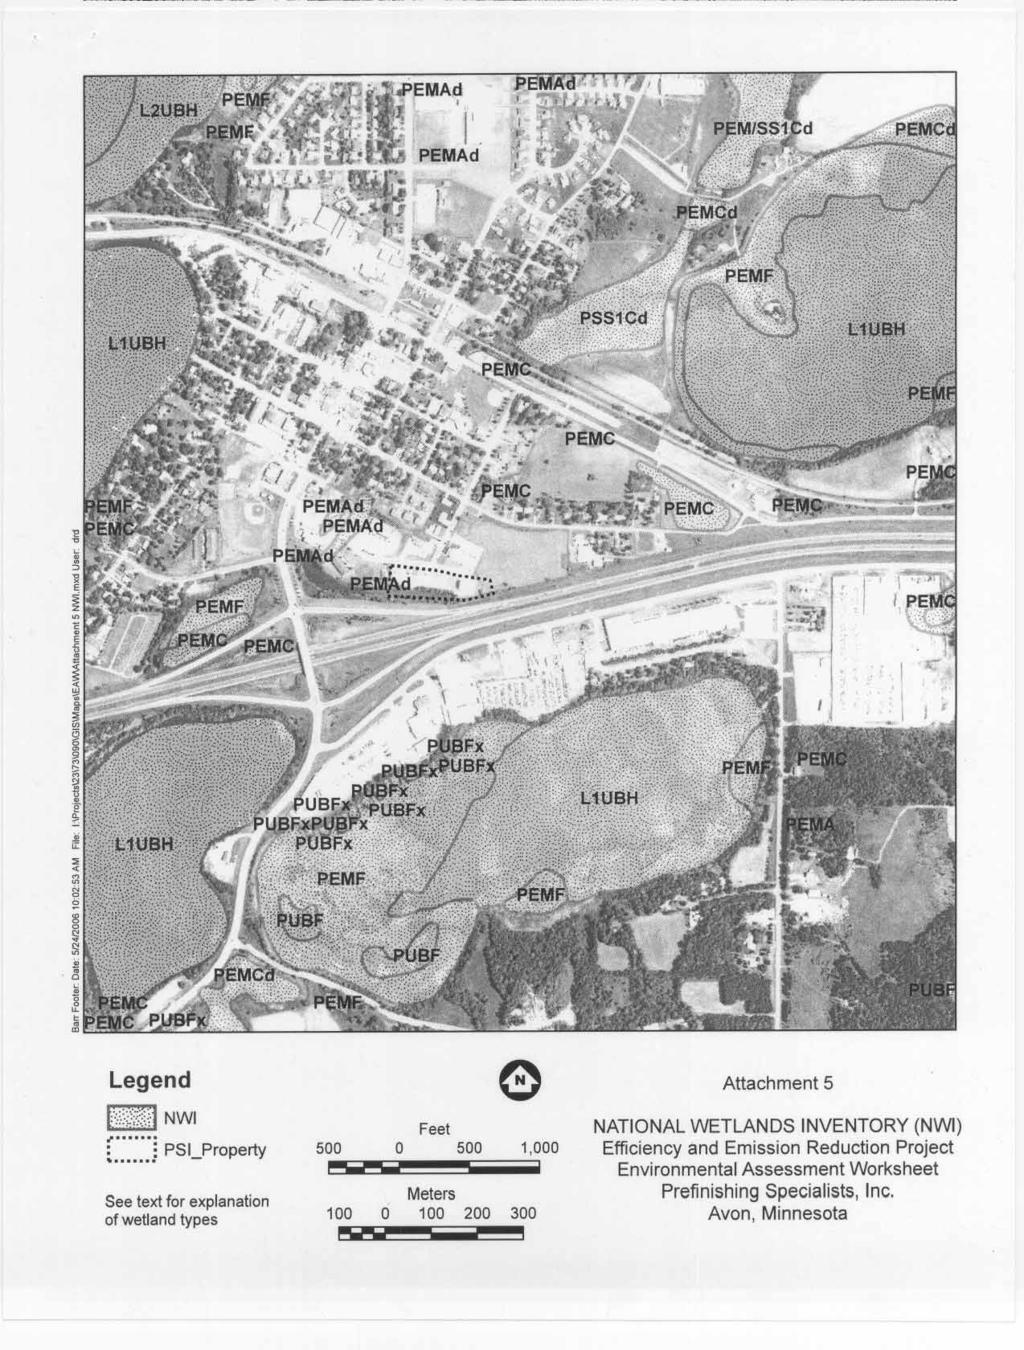
37
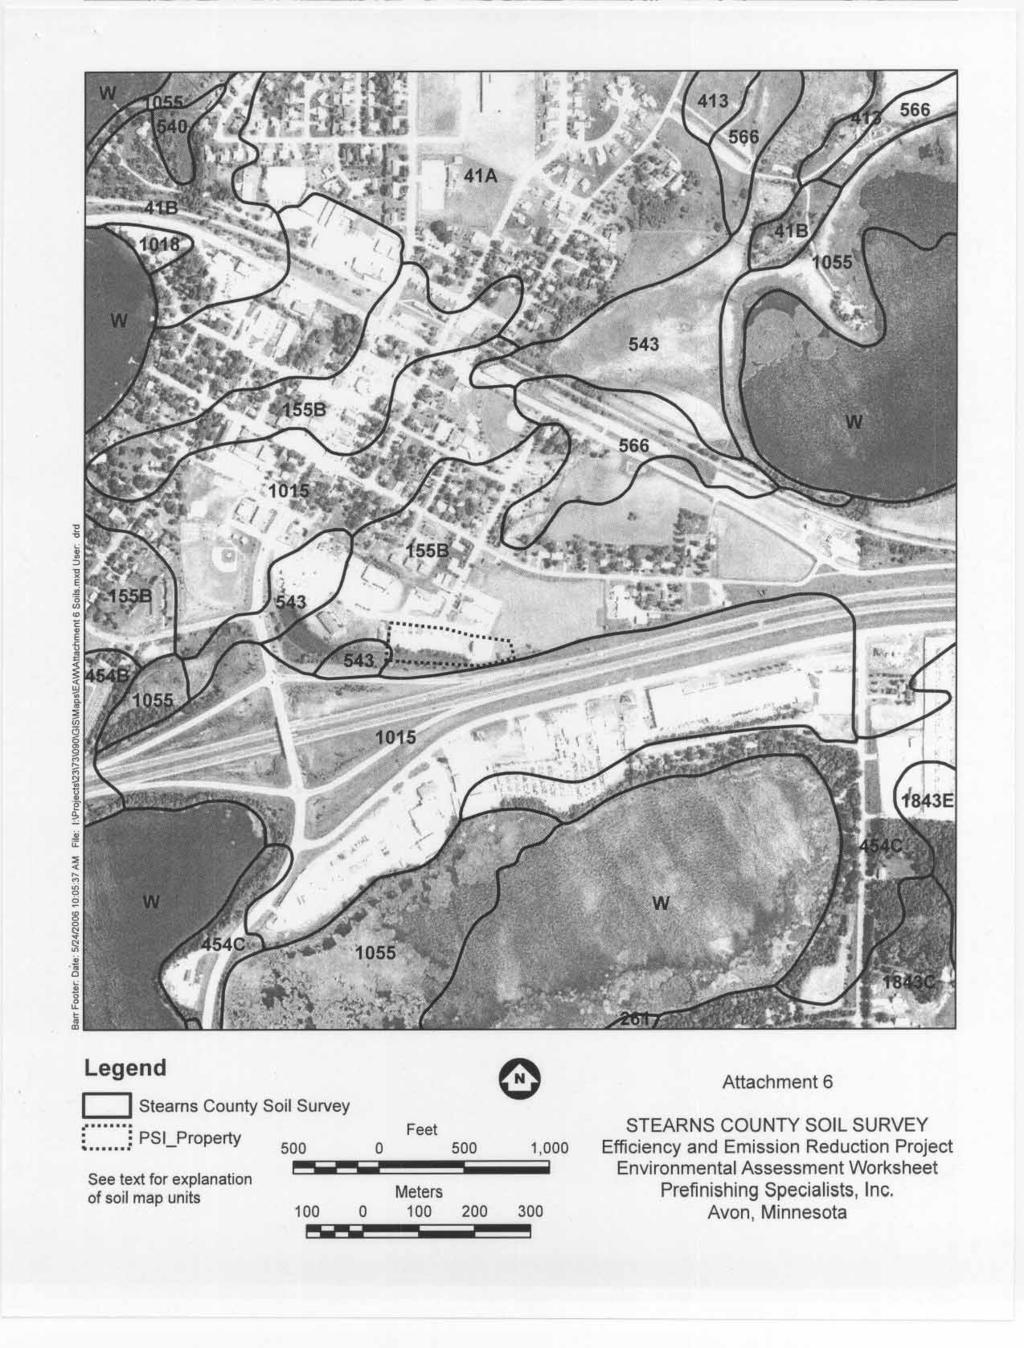
38
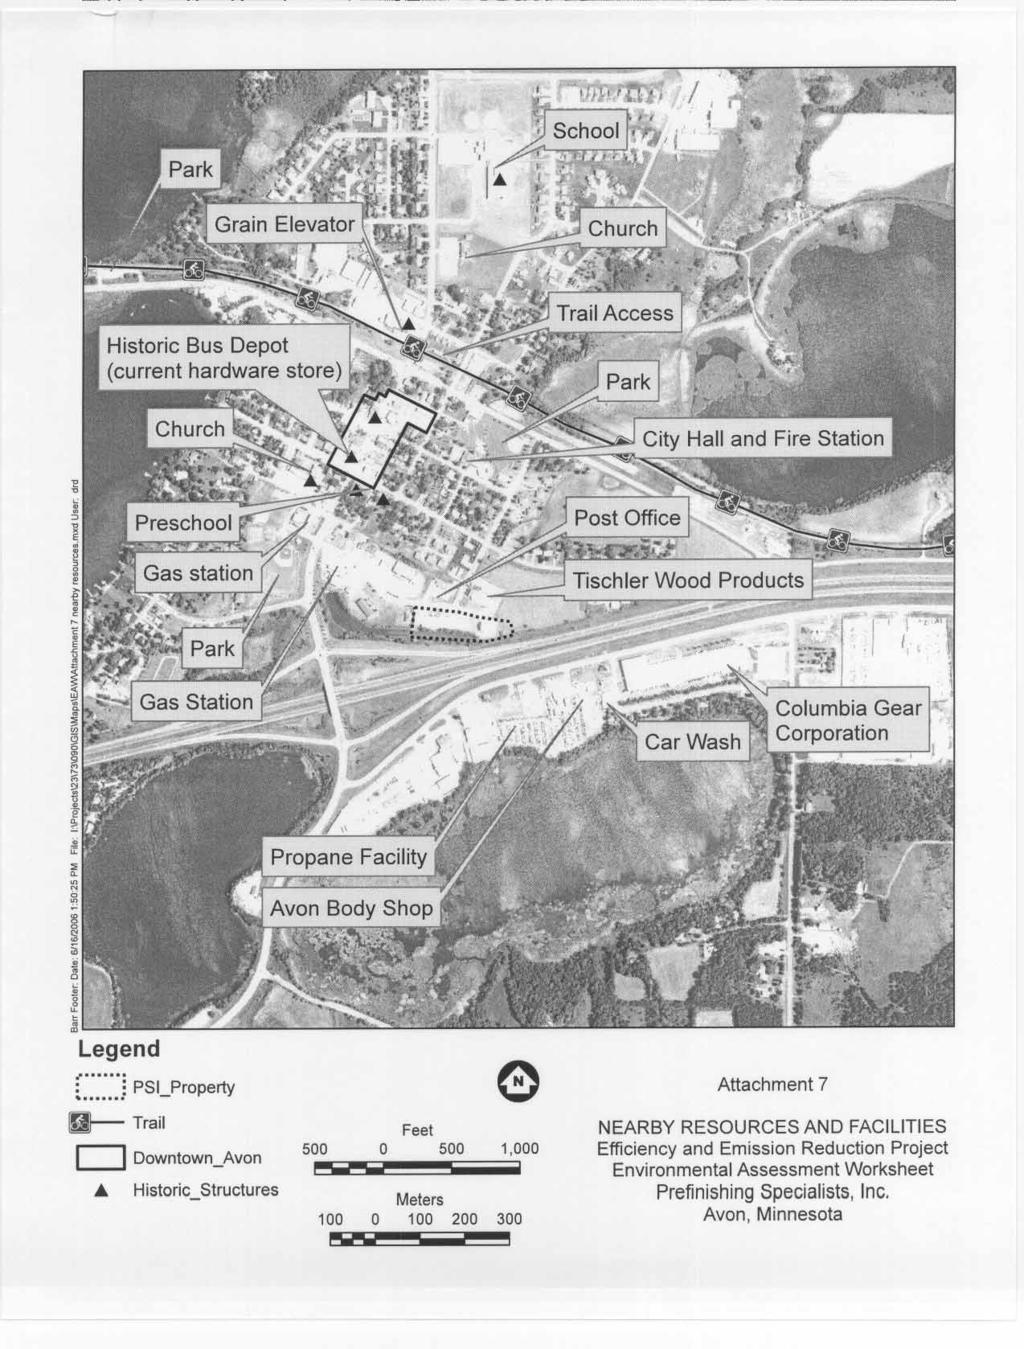
39
40
41
42
43
44
45
46
47
48
49
50
51
52
53
54
55
56 ATTACHMENT 12 MINNESOTA POLLUTION CONTROL AGENCY AIR QUALITY 520 LAFAYETTE ROAD ST. PAUL, MN AERA INTERNAL FORM-02 IMPACT ANALYSIS SUMMARY 1. AQ Facility ID No.: AQ File No.: Facility Name: Pre-finishing Specialists, Inc. 4. Date of Initial Submittal (and major revisions): February 23, 2006, May 11, Date of Risk Manager Meeting: June 5, Project Team Members: Dan Brady, Greg Pratt, John Chikkala, Bill Lynott, Chuck Stroebel (MDH) 7. Assigned Section Manager: Rich Sandberg 8. Standard Industrial Classification (SIC): Summary: a. Facility and Project Description The facility pre-finishes wood doors and millwork and operates spray booths, stain line machines, and one UV coater. The facility will install 2 new UV coating lines and one stain line machine under this permit in addition to the existing unit. This analysis focuses only on the future operations of the facility as permitted. The facility has applied for a permit as a synthetic-minor source and will be limited to 70 tons/yr VOC. b. Site Setting PSI is located immediately north of Interstate 94 in Avon, Minnesota in Stearns County. The facility is located across the street from the city s post office and in close proximity to several homes, businesses, parks, and a school. c. Emissions Summary The AERA assessed emissions based on a limited potential to emit or an amount of annual emissions that the Company will be restricting itself to via permit conditions. VOC emission estimates are based on a mass balance, assuming all of the VOC content in materials used is emitted to the atmosphere. Waste credit for material re-captured and not emitted is included in the permit. Hourly emission rates were based on a production trial in which all emission units operated at full capacity for an eight hour period with an additional 20% of materials used added to the calculations in the analysis. d. Dispersion Summary The company used AERMOD, a refined dispersion model and used high-firsthigh modeling values as per the AERA guidance. Maximum modeled concentrations are expected to the north of the facility on the public road and to the east in the parking lot of the post office. Page 1 of 10
57 MINNESOTA POLLUTION CONTROL AGENCY AIR QUALITY 520 LAFAYETTE ROAD ST. PAUL, MN AERA INTERNAL FORM-02 IMPACT ANALYSIS SUMMARY e. Risk Summary The acute exposure scenario shows a hazard index of 0.8 with approximately 37% of the VOC mass assessed. The risk driver for the acute exposure scenario is isopropyl alcohol with a hazard quotient of Indirect pathways were not assessed in this AERA. The MPCA and MDH have received inquiries and citizen concerns with regard to xylene. Xylene is included in the non-cancer assessment of this analysis, however, the results do not indicate xylene as a risk driver. Given the acute hazard index of 0.8 with < 40% of VOC mass assessed, and the proximity of the facility to receptors, staff has concluded that acute exposures to hourly emissions from the facility, without continued mitigation or pollution prevention, could be approaching levels of health concern at locations near the facility, especially for susceptible populations (e.g. asthmatics). f. Other Project Chemicals No additional chemicals apart from those in this AERA were evaluated. Quantitative Summary 10. RASS Results Total Facility a. Before Modification Total Inhalation Screening Hazard Indices and Cancer Risks Air Toxics Screen Total Indirect Pathway Screening Hazard Indices and Cancer Risks Total Multipathway Screening Hazard Indices and Cancer Risks Acute [1] Subchronic Noncancer [1] Chronic Noncancer [1] Cancer [2] Farmer Noncancer [1] Farmer Cancer [2] Resident Noncancer [1] Resident Cancer [2] Farmer Noncancer [1] Farmer Cancer [2] Resident Noncancer [1] Resident Cancer [2] Note: Risk Managers decided (March 6, 2006) not to require this facility to assess emissions and risk prior to the addition of new equipment. Only the post-modification scenario is considered in this AERA. b. After Modification Total Inhalation Screening Hazard Indices and Cancer Risks Air Toxics Screen Total Indirect Pathway Screening Hazard Indices and Cancer Risks Total Multipathway Screening Hazard Indices and Cancer Risks Acute [1] Subchronic Noncancer [1] Chronic Noncancer [1] Cancer [2] Farmer Noncancer [1] Farmer Cancer [2] Resident Noncancer [1] Resident Cancer [2] Farmer Noncancer [1] Farmer Cancer [2] Resident Non cancer [1] Resident Cancer [2] Page 2 of 10
58 MINNESOTA POLLUTION CONTROL AGENCY AIR QUALITY 520 LAFAYETTE ROAD ST. PAUL, MN AERA INTERNAL FORM-02 IMPACT ANALYSIS SUMMARY E E E-09 [1] Threshold or acceptable level for acute, subchronic and chronic noncancer hazard indices is 1.0 [2] Threshold or acceptable level for cancer risk is 1.0E-05. Note: The acute hazard index of 0.8 should be evaluated in the context of available qualitative information, including the percent of mass of pollutants assessed in the RASS; the likelihood that the emissions estimates, air modeling, and/or toxicity values overestimate or underestimate risks; and the potential for impacts to nearby receptors, including susceptible populations (e.g., asthmatics, children). A hazard index of 1.0 is not a hard line but rather a guideline to identify the point at which further evaluation is needed. The approximation is much broader and should not be seen strictly as a pass/fail exercise. Mass and Percent Mass Assessed in each RASS Analysis Scenario Description All chemicals included in RASS Optional 2 Mass HAPS % HAPS Mass VOC % VOC (tons per year) (tons per year) 8.5 tpy limited ~100% 70 tpy 37% 11. For each exposure pathway below, list the risk drivers and their percent contribution to the hazard indices or cancer risks. A chemical is considered a risk driver if it s individual hazard quotient is 0.1 a. Inhalation Exposure Pathway Chemical HQ/cancer % Exposure Duration risk contribution Isopropyl Alcohol % Acute Comments b. Indirect Exposure Pathway Chemical HQ/cancer risk % contribution Exposure Comments This pathway was not assessed due to the relatively small amount of PBTs emitted from this facility. c. Total Risks Chemical HQ/cancer risk % contribution Exposure Isopropyl Alcohol % Acute Comments 2 Less than half of the mass of VOC emitted has been assessed. Several chemicals that will potentially be emitted could not be assessed due to a lack of inhalation health benchmarks. See item 21 below. Page 3 of 10
59 MINNESOTA POLLUTION CONTROL AGENCY AIR QUALITY 520 LAFAYETTE ROAD ST. PAUL, MN AERA INTERNAL FORM-02 IMPACT ANALYSIS SUMMARY d. Were surrogate inhalation health benchmarks used for risk drivers? Which ones and what further analysis might better inform the risks? No surrogates were used for risk drivers. 12. Are the criteria pollutants compared to the AAQS using high first high modeled concentrations (rather than the regulatory standard)? If not, what was used? This table shows the AERA-modeled ratios of criteria pollutant concentrations divided by their respective AAQS. High-first-high modeled concentrations were used. The results show that for these criteria pollutants, no pollutants resulted in a value greater than 0.5 (for total facility). While this is simply an approximation for assessing compliance with the standard, it provides a rough measure of the extent to which the emitted criteria pollutant concentrations may be elevated by the facility. Criteria Pollutant Screen Chemical Fraction of 1-hr std Fraction of 3-hr std Fraction of 24-hr std Fraction of qtrly std Fraction of annual std SO PM PM NOx CO Pb Qualitative Evaluation Exposure Setting 13. Describe multimedia issues that may be relevant to this facility. No multimedia issues were assessed in this AERA due to the nature of the chemicals emitted. 14. Describe current or future exposure based on zoning and land use information. See attached maps. The area immediately surrounding the facility consists of homes, a post office and other businesses and is currently designated as municipality according to the zoning map submitted with the AERA. There is an open lot east of the building that was considered for receptor location in modeling. Highway 94 passes immediately to the south of the facility. 15. Describe the types of sensitive receptors within 1.5 kilometers from the facility. Within a 1.5 km radius of the facility is a pre-school, an elementary school, Avon Medical Clinic, and multiple doctors offices. The nearest resident is 80 meters from the facility. In addition, sensitive subpopulations (e.g. asthmatics or people with other respiratory conditions) could be exposed near the facility. Page 4 of 10
60 MINNESOTA POLLUTION CONTROL AGENCY AIR QUALITY 520 LAFAYETTE ROAD ST. PAUL, MN AERA INTERNAL FORM-02 IMPACT ANALYSIS SUMMARY 16. Summarize evidence that land in the area of impact will or will not be used for agriculture. Describe agricultural setting. The area surrounding the facility is predominantly light residential and commercial property. There are no farmsteads in the immediate vicinity. 17. If PBTs are emitted, list and describe fishable water bodies within appropriate radius from facility/property boundary. This pathway was not assessed due to the relatively small amount of PBTs emitted from this facility. 18. What other permitted facilities that have air emissions are located within a 1.5 kilometer radius of the facility? Tischler Wood Products Registration Option B Avon Body Shop Registration Option B Columbia Gear Corp. - Option D Registration permit 19. Describe general statewide monitoring data and how it relates to the chemicals emitted at this facility. If monitor is within vicinity, provide data. The MPCA will be taking a limited number of air samples near the elementary school approximately one kilometer north of the facility. This monitoring will be done to characterize constituents in the ambient air at the school in response to a specific legislative request and will not be designed to determine any potential contribution from PSI. Therefore, this monitoring data will not answer health questions raised by concerned citizens about exposures near the facility (e.g. post office). At the time of this summary, the sampling and monitoring had not been completed. ADDITIONAL INFORMATION 20. Missing chemicals or sources: Note: We assume a reasonable effort was made to find chemicals and sources. We are not claiming that we know what all of the chemicals are at the facility. a. Are there any potentially missing sources from the emission list not included in the RASS workbook? There are no additional sources that the MPCA is currently aware of. b. Is there information suggesting additional chemicals are emitted (e.g., based on experience at similar facilities)? There are no additional chemicals emitted that the MPCA is currently aware of. 21. List chemicals emitted but lacking inhalation health benchmarks Benzenedicarboxylic acid D1-C8-10- Branched alkyl esters 1-Propoxy-2-propanol Acetone Amyl Acetate Butyl Acetate Butyl Alcohol Carbon Black Dibutyl Phthalate Ethyl 3-ethoxypropionate Page 5 of 10
61 MINNESOTA POLLUTION CONTROL AGENCY AIR QUALITY 520 LAFAYETTE ROAD ST. PAUL, MN AERA INTERNAL FORM-02 IMPACT ANALYSIS SUMMARY Ethyl Acetate Ethyl Alcohol Isobutyl Acetate Isobutyl Alcohol Methyl N-Propyl Ketone N-Propyl Acetate n-butyl alcohol iso-butyl acetate manganese dioxide naptha, VM&P Stoddard Solvent isoparaffinic petroleum distillate aliphatic, light hydrocarbon solvent Propylene Glycol Monomethyl ether acetate Propylene Glycol Monomethyl ether 2-Propoxyethanol (glycol ether) Nitrocellulose Methyl Ethyl Ketoxime Isobutyl isobutyrate = not used since June 2005 but may be used in future production. 22. List known respiratory sensitizers emitted. No known respiratory sensitizers are emitted. 23. List developmental toxicants emitted. Ethyl benzene is emitted at a level below ceiling values. 24. Where is the maximum modeled concentration (risk) for acute? Chronic? Points of maximum modeled concentration were located north and east of the facility, beyond the property boundary in areas accessible to and used by the public. It should be recognized that the Gaussian plume model (AERMOD) used in this analysis is not designed to make predictions that are matched in space and time with measured concentrations. Rather the model is best at predicting the high-end concentrations that will occur within the model domain at some point in time. This means that the precise location of the estimated concentrations is not known but instead the model predicted high concentrations are likely to occur at some point in time at a similar distance from the source as indicted by the model predictions. 25. Accidental Release information (Incident Management System data on facility reports of SSM events from the last 5 years). Additional information as relevant. Since the company uses a mass balance method for calculating VOC emissions, all materials purchased are assumed to exit via the stack. Accidental releases are not easily quantifiable using this methodology. The company s history of hazardous waste violations, however, includes an enforcement action for a dumpster fire caused by illegal disposal of hazardous waste paint booth filters in Internal Combustion Engines. (AERA-04 Certification for Emergency Internal Combustion Engines) No internal combustion engines or emergency generators will be used at the facility. Page 6 of 10
62 MINNESOTA POLLUTION CONTROL AGENCY AIR QUALITY 520 LAFAYETTE ROAD ST. PAUL, MN AERA INTERNAL FORM-02 IMPACT ANALYSIS SUMMARY 27. Describe known community concerns as they relate to health risks associated with this facility. The MPCA and MDH have received numerous phone calls and s registering complaints related to odors and health effects that citizens believe to be attributable to this facility. The health effects cited by complainants include headaches, nausea, respiratory irritation, cancer and asthma. The MPCA also received a citizen petition dated January 16, 2006 requesting an EAW for this facility. Concerned citizens in Avon requested that the Minnesota Department of Health (MDH) conduct a preliminary evaluation of cancer rates in Avon (zip code 56310) between 1988 and Although these cancer rates are not useful in determining health effects from this particular point source of pollution, the data are readily available and so were provided to community members given their request. MDH's evaluation noted that three cancers were elevated and one was less than expected. No pattern in the elevated cancers indicated or suggested a cause for these elevations except for the elevation of prostate cancer which is highly dependent upon regional medical screening practices. MDH is available for consultation, upon request, regarding MN cancer surveillance data and MDH's preliminary evaluation of cancer rates in Avon. 28. Additional Considerations: Chromium and Manganese compounds are the only chemicals listed as PBTs and do not comprise a major portion of the emissions. Since a relatively limited amount of PBTs are emitted, a fish pathway analysis was not required as part of this AERA. In a qualitative comparison performed by the company s consultant, modeled ambient air concentrations for the chemicals not presently assessed in the RASS were below occupational health benchmarks that are available in the literature. The MPCA and MDH do not typically endorse using occupational values when assessing potential risk to the general public. 29. These topics (from Additional Information section) weren t considered applicable for this facility: Mercury Analysis the small amount of mercury that is reported in the AERA is from natural gas combustion and is not considered in the risk analysis. Impact Analysis Summary 30. How close are the emission estimates to what the facility will actually emit? What are the factors that impact this? Emissions input to the RASS were based on 70 tons/yr for the chronic exposure assessment. PSI will also be accepting hourly limits (lbsvoc/hr) on each individual emission unit. The tons/yr and lb/hr emission rates are not linearly related due to episodic variability in operating rates. In the RASS, they report a maximum hourly operating rate much higher than the operating limit of 70 tons/yr that they ve accepted as a permit condition. The higher maximum hourly rate can still be attained for short periods of time so the hourly emission Page 7 of 10
63 MINNESOTA POLLUTION CONTROL AGENCY AIR QUALITY 520 LAFAYETTE ROAD ST. PAUL, MN AERA INTERNAL FORM-02 IMPACT ANALYSIS SUMMARY rates (and thereby the acute HI) reported in the AERA could be achieved on a short-term basis (i.e. if the facility exceeds routine operating conditions in order to meet quantity or quality of customer demands). The company calculates emissions on a mass balance basis, assuming all VOC content of materials used is eventually emitted. Hourly emission rates were based on a production trial in which all emission units operated at full capacity for an eight hour period. The proposer added a margin of safety of approximately 20% of materials used to the hourly emissions calculations in the analysis. This will not result in a significant overestimation of risk, if operations are variable on an hourly basis and maximum capacity on all units could be reached for short periods of time. 31. How accurate is the dispersion model to the actual site dispersion? What are the factors impacting the accuracy? Dispersion modeling used the high-first-high value, which is based on meteorological conditions that occurred once in five years. This is in keeping with the AERA guidance and is likely to overestimate risk to some degree. The same type of meteorological conditions that gave rise to the high concentration could occur any time. The Gaussian model (AERMOD) is not designed to predict concentrations that correspond with time- and spacematched observations. Rather the model is designed to be able to say that the predicted concentration can occur somewhere in the model domain at some time in a 5-year period. 32. What is the impact of the toxicity values on the risk analysis? What are the factors impacting the analysis? Lack of health benchmarks for more than half of the VOC mass is a limiting factor in this analysis that diminishes the robustness of the AERA and may result in an underestimate of risk. We are unable to predict how much the hazard index or cancer risk would increase with the addition of those chemicals into the assessment. It is worth noting that acetone accounts for an estimated 65 tons per year, a significant portion of facility emissions. Acetone is not classified as a VOC, however, so it s inclusion into the quantitative analysis would not enhance the percent of VOC assessed. Since it is a significant contributor to overall emissions, it is relevant to point out that acetone is generally associated with low toxicity and there is no data indicating carcinogenicity. Reductions in the amount of chemicals that were quantitatively assessed and/or identified as a risk driver will lower the acute hazard index. However, the potential for health risk is not only a function of the hazard index but also dispersion characteristics of emissions and the location of the facility. Proximity to receptors is one qualitative consideration in all AERAs that requires special consideration any time a hazard index or cancer risk is around 1.0 (slightly above or slightly below). Page 8 of 10
64 MINNESOTA POLLUTION CONTROL AGENCY AIR QUALITY 520 LAFAYETTE ROAD ST. PAUL, MN AERA INTERNAL FORM-02 IMPACT ANALYSIS SUMMARY Staff Conclusions and Recommendations MDH Coordination: MDH staff were involved in this analysis and provided input throughout the process. Their comments are incorporated in this document. Staff team recommendations: Given the acute hazard index of 0.8 with 37 percent of VOC mass assessed in the RASS, the proximity of the facility in relation to receptors, and the level of community concern about potential health effects from air emissions, the AERA team recommends that PSI develop a specific schedule for phased implementation of pollution prevention measures (e.g. continued product substitution, other process improvements or other emission reduction strategies) to reduce air emissions, which was identified as an economically feasible option in the pollution control evaluation performed by Barr Engineering, in order to maintain a demonstrable reduction in health risk. This schedule may be developed in consultation with MPCA, MDH, MnTAP, and the community, and compliance with this schedule monitored as a permit condition. Page 9 of 10

65 MINNESOTA POLLUTION CONTROL AGENCY AIR QUALITY 520 LAFAYETTE ROAD ST. PAUL, MN AERA INTERNAL FORM-02 IMPACT ANALYSIS SUMMARY Page 10 of 10

66
67