Trends and Perspectives of Ecological Risk Assessments for Dioxin-Like Compounds in the Great Lakes Basin. Wisla, Poland
|
|
|
- Loraine Parsons
- 5 years ago
- Views:
Transcription
1 Trends and Perspectives of Ecological Risk Assessments for Dioxin-Like Compounds in the Great Lakes Basin Efficacy of Predicted vs. Measured Exposure and Effects Assessments International Conference on Ecotoxicology Trends and Perspectives September Wisla, Poland


2 Matthew Zwiernik Ph.D. Professor Zoology/Vet Med. Dept. Zoology/ National Food Safety and Toxicology Michigan State University


3 John P. Giesy Canada Research Chair in Environmental Toxicology Department of Biomedical Veterinary Sciences Toxicology Centre, University of Saskatchewan Distinguished Professor Department of Zoology National Food Safety and Toxicology Center Michigan State University Chair Professor at Large Dept. Biology and Chemistry City University of Hong Kong Concurrent Professor School of the Environment Nanjing University
4 Objectives of presentation Present historical, geographical, and ecological background of Great Lakes Basin Discuss risk assessment as a decision making tool Describe the site-specific multiple lines of evidence approach Compare the goals and outcomes of the site-specific approach to ERA s completed for the same locations 4
5 Tittabawassee River Kalamazoo River Historical Impacts Characteristics of the Great Lakes Basin 1800 s The lakes Lumbering, contain about Agriculture, 23,000 Mining, km 3 of Over water fishing 1900 s Covers Industrial a total area wastes, of 244,000 inorganic km 2 fertilizers, pesticides 1962 The Great Rachel Lakes Carson are the published largest Silent system Spring of fresh, surface water on 1970 s earth, containing Aquatic and roughly wildlife species 18 percent have of been the intensively world supply studied, and Outflows from the Great Lakes are relatively small (less than 1 tumors in fish are well documented percent per year) adverse effects such as cross-bills and egg-shell thinning in birds, and
6 Ecological Risk The likelihood that adverse ecological effects may occur or are occurring as a result of exposure to one or more stressors United States Environmental Protection Agency 6
7 A Risk Assessment Provides: Clear and consistent risk characterization of valued endpoints Systematic means of quantifying, comparing and prioritizing risks (and solutions) Basis for risk-benefit and risk management and sustainable development decisions 7
8 Planning USEPA ERA Framework DATA GATHERING Laboratory toxicological studies Extrapolation methods Measurements of exposure and dose Epidemiology and population-level studies Research needs identified RISK ASSESSMENT Problem Formulation and Hazard Identification Effect charactertization ANALYSIS Risk Characterization Exposure characterization Regulatory decision RISK MANAGEMENT Development of regulatory options Identification of mitigation options Evaluation of public health, environmental, economic, social, and political consequences of regulatory options Risk communication


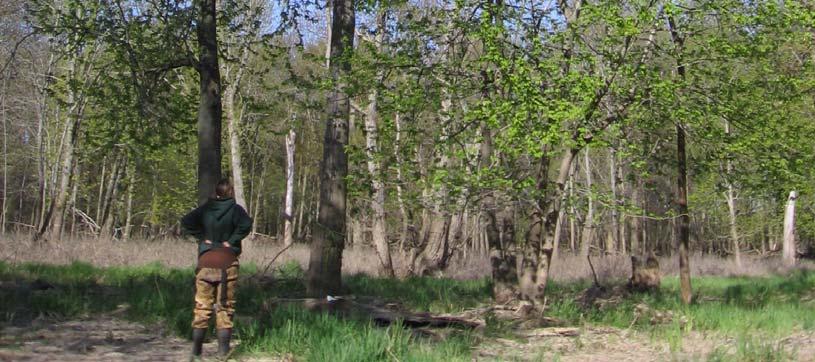
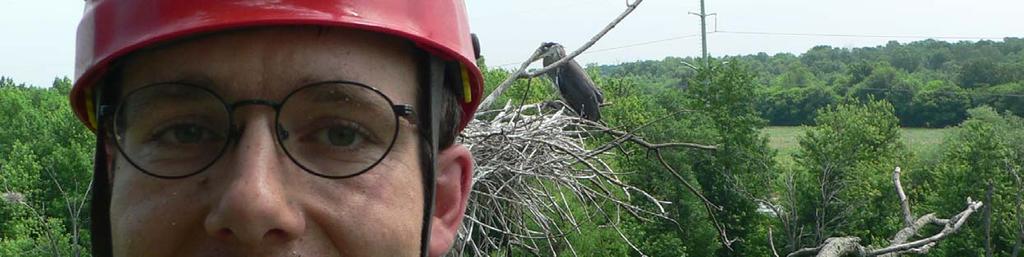
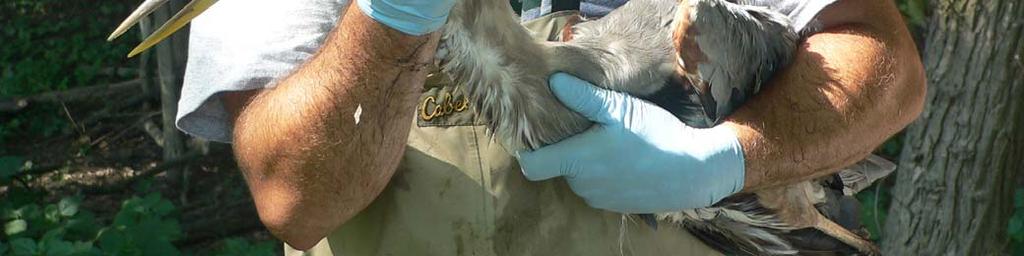
9 Field Studies in Support of a Baseline ERA Dr. Matthew Zwiernik Dr. John Giesy Jeremy Moore Dusty Tazelaar Tim Fredricks Sarah Coefield Rita Seston Mike Fales Lori Williams David Hamman Emily Koppel Melissa Palmer Aquatic Toxicology Laboratory Michigan State University 9
10 The MSU-ATL Approach Answer the question of ecological risk directly with site-specific data Select surrogate or sentinel species when possible Utilize multiple lines of evidence Conduct the process in an open and transparent manner Involve stakeholders and utilize local assets 10
11 Conceptual Site Model Raptor Heron Passerine birds Invertebrates Small mammals Soil Muskrat Kingfisher Benthic invertebrates Forage fish Mink Sediment 11
12 Exposure Pathways Conceptual Site Model Mink Great horned owl Small mammals Fish Crayfish Frogs Muskrats Swallows Small mammals American robin Terrestrial insects Aquatic vegetation Benthic insects Aquatic emergent insects Terrestrial insects Soils Sediments Soils 12


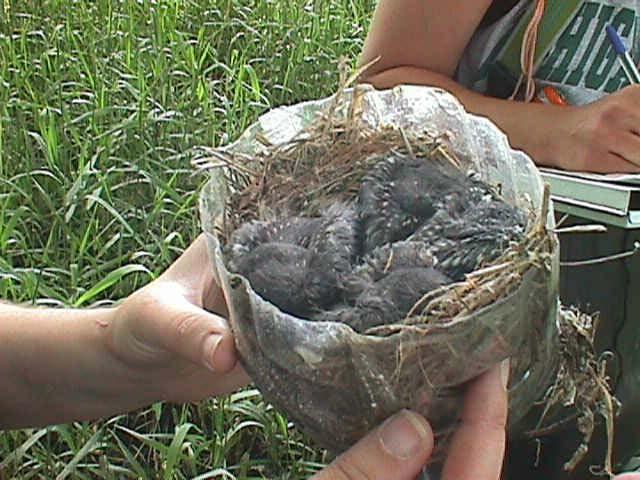


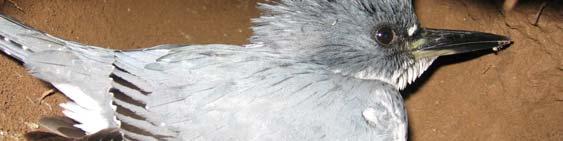

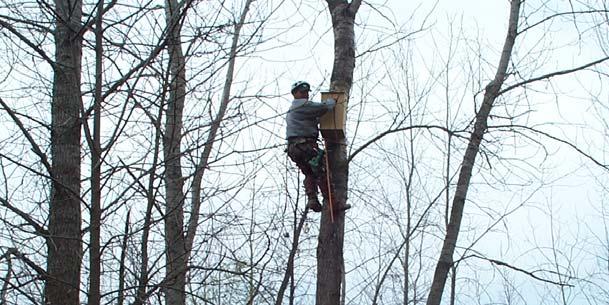


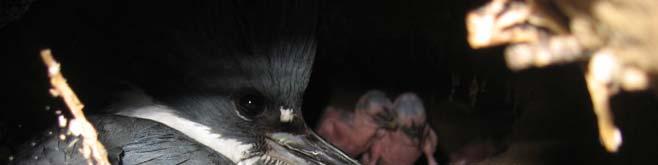
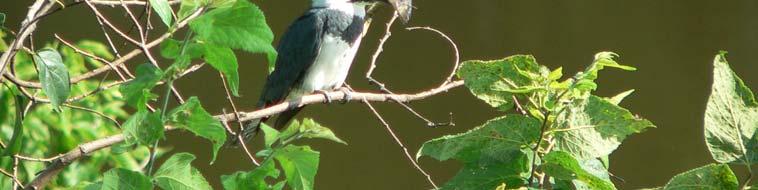
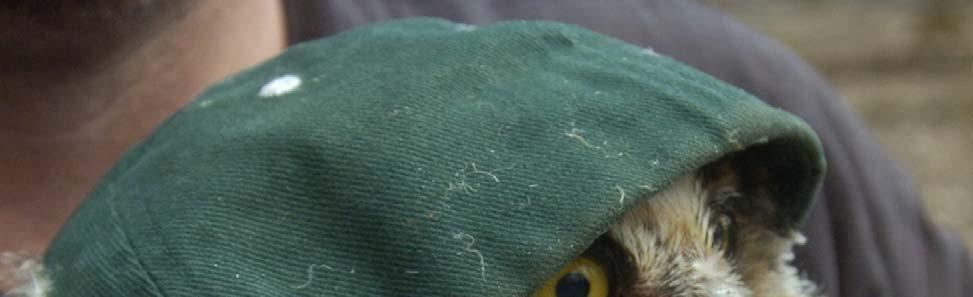
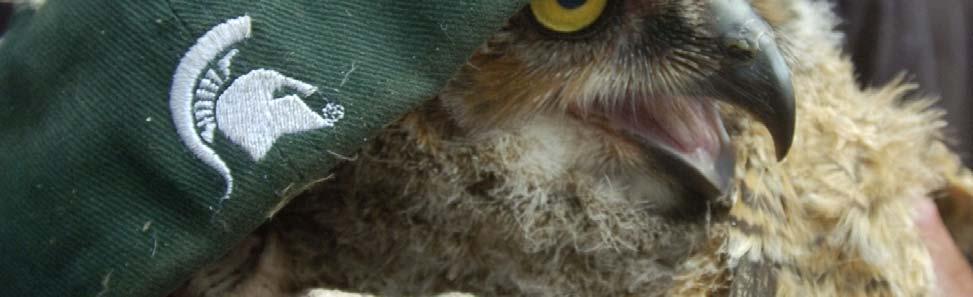
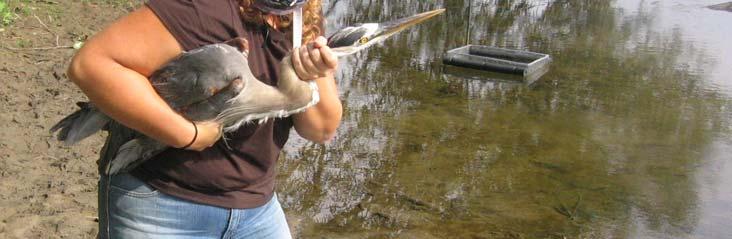
13 Tittabawassee River Ecological Studies Song birds Fish eating birds Raptors Migratory waterfowl Mink 13


14 Multiple lines of evidence Dietary exposure assessment Tissue based exposure assessment Exposure X Effects = RISK Population Health and Sustainability Exposure Toxicity Laboratory Dose response Population health measurements Risk to Population Health 14
15 Uncertainty vs. Data More Uncertainty Protective More Certainty Predictive Assumptions Data 15


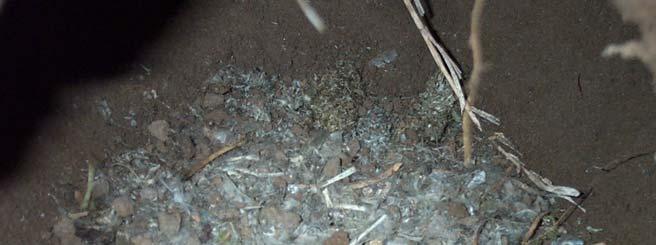
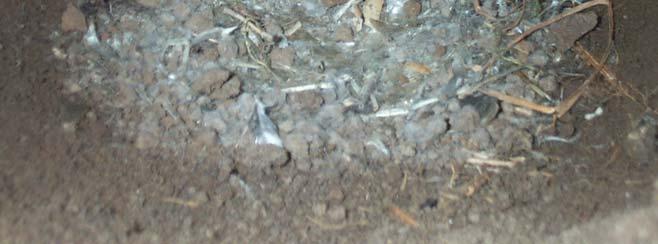
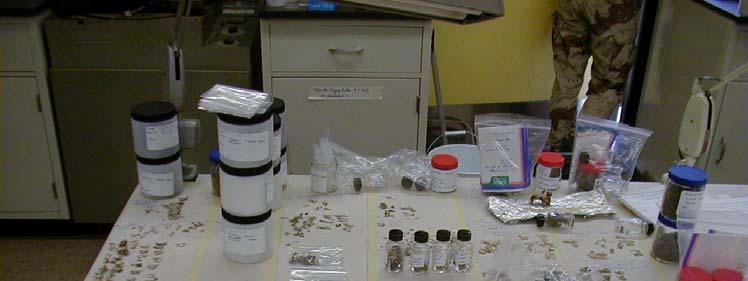
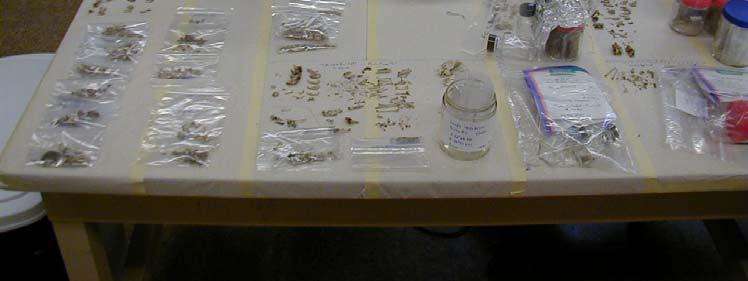


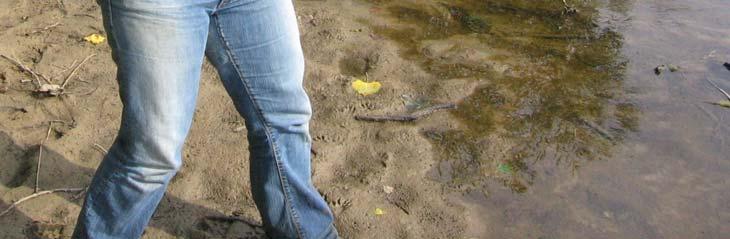
16 Stomach content Scat analysis Prey Remains Visual Observations Dietary exposure 16

17 Dietary exposure Tittabawassee River Mink 9% 4% 8% Tittabawassee River Kingfisher 5% 13% 52% 19% 8% Fish Crayfish Muskrat Small Mammals Amphibians Vegetation 82% Fish Crayfish Amphibians 17


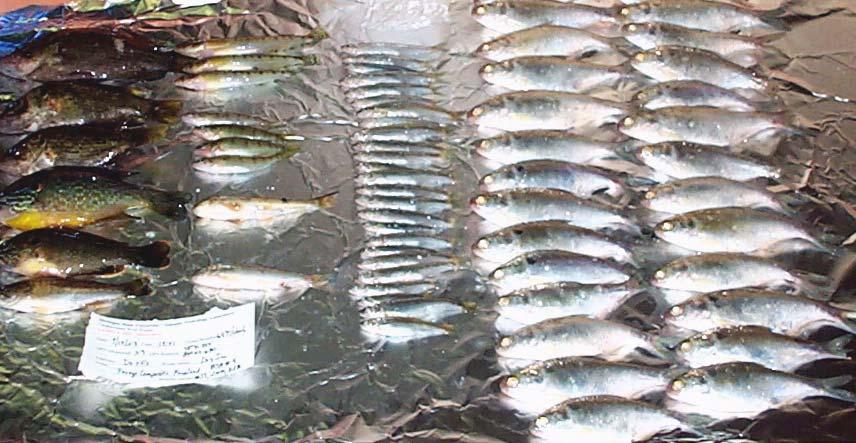


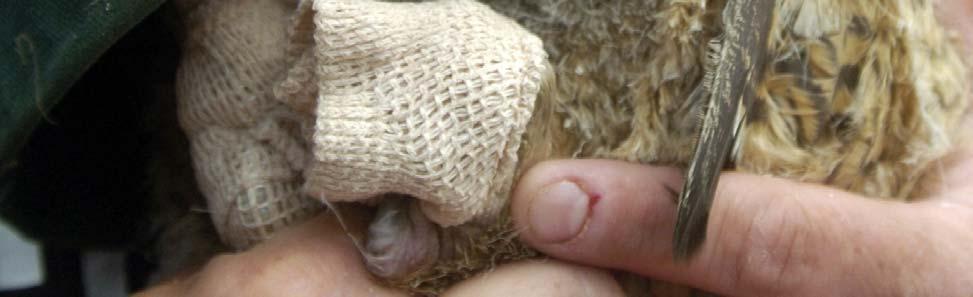
18 Sampling Dietary Items 18
19 Dietary exposure Prey item 95% UCL TEQ WHO-mammalian conc. (ng/kg) Reference Target Sediment Forage fish Muskrat Crayfish Small mammals Vegetation Amphibian
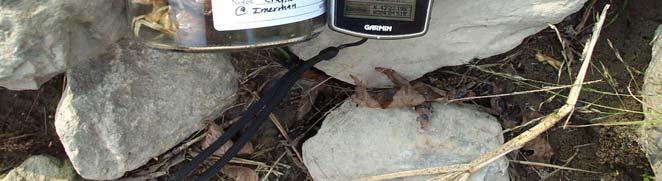
20 Dietary exposure for Mink LOAEL to NOAEL HQ of 95% UCL Dietary Exposure 4.5 Hazard Quotient Tittabawassee River 0 Sanford Smith s Crossing Tittabawassee Twp. Park Freeland Festival Park Imerman Park 20


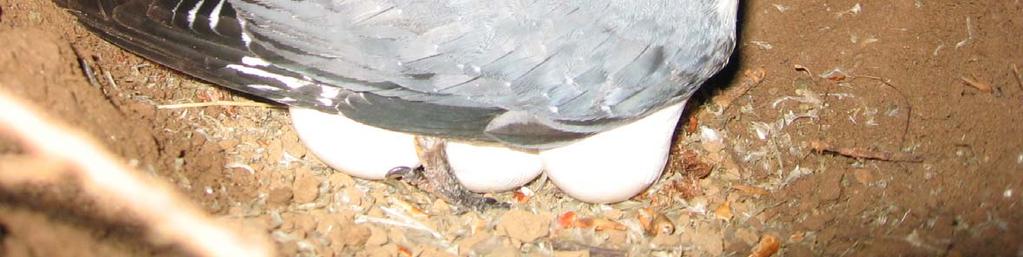
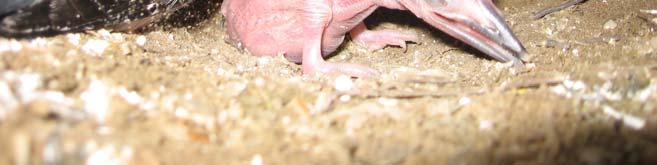
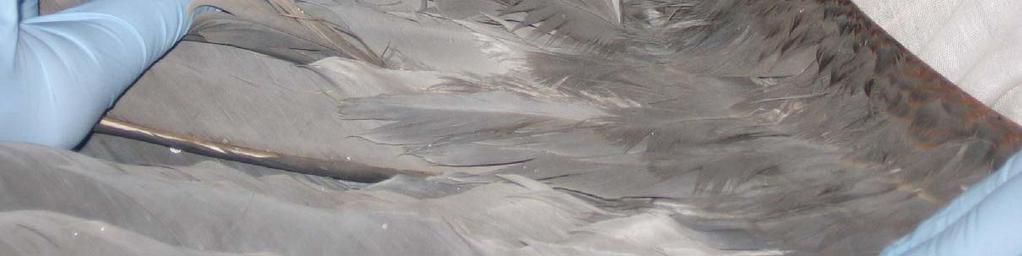
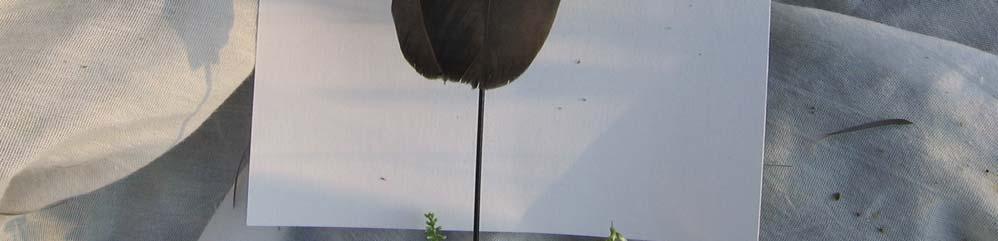
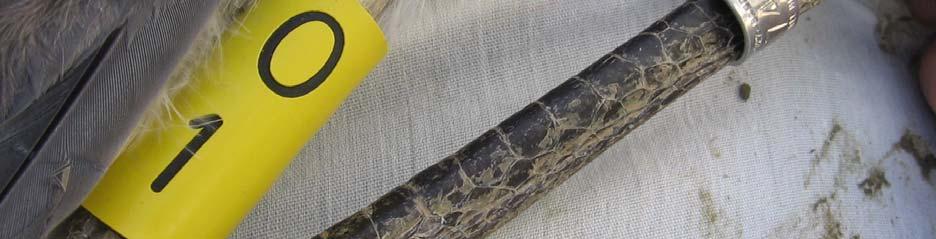
21 Tissue Based Exposure Eggs 21


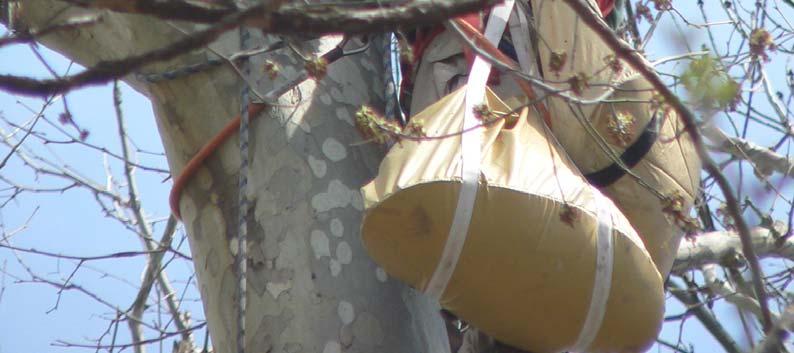


22 Tissue Based Exposure Eggs Plasma 22


23 Tissue Based Exposure Eggs Plasma 23


24 Tissue Based Exposure Eggs Plasma 24


25 Tissue Based Exposure Eggs Plasma 25


26 Tissue Based Exposure Eggs Plasma 26


27 Tissue Based Exposure Eggs Plasma 27


28 Tissue Based Exposure Eggs Plasma 28


29 Tissue Based Exposure Eggs Plasma 29


30 Tissue Based Exposure Eggs Plasma 30


31 Tissue Based Exposure Eggs Plasma 31


32 Tissue Based Exposure Eggs Plasma 32


33 Tissue Based Exposure Eggs Plasma Tissues 33
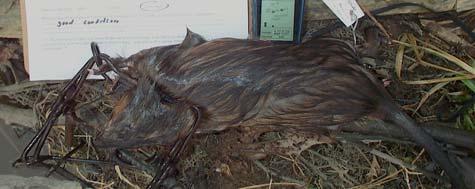
34 Mink liver TEQ WHO-mammalian (ng/kg) Sanford Chippewa Nature Center Tittabawassee Upstream Smiths Crossing Tittabawassee Township Park Freeland Festival Park Imerman Park Tissue Based Exposure Mink
35 Exposure Assessment Comparison Mink Liver and Dietary HQs (TEQ) HQ Dietary Based HQs Liver Based HQs
 56.3 cm 2.7 cm 57.5 cm 3.0 cm Body Length (Female) 18.7 1.16 19.6 0.23 Age (Male) 1.8 yrs 0.8 yrs 2.")
 Population Health Mink 1.4 1.3 1.8 1.")
36 Mink Morphological Data Reference N=20 Target N=14 Mean SD Mean SD Body Weight (Male) 872 g 139 g 917 g 175 g Body Weight (Female) 482 g 78.9 g 517 g 16.2 g Body Length (Male) 56.3 cm 2.7 cm 57.5 cm 3.0 cm Body Length (Female) Age (Male) 1.8 yrs 0.8 yrs 2.2 yrs 1.1 yrs Age (Female) 2.3 yrs 0.7 yrs 2.7 yrs 0.9 yrs Liver Weight (Male) 51.3 g 10.8 g 51.7 g 14.2 g Liver Weight (Female) 26.4 g 2.23 g 28.7 g 3.87 g Nutritional Status (3=excellent, 1=poor) Population Health Mink No significant difference between sites at (p=0.05) 36
37 Population Health Mink Additional Parameters Brain weight Liver wt. to brain wt. ratio Baculum length Male to female ratio Placental scars Histology Liver Kidney Brain Jaw No significant difference between sites at p=


38 Population Health Mink Habitat Suitability and Abundance Habitat Suitability 100% = Excellent 0% = Poor Pine River Chippewa River Tittabawassee River 70% 59% 51% # Mink / km Study areas have appropriate habitat and support mink year round 38
39 Goal: To provide decision makers with the information necessary to make informed decisions 39

40
41 Dietary exposure of the Red Fox and American Robin on the Kalamazoo River Plant PCB Concentration in mg/kg Plant PCB Concentration in mg/kg Predicted Measured 0 Measured 41


42 Red Fox and American Robin Exposure on Kalamazoo River Origin of Plant Tissue PCB Concentration Red Fox HQ Robin HQ Predicted Re-predicted Site specific Hazard quotient (HQ) decreases with use of site-specific information the greatest change was due to reductions in uncertainity 42
43 Tittabawassee River Modeled vs. Measured: TEQs (ng/kg, ww) predicted invertebrates measured terrestrial invertebrates measured earthworms 43
44 Modeled vs. Measured: 100 fold decrease TEQs (ng/kg, ww) predicted small mammals measured small mammals 44


45 Mink dietary exposure on the Tittabawassee River Mink hazard quotient (HQ) decreases with use of site-specific information Diet Toxicity Reference Value HQ Assumed - 100% fish 1ng/kg 78 Site specific - 52% fish, 19% muskrat, 9% vegetation, 8% crayfish, 8% small mammal, 4% amphibian Site specific 1 ng/kg ng/kg
46 Uncertainty vs. Data More Uncertainty Protective More Certainty Predictive Assumptions Data Population Health Threshold 46
47 Summary Wildlife are key indicators of ecological health Wildlife integrate stressor exposure and accumulation over time and space (bioavailability) The selection of surrogate or sentinel species can streamline the process Site-specific, multi-year, multi-line of evidence studies effectively reduce uncertainties 47
48 Summary ERAs move from protective to predictive as uncertainty is reduced Ecological risk assessments provide for a systematic means of quantifying, comparing and prioritizing risks, solutions Ecological risk assessments can be effective tools for risk-benefit, cost-benefit and sustainable development decisions


49 Thank You Questions?