Air Quality Forecasting from Global to Urban Scale. Guy P. Brasseur Max Planck Institute for Meteorology Hamburg, Germany
|
|
|
- Roland Cannon
- 5 years ago
- Views:
Transcription

1 Air Quality Forecasting from Global to Urban Scale Guy P. Brasseur Max Planck Institute for Meteorology Hamburg, Germany
2 Introduction Many urban areas in the developing world (Asia, Africa, South America) have become adversely affected by air pollution. A large number of citizen die prematurely from high concentrations of air pollutants (PM, ozone, etc). The problem is particularly acute in the developing world, but remains a concern in several regions of Europe and North America.


3 The industrial revolution and air pollution Pittsburgh in the 1940s Make great efforts to build China into a strong and prosperous industrialized country under the leadership of the Party and chairman Mao! From Daniel Jacob


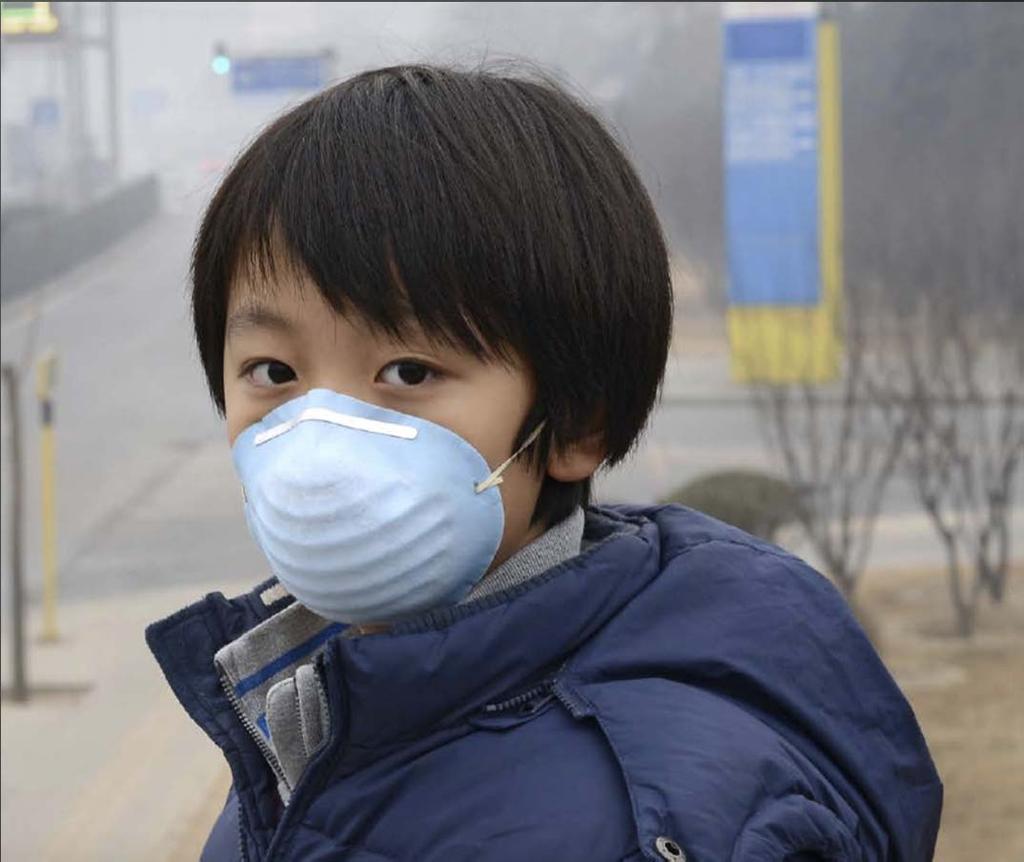
4 People are directly affected by air pollution


5 Monitoring, Analysis and Prediction of Air Quality MAP AQ Inspired by Users Driven by Science A platform for facilitating global cooperation
6 Overarching goal of MAP AQ To develop a consortium of expert groups to coordinate and enhance research and services that will help mitigate air pollution, specifically in regions of the world where high concentrations of pollutants are observed. To develop and implement a global air pollution monitoring, analysis and prediction system with downscaling capability in regions of the world that are affected by high levels of atmospheric pollutants. MAP AQ is not a program, but a framework for developing projects.
7 Overarching goal of MAP AQ To combine an ensemble of state of the art multi scale chemical transport models, highresolution emission inventories, space observations and surface measurements to provide near real time forecasts and analyses of air pollution and its effects at the global to regional and local scales.
8 Overarching goal of MAP AQ To co develop with users and other stakeholders relevant products and services, and transfer air quality related information to the public. To create collaborative efforts for the application of the system to urban planning. To develop educational activities as a basis for sustained capacity building. To develop in different regions of a market for the products and services offered by MAP AQ.


9 Data Assimila on Natural and Anthropogenic In situ measurements Space observa ons Surface emissions The Components of the MAP AQ System Meteorological Forecast (temperature, winds, convec on, precipita on, fronts, boundary layer height, etc.) Global and Regional Air Quality Forecast Sub regional and Local Downscaling Concentra on of primary and secondary chemical species incl. PM2.5, PM10, NOx, CO, VOCs, ozone including informa on at the urban scale Uncertainty quan fica on Evalua on of Predic ons Improvement of Forecast Models and Product Innova on Products Concentra ons, AQ indices, deposi on, health impacts, alerts for intense air pollu on, odors, allergenic products, fire smoke, etc. Product Dissemina on Policy and decision making Web, apps, etc.

10 An Example of a Prediction System
11 The Modeling System Ensemble predictions using different chemical/meteorological models. Global models with limited resolution km) (Ex: CAMS) Downscaling with regional models that have zooming capability (10 50 km and 1 to 10 km)

12
13 Top Down vs. Bottom up Emissions Approaches Top-Down (inverse modeling) Use observations/models to infer emissions Up-to-date Provide uncertainties evaluation But: Results are model-dependent Generally one species, how to treat co-emitted species Relies on high quality atmospheric measurements of trace gas and measurements/modeling of the atmosphere mixing and wind characteristics Bottom-Up (inventories) Inventories based on driving data Sector specific/process specific Time specific Regional or global scales But: Uncertainty estimates usually non-existent or low Rarely up-to-date Relies on high quality activity data (routine and non routine), emissions factors, estimates of control effectiveness G. Pétron, 2012 E X = Σ S [EF X,S A S (1 CE X,S )]

14 Components of the MAP AQ System: Data Assimilation of Satellite Observations

15 A Mozaic of Regional Approaches NA EU EU-1 ME ME-1 IA IA-2 NA-1 IA-1 SA WA WA-1 SA-1 SA-2 SA-3 Image from NASA - U.S. Geological Survey
16 The 4 Phases of the MAP AQ Project 1. Global model driving downscaling with an ensemble of regional models 2. Multi scale global models with a single dynamical core including a zooming capability 3. Further downscaling to city scale with a coupled fluid dynamics model that resolves city blocks 4. Consider additional chemicals such as persistent organic compounds, and assess their transport in different components of the earth system.

17 Downscaling to the size of a city block (Fluid dynamics model)
18 Component of MAP AQ: An Operational Data Management Data collected Ground observations Aircraft observations Satellite observations Field campaigns Data Generated Model output Visualization plots Statistics and reports Data policies to be established Data Preservation Data storage Data access Metadata System
19 Communication How would the population of (say) France react if the press announced that a cloud containing a mixture of particles and molecules was approaching the country and was expected to cause the death of about 900 people? The reality is not very different, except that such event occurs every week of the year, and is the cause (in France) of about deaths per year.
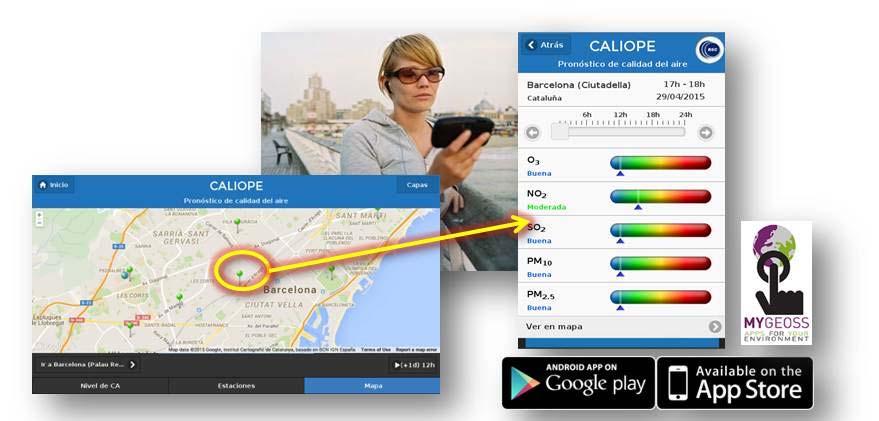

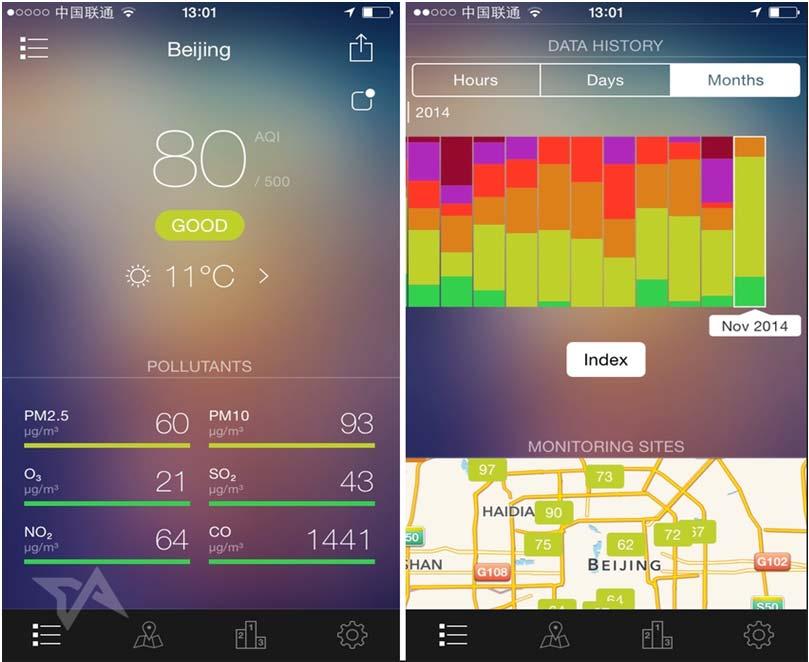

20 Components of the MAP AQ System: Dissemination Platforms
21 Components of the MAP AQ System: Evaluation Platform Unified evaluation procedure will be established to standardize the model evaluation. Classic statistics will be calculated from operational predictions. Specific events will be analyzed in detail. High performance computing will be coupled with Big Data diagnostics/analytics
22 Business Model: Creating the Demand From co design of products to codevelopment of services Air quality forecast should be viewed as a public service with public support It can be complemented by a private/public partnership and close relations with small and medium enterprises
23 Cooperation with International Institutions World Meteorological organization (WMO) GAW, SAG Applications, GURME United Nations Environmental Programme (UNEP) Climate and Clean Air (CCA) Coalition World Health Organization (WHO) World Bank and other investment banks Copernicus Project (CAMS) Global Atmospheric Chemistry Project (IGAC)
24 Examples focusing on China (PANDA and MARCOPOLO Projects)


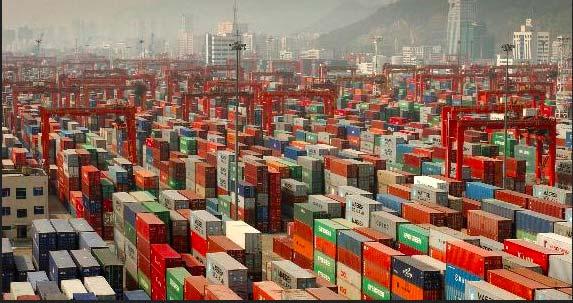
25 Rapid Economic Growth in China
26 Rapid Urbanization in the Pearl River Delta (PRD) USGS MODIS
 Meteo.")
 Chem.")

27 6pm (LT) NCEP GFS Automatic Forecasting System at MPI-M: Operation Steps (DKRZ, Hamburg, Germany) Meteo. Forecasts 10pm (LT) 6h WRF Meteo spinup KNMI 10pm (LT) Chem. BC: ECMWF CAMS Chemical Forecasts 00:00 (LT) 3 days WRF-Chem forecast Dissemination aqicn.org/forecast Chem. IC: Day -1 Forecast HTAPv2 FINN Emissions


28 Clear Clear N PM2.5 N S Beijing N S Haze Ice Fog -3C Sunny 9C NO 2 Beijing Median Values 6 December 2016 O 3 Beijing 7 December December 2016


29 Ozone PM2.5 7 December 2016 PM2.5 Shanghai 8 December December 2016

30 PM2.5 NO2 O3


31 Chemical Weather Forecast Forecast for the period 27 October 2016 at 0.00 h to 29 October at 24:00


32 Forecasting Products by the SMS, Forecasting China products EU Panda Project IAQ I HAZE PM2. 5 O3 CO Dust 3 day forecast (~ 500 sites) O 3 / NO 2 PM 25 Ying Xie SMS Shanghai 32
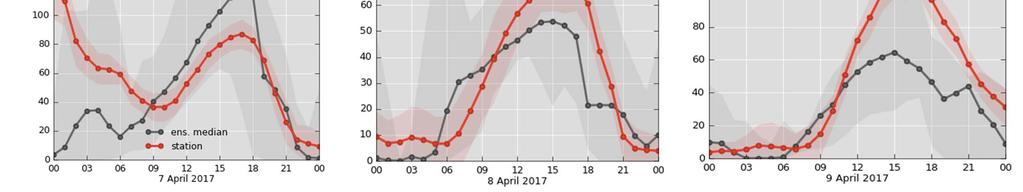
 of the ozone and NO 2")

33 Ozone Beijing Comparison of the mean diurnal mean (April to July 2016) of the ozone and NO 2 concentration calculated by 7 models with the mean observation of the diurnal variation in Beijing NO 2 Beijing
34 Real-Time WRF-Chem/DART Flow Met IC/BC Post Prior Chem IC/BC Update IC/BC WRF- Chem Emiss Obs DART Space Observations Surface Monitoring Data Assimilation Research Testbed Arthur Mizzi NCAR


35 Overarching Research Need: Improve Prediction Capabilities via Incorporating/Integrating Composition, Weather and Climate Monitoring Natural & Human Induced Environmental Change Coupled Environmental Models Atmospheric (Weather) Coupled Computer Modelling Models Air borne Transport Water Cycle Atmospheric Chemistry Land change processes Ecosystems Moderating Influences Impacts Extreme Weather Climate induced Health impacts Toxic, Nuclear & Disease Transport Flooding/Drought...Alerts Water Availability Air Pollution Habitat changes Biodiversity loss Research Adaptation Measures Across Relevant Temporal 35 and Spatial Scales

36 Thank You