OPERATIONAL UPDATE ON INNOVATIVE COOLING TOWER PRETREATMENT TECHNOLOGY
|
|
|
- Preston Brown
- 5 years ago
- Views:
Transcription


1 OPERATIONAL UPDATE ON INNOVATIVE COOLING TOWER PRETREATMENT TECHNOLOGY Presented By: Joel E. Bowdan III, P.E.
2 PRESENTATION OUTLINE: Subject Introduction Amylin Project Background Cooling Tower Basics Typical RW CT Implementation Challenges Alternate Pretreatment Technology Technology Benefits to RW Use
 office/ research building,")

3 AMYLIN PHARMACEUTICALS BACKGROUND Located in SD Golden Triangle Specializing in diabetes research and medicines production 104,000 ft 2 (9,662 m 2 ) office/ research building, reflecting pond, and irrigation areas Prior peak potable water makeup 25,100 gpd (95 m 3 /d) for CT; 9,360 gpd (35.4 m 3 /d) pond and irrigation Implemented RW retrofit at CT with Pretreatment Technology in 2012

 Reduce")
4 AMYLIN PHARMACEUTICALS BACKGROUND Project Goals Switch from potable to recycled water use Focus on feature pond, irrigation & cooling tower Reduce overall water use (implement conservation) Reduce overall O&M costs.

5 COOLING TOWER BASICS
6 COOLING TOWER BASICS MU = E + BD Where: MU = Make-Up Water E = Evaporation BD = Blowdown MU COC = MU / BD Where: COC = Cycles of Concentration E Cooling Tower BD
7 RW IMPLEMENTATION CHALLENGES: Water quality typically poorer than potable (TDS, PO4, nutrients, etc.) Maximum COC of RW < PW Increase in scaling potential Increase in corrosion potential Potential increase in bacteriological activity Condition of existing system Regulatory/permitting/inspection barriers & concerns
8 RW CT IMPLEMENTATION CHALLENGES Constituents of Concern Unit City of SD RW Quality Total Dissolved Solids (TDS) Calcium Hardness mg/l 914 mg/l as CaCO 3 Saturation Limits/Issues in Cooling Water Increases ionic strength & corrosion potential in cooling water 162 Calcium carbonate scaling issues Calcium Sulfate (Ca x SO 4 ) mg/l 36,612 Max. 500,000 mg/l without scale inhibitor Mag. Silicate (Mg X SiO 2 ) mg/l 1,404 Max. 35,000 mg/l without scale inhibitor Ortho-Phosphate mg/l as PO Calcium phosphate scaling Ammonia mg/l as N 0.3 Copper alloy corrosion issues Chloride mg/l 239 Corrosion issues Total Org. Carbon (TOC) mg/l 8.6 Fouling and biological issues
 mg/l 36,612 < 1,000,000 Alternate Technology? Mag. Silicate (Mg X SiO 2 ) mg/l 1,404 75,000 Ortho-Phosphate mg/l as PO 4 5.8 4-9 Ammonia mg/l as N 0.3 < 1.")
9 RW CT IMPLEMENTATION CHALLENGES Constituents of Concern Unit City of SD RW Quality Total Dissolved Solids (TDS) Calcium Hardness Cooling Water Limits w/ Chemical Feed mg/l 914 < 5,000 mg/l as CaCO <1,200 Calcium Sulfate (Ca x SO 4 ) mg/l 36,612 < 1,000,000 Alternate Technology? Mag. Silicate (Mg X SiO 2 ) mg/l 1,404 75,000 Ortho-Phosphate mg/l as PO Ammonia mg/l as N 0.3 < 1.5 Chloride mg/l 239 < 1,500 Total Org. Carbon (TOC) mg/l 8.6 Fouling/Biological
10 PRETREATMENT TECHNOLOGY Patented Alternative Pretreatment Technology (WCTI) Media filtration to lower TSS and prevent IX resin fouling Softening to remove Ca and Mg Operation at high COC (i.e., high TDS, ph alkalinity, phosphate and silica) Non-common (diverse) ion effect Scale & corrosion prevention Biostatic
11 ALTERNATE PRETREATMENT TECHNOLOGY Constituents of Concern Unit City of SD RW Quality Total Dissolved Solids (TDS) Calcium Hardness Cooling Water Limits w/ Chemical Feed Alt. Pretreat. Technology mg/l 914 < 5,000 < 100,000 mg/l as CaCO <1,200 < 30 * Calcium Sulfate (Ca x SO 4 ) mg/l 36,612 < 1,000,000 N/A Mag. Silicate (Mg X SiO 2 ) mg/l 1,404 75,000 N/A Ortho-Phosphate mg/l as PO N/A Ammonia mg/l as N 0.3 < 1.5 < 60,000 Chloride mg/l 239 < 1,500 < 60,000 Total Org. Carbon (TOC) mg/l 8.6 Fouling/Biological Biostatic
12 AMYLIN IMPLEMENTATION COOLING TOWER INFORMATION Parameter Cooling Capacity Delta T Recirculation Rate Peak Evaporation Rate Tower Materials Value 500 Tons 10 Deg. F 1500 gpm 12 gpm Galvanized with S.S Basin
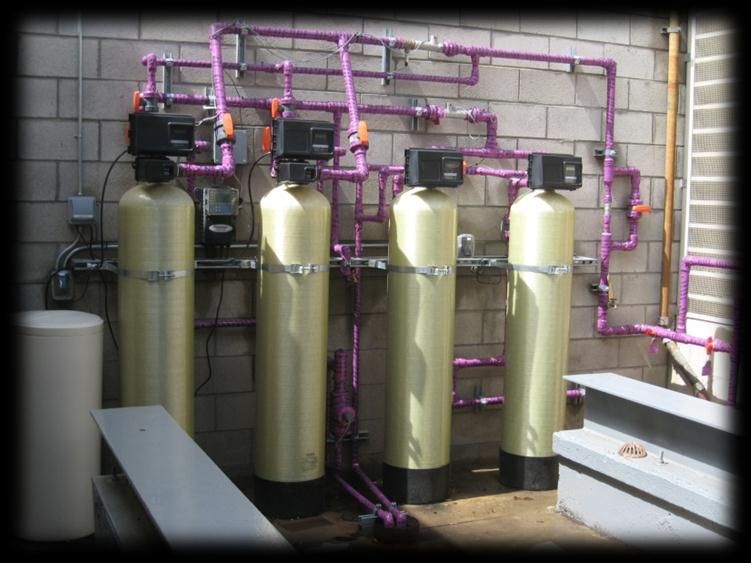


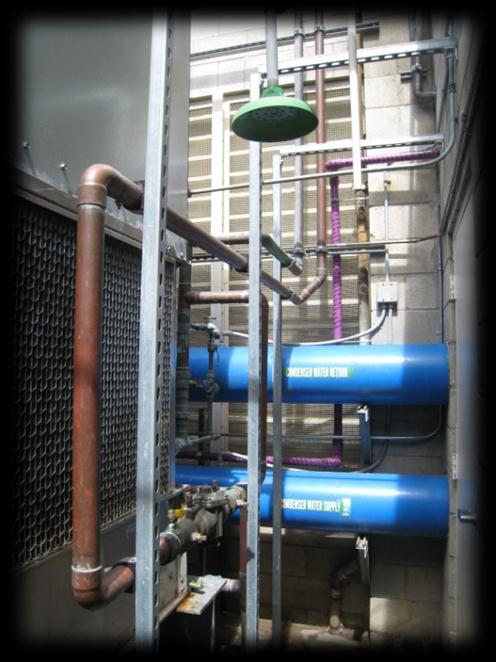

13 AMYLIN IMPLEMENTATION Pretreatment System Installed
14 OPERATIONAL UPDATE
15 OPERATIONAL UPDATE
16 OPERATIONAL UPDATE - INSPECTION Chiller inspection performed Jan Electromagnetic induction (eddy-current) testing Copper tube with epoxy-coated steel plate end No tube damage, minor pitting noted No or very minimal scale Operator noted best inspection of chiller since installation. Cooling Tower Issues White rust (i.e. zinc-carbonate) noted on galvanized upper. No scale, no corrosion.
17 ECONOMIC ANALYSIS (ORIGINAL) Description Previous Chemical Treatment Revised Chemical Treatment Implemented WCTI Technology Operational Data Make-up Water Source 100% Potable 100% Potable 100% RW Annual Average Evaporation, gpd 17,280 17,280 17,280 Annual Average Blow-Down, gpd 7,855 4, Annual Average Make-Up Water, gpd 25,135 21,600 17,633 Cycle of Concentration Annual O&M Cost Comparison Annual Make-up Water Cost $44,650 $38,370 $6,880 Annual Blow-Down Cost $28,750 $15,810 $1,290 Annual Chemical Cost $8,000 $10,000 $0 Annual Salt & Patent Program Cost $0 $0 $11,900 Total Annual O&M Costs $81,400 $64,180 $20,070 Annual Cost Savings Green Tech $61,330 $44,110 $0 Total WCTI Capital Cost $21,350
18 ECONOMIC ANALYSIS ( ) Description Previous Chemical Treatment Revised Chemical Treatment Implemented WCTI Technology Operational Data Make-up Water Source 100% Potable 100% Potable 100% RW Annual Average Evaporation, gpd 4,433 4,433 4,433 Annual Average Blow-Down, gpd 2,015 1, Annual Average Make-Up Water, gpd 6,448 5,541 4,545 Cycle of Concentration Annual O&M Cost Comparison Annual Make-up Water Cost $11,799 $10,140 $1,774 Annual Blow-Down Cost $4,916 $2,704 $272 Annual Chemical Cost (Est.) $2,052 $2,565 $0 Annual Salt & Patent Program Cost $0 $0 $3,053 Total Annual O&M Costs $18,768 $15,409 $5,099 Annual Cost Savings $13,668 $10,310 $0 Total WCTI Capital Cost $21,350
19 IMPLEMENTATION CHALLENGES - ALTERNATE TECHNOLOGY - Monitor operation on daily basis Verify proper functioning of existing open loop cooling system Consider removal of any existing scaling Allow for period of adjustment Requires regular monitoring same as chemical treatment Consider automatic blowdown control
20 OVERALL IMPLEMENTATION BENEFITS Potential for greater adoption of RW use in cooling towers Alternate technology adapts to challenging RW water quality Reduced water purchase cost (client benefit) and consumption (agency benefit) O&M costs minimized (typical ROI of 2 years or less) Qualifies for LEED credit
 614-5035 Alex Rahimian-Pour alexrp@rbf.")
21 CONTACT INFORMATION Joel E. Bowdan III, P.E. (858) Alex Rahimian-Pour (858) QUESTIONS & ANSWERS