PROGRESS TOWARD SUSTAINABLE ENERGY
|
|
|
- Doris Barker
- 5 years ago
- Views:
Transcription

1 PROGRESS TOWARD SUSTAINABLE ENERGY Global Tracking Framework 2015


2 Coordinators: Partners:
3 Despite some acceleration, Africa still not moving fast enough to end energy poverty by 2030
4 Pace of electrification doubled in recent years, but needs to double again to meet SDG7 40% 60% 21% 20% 80% 0% 100%
5 Pace of electrification doubled in recent years, but needs to more than double again to meet SDG7 39% 40% 60% 21% 20% 80% 0% 100%
6 Minimal progress on access to non-solid fuels, and moving even more slowly than in the past 40% 60% 20% 80% 11% 0% 100%
7 Minimal progress on access to non-solid fuels, and moving even more slowly than in the past 40% 60% 20% 80% 11% 7% 0% 100%
8 Africa s progress on energy efficiency is about SSA Efficiency: 46% half of what the global target envisages 46% 40% 60% 20% 80% 0% 100%
9 Africa s progress on energy efficiency is about half of what the global target envisages 46% 51% 40% 60% 20% 80% 0% 100%
10 Recent acceleration of modern renewables, consistent with a doubling of the share by % 40% 60% 20% 80% 0% 100%
11 Recent acceleration of modern renewables, consistent with a doubling of the share by % 40% 60% 20% 80% 100% 0% 100%
12 Africa s overall progress: a mixed report card 39% 51% 40% 60% 20% 80% 7% 0% 100% 100%
13 Many African countries are gearing-up on electrification, but challenging to stay ahead of population growth
14 Percent Percent Notable long term acceleration in electrification rates, and stagnation in progress on non-solid fuels Access to electricity (% of total population) Access to Non-Solid Fuel (% of total population) Access to electricity, Access to non-solid fuels,
15 Million people Million people Absolute number of people without access constant for electricity (at 590m), growing for non-solid fuels (to 747m) Electricity access deficit (millions of people) Non-solid fuel access deficit (millions of people) 15
16 For the first time, African pace of electrification just kept up with population growth; not so for non-solid fuels 24 million 24 million 5 million Average annual increase in electrified population Average annual population increase Average annual increase in population with access to non-solid fuels
17 In South Asia, pace of electrification already almost four times faster than population expansion 38 million 11 million 11 million Average annual increase in electrified population Average annual population increase Average annual increase in population with access to non-solid fuels
18 To stay ahead of population and meet SDG7 target million Africans will need to gain access each year 24 million 24 million 5 million Average annual increase in electrified population Average annual population increase Average annual increase in population with access to non-solid fuels million 29 million 71 million
19 Four times as many people gained energy access in urban than rural areas over Share of energy access in rural areas Share of energy access in urban areas
20 Most African countries making steady progress on electrification Electrification rate did not increase between Electrification rate increased by less than 2 percentage points Electrification rate increased by at least 2 percentage points
21 Electrification Most African countries making steady progress on electrification Electrification rate did not increase between Electrification rate increased by less than 2 percentage points Electrification rate increased by at least 2 percentage points

22 Electrification Most African countries making steady progress on electrification Electrification rate did not increase between Electrification rate increased by less than 2 percentage points Electrification rate increased by at least 2 percentage points
23 Progress on access to non-solid fuels lackluster across the board Rate of access to non-solid fuels did not increase between Rate of access to non-solid fuels increased by less than 2 percentage points Rate of access to non-solid fuels increased by at least 2 percentage points
24 Progress on access to non-solid fuels lackluster across the board Rate of access to non-solid fuels did not increase between Rate of access to non-solid fuels increased by less than 2 percentage points Rate of access to non-solid fuels increased by at least 2 percentage points

25 Progress on access to non-solid fuels lackluster across the board Rate of access to non-solid fuels did not increase between Rate of access to non-solid fuels increased by less than 2 percentage points Rate of access to non-solid fuels increased by at least 2 percentage points
26 Despite strong efforts only a handful of countries are accelerating energy access faster than population Mali Nigeria Ghana Congo, DR Rwanda Burkina Faso Cameroon Mozambique Zambia Angola Uganda Niger Ethiopia South Sudan Malawi Tanzania Kenya Madagascar Chad Burundi -6.5% -0.1% -0.5% -1.1% -1.5% -1.7% -1.8% -1.9% -2.3% -2.3% -2.4% -2.4% -2.5% -3.3% 2.2% 1.0% 0.8% 0.4% 0.0% 5.9% Mali Congo, DR Burkina Faso Cote d'ivoire Angola Ghana Nigeria Zambia Kenya Malawi Tanzania Mozambique Madagascar Rwanda Cameroon Uganda Niger Chad Ethiopia Guinea -0.2% -0.6% -1.0% -2.5% -2.6% -2.9% -3.0% -3.0% -3.4% -3.5% -3.6% -3.7% -4.0% -4.6% -4.7% -4.9% -6.3% 0.3% 0.1% 1.7% Access to electricity net growth rate, Access to non-solid fuels net growth rate,
27 Access rate change (percentage points) Access rate 2012 (percent) Among top 20 electricity access deficit countries, show slow expansion in countries with lowest electrification Electricity access rate in 2012 (top) and access rate percentage point change, (bottom) 27
28 Access rate percentage point change, Access rate in 2012 (percent) Among top 20 non-solid fuel access deficit countries, fastest expansion among those with highest access Non-solid fuel access rate in 2012 (top) and access rate percentage point change, (bottom) 28
29

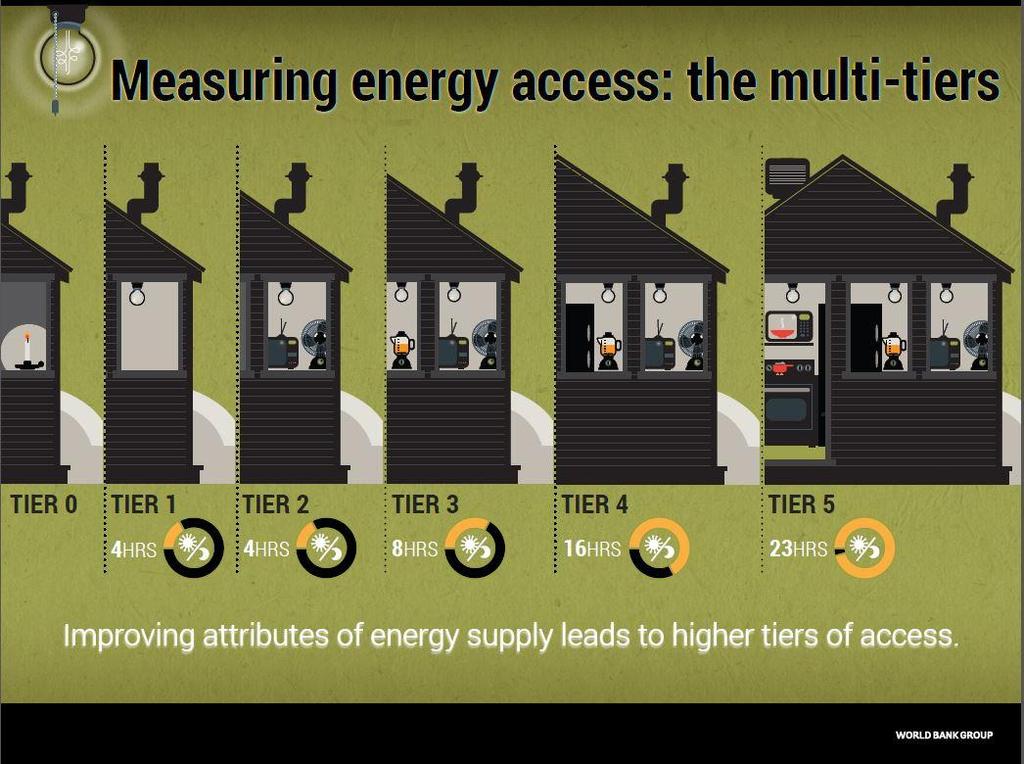
30 Kinshasa pilot shows multi-tier framework gives a much more nuanced picture of energy access 30
31 Conventional measures of energy access fail to capture many important dimensions of service quality Electricity Source Capacity Duration Duration Source Source 24 Hours (hours) Evening (hours) NO ACCESS 10% SHS 2% OTHER 1% NO ACCESS 10% SHS 2% OTHER 1% 8h-16h 23% 16h- 22h 9% >22h 6% <4h 23% >4h 41% <1h 9% 1h-2h 18% GRID 87% GRID 87% 4h-8h 39% 2h-4h 32% Reliability Quality Affordability Legality Duration of interruptions (mins) Low Voltage problems Index: Index: None 38% >30 mins 46% Good voltage 15% Not Afforda ble 2% Not Legal 2% <10 mins 5% mins 11% Low Voltage 85% Afforda ble 98% Legal 98% Less than 8 hours per day for 62% of the household Unscheduled interruptions are longer than 30 minutes for more than 57% of the household Almost 85% of the household experienced low voltage 31
32 African economies are surprisingly energy intensive, some progress driven mainly by transport and by South Africa
33 MJ/USD 2011 PPP Africa shows high levels of energy intensity, compared to most other regions EUR NAF LAC SEA WAS SAS OSN NAR EAS SSA EEU CCA Energy intensity by region,


34 Africa most energy intensive continent after Eastern Europe and CIS, but making meaningful improvements Primary Energy intensity reduction Energy savings MJ/$ 7.9 MJ/$ 34
35 MJ/2011 USD PPP GJ/household Transport Primary Industrial Residential Agricultural Services Africa s energy intensity is decreasing at -1.4% per year, driven entirely by improvements in transport and industry Transport Industrial Agricultural Services Residential Primary -4.1 Energy intensity, CAGR of energy intensity,
36 One third of countries making rapid progress on efficiency Compound annual growth rate of energy intensity did not improve between Compound annual growth rate of energy intensity improved by less than 2.6% per annum in Compound annual growth rate of energy intensity improved by at least 2.6% per annum in
37 One third of countries making rapid progress on efficiency Compound annual growth rate of energy intensity did not improve between Compound annual growth rate of energy intensity improved by less than 2.6% per annum in Compound annual growth rate of energy intensity improved by at least 2.6% per annum in
38 One third of countries making rapid progress on efficiency Compound annual growth rate of energy intensity did not improve between Compound annual growth rate of energy intensity improved by less than 2.6% per annum in Compound annual growth rate of energy intensity improved by at least 2.6% per annum in
39 CAGR of Energy Intensity, (percent) Energy Intensity in 2012 (MJ/USD 2011 PPP) Among 20 top energy consumers, 8 exceeded SE4ALL energy intensity change target of -2.6% per year AGO GHA CMR SEN NGA MDG BFA ZMB UGA KEN ZAF BEN CIV GIN TZA ETH ZWE MOZ ZAR SOM AGO GHA CMR SEN NGA MDG BFA ZMB UGA KEN ZAF BEN CIV GIN TZA ETH ZWE MOZ ZAR SOM Top 20 energy users primary energy intensity in 2012 (top) and energy intensity CAGR (bottom) 39
40 Africa is the world s most renewable continent, thanks mainly to biomass and hydro, in midst of structural shift from traditional to modern sources
41 Percent of TFEC Africa s energy consumption is 70% renewables, and 9% modern renewables comparing favorably with Asia Solid biofuels, trad. Solid biofuels, mod. 50 Hydro Biogas 40 Waste Solar Wind Geothermal Liquid biofuels Modern RE share 0 EAS EUR LAC NAR SAS SEA SSA 41


42 Traditional biomass consumption decreased 0.46 EJ , equivalent to Angola s annual energy consumption Traditional RE share decrease Annual traditional RE consumption decrease, % 61.9% 0.46 EJ 42


43 Modern renewable energy consumption increased 0.19 EJ , more than Benin s annual consumption Modern RE share increase Annual modern RE consumption increase, % 0.19 EJ 9.0% 43
44 GW Percent Modern renewable energy, mainly hydro-power, provide 20% of Africa s electricity Geothermal Solar Biomass, Waste 15 Wind Hydro RE share of installed capacity RE share of installed capacity excluding hydro Renewable capacity change (left) and renewables share of capacity (right),
45 Few countries rapidly increasing modern renewable share Share of modern renewable energy in total final energy consumption did not improve between Share of modern renewable energy in total final energy consumption improved by less than 1 percentage point Share of modern renewable energy in total final energy consumption improved by at least 1 percentage point
46 Few countries rapidly increasing modern renewable share Share of modern renewable energy in total final energy consumption did not improve between Share of modern renewable energy in total final energy consumption improved by less than 1 percentage point Share of modern renewable energy in total final energy consumption improved by at least 1 percentage point
47 Few countries rapidly increasing modern renewable share Share of modern renewable energy in total final energy consumption did not improve between Share of modern renewable energy in total final energy consumption improved by less than 1 percentage point Share of modern renewable energy in total final energy consumption improved by at least 1 percentage point
48 Modern RE share annual increment, (percentage point change) Modern RE share of TFEC, 2012 (percent) Among top 20 energy consumers, 8 expanded their renewable energy share between Top 20 energy consumers modern renewable energy share in 2012 (top) and modern renewable energy share annual percentage point change,
49 Annual investment needs range from $49-85 billion
50 Annual investment needs very much depend on the level of ambition for energy access Electricity access Energy efficiency Renewable energy Tier Providing at minimum universal Tier I/III/V electricity access to Sub-Saharan Africa s population Source: results from AIM model $Billion/year 12 Significantly reducing energy intensity in Africa Source: WEO Doubling Africa s share of RE in TFEC Source: IRENA REmap
51 For more information on the report, please go to: trackingenergy4all.worldbank.org #endenergypoverty