Protocol for the determination of potential biogas production
|
|
|
- Delphia Parks
- 5 years ago
- Views:
Transcription
1 Protocol for the determination of potential biogas production Johan W. van Groenestijn TNO November General principle Samples of biomass are mixed with a mixture of anaerobic bacteria (sludge), water and a ph buffer in a glass bottle connected to a plastic bag. The bag is inflated by the biogas produced and the volume of biogas produced is determined and related to the amount of biomass used in the test. Biomass collection Samples of the biomass should be representative, which means: sufficiently large to compensate for composition heterogeneity. Several kilograms normally will do. Take samples in the middle of a heap (not at the bottom, to avoid sand and soil). In case of banana leaves: take whole leaves at once. Manure: mix well before sampling. Sometimes biomass is ensiled already: a part of the sugars is biologically converted into lactic and acetic acid, which causes a low ph (4), which preserves further bioconversion. This a not a problem for biogas potential determination, as the acids are used as substrates for biogas production as well. Important is to keep such silage anaerobic most of the time. Transport the biomass as fast as possible to the lab. Storage of the samples and particle size reduction Always aerobic decomposition and premature biogas production should be avoided. Gras, straw and bagasse: cut the biomass into pieces of 1 cm and put the material in plastic bags; vacuumize and seal the bags. This minimizes the contact between oxygen and biomass and minimizes aerobic degradation during storage. Store the bags at 4 C or as cool as possible. Ensiled biomass: directly put the material in plastic bags; vacuumize, seal the bags and store the bags at 4 C. Cutting or shreddering should be postponed now to a moment close before a biogas test. Thick pieces of biomass (stems of banana leaves, wood branches): shredder into pieces of a few mm, put the material in plastic bags; vacuumize, seal the bags and store the bags at 4 C. In case vacuumizing is not possible: dry the material at 80 C and store at 4 C. Drying should not be carried out using silage, since it evaporates the organic acids (substrate). Silage can alternatively be stored in a vessel fully loaded with dense biomass. Flushing the vessel headspace with nitrogen gas would be beneficial. Manure en sewage sludge: store at 4 C. If no cooling facilities are present: carry out the experiments as soon as the samples have been collected.
2 Determination of the dry matter content Since the amount of biogas produced will also be expressed as m 3 produced per ton of biomass dry matter, the dry matter content of the sample is determined. For that, take a representative smaller sample (can be 3 gram) from the large sample. A standard dry matter determination can be used. That is: pre-weigh a glass, metal or ceramic empty beaker or cup; put the fresh (wet) biomass sample in it and determine the weight again. Put this in a preheated oven at 103 C and incubate until the weight does not decrease anymore (several hours). Take out the beaker and cool it in a desiccator (its dry atmosphere prevents absorption of atmospheric water again) and weigh again. Dry matter concentration (g dry/g fresh) = (weight dried beaker and biomass) (weight beaker) (weight beaker and fresh biomas) (weight beaker) An interesting addition is the determination of the organic fraction of the dry matter. This can be done by incineration of the organic fraction in a furnace and weighing the residue ash. Anaerobic sludge required Biogas from biomass is produced by a mixture of bacteria. For the determination of biogas production such mixture should be added in form of a sludge. The sludge inoculum maybe sludge from an anaerobic sludge digester (preferred), manure digester or other anaerobic digesters. This sludge should be derived from a bioreactor with a temperature ideally between 30 C and 35 C. As an indication: such sludge has a dry matter concentration of 30 g/l. Store the sludge in completely filled vessels (avoid contact with air). Store the sludge at least two weeks under 4 C: in that time it loses a part of its own substrate (which is favorable for the experiment). After opening and use: flush the head space of the vessel with nitrogen gas to replace air. Close the vessel again. Pure cellulose as a control To check if the sludge is really active pure cellulose can be added, which can be Avicel from SigmaAldrich or Solkafloc. Crystalline cellulose is slowly converted into biogas. ph buffer solution The optimum ph for biogas production is 7 to 8. ph lower than 6 almost totally inhibits methane production. Since biomass is converted into biogas via organic acids (e.g. acetic acid), a danger exists that these acids accumulate and decrease the ph. To prevent such ph drop, a ph buffer is used. A stock solution of 2.5 M phosphate buffer is required, having a ph of 7.5. That can be prepared using a solution that contains 2.5 M KH 2 PO 4 and 2.06 M NaOH.
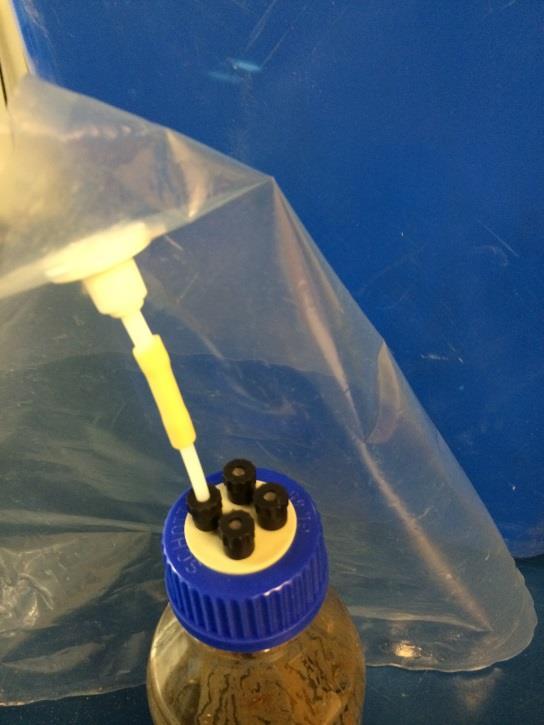
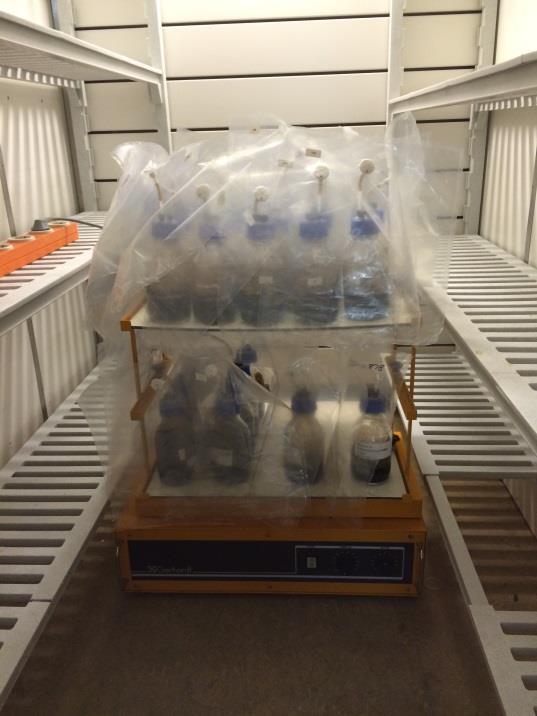
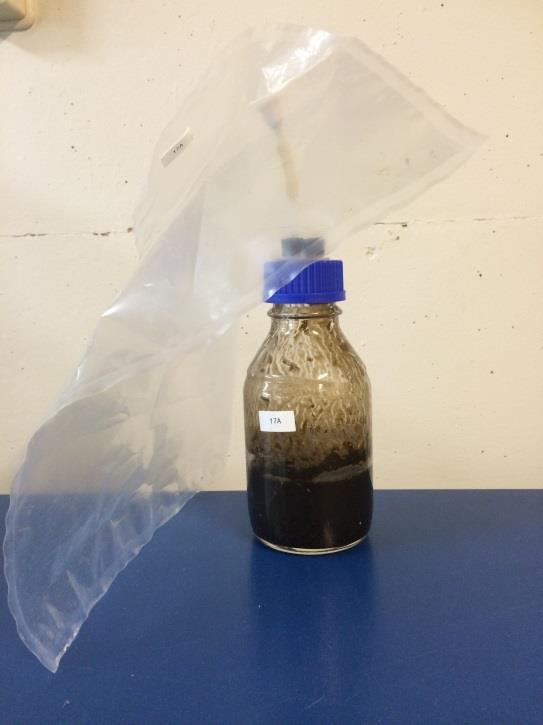
3 Procedure A low concentration of biomass is used in order to prevent fast acidification and the avoid to high concentrations of inhibitors such as ammonia and sulfide. A large amount of anaerobic sludge is used to guarantee sufficient activity. Please note that such sludge is not yet fully adapted to the biomass type. To compensate for that, the amount of sludge is large. In the procedure some bottles with only sludge (and no biomass) are used to determine the amount of biogas that is produced by the sludge itself (using own substrates). In addition, pure cellulose is used as a check for the activity of the sludge. Take glass bottles with a volume of 1 liter or 500 ml (e.g. Duran bottles) on which a gastight plastic bag is coupled. These are gas tight bags (with a kind of lock) used in a laboratory equipment store. The lid, connection and tubing should not leak gas. That can be tested in a dry experiment with a full gas bag. Open the bottle and flush with nitrogen gas to replace the air (anaerobic bacteria are inactivated by oxygen). Put an amount of fresh biomass in the bottle that represents 6 gram dry matter. Put 150 gram anaerobic sludge in the bottle Add 4 ml 2.5 M phosphate buffer. Add an amount of demineralized or distilled water to get a total of 200 g content. Flush the head space with nitrogen gas. Mix and put a ph electrode in the mixture. Add small amounts of 1 M NaOH or 1 M HCl solutions to adjust the liquid to a ph between 7 and 8. Flush the head space again with nitrogen gas. Put the lid on the bottle and make a connection with an empty gas bag. Ideally the bottles are place on an orbital shaker to guarantee mixing (fig. 2); if not: mixing them by hand once every day; if possible more. The bottles (and orbital shaker) are place in a temperature controlled room. The temperature should not be far away from the temperature the anaerobic sludge is used to, buy always between 30 C and 37 C. Three mixtures (carry out in duplicate): Wet biomass that contains 6 g dry matter Pure cellulose (g) Anaerobic sludge (g) Test Reference Blanc M phosphate buffer (ml) The experiment should be continued until biogas production has leveled off. This can take 50 days. Within this 50 days at 10 times the volume of the accumulated gas the bags is determined, or whenever you feel it is necessary. In the first 10 days more frequent determinations will be necessary: gas production is faster then. Always determine the gas volume in all bottles in the same session. The volume can be determined by sucking gas from the bag using large Plastipak syringes.
4 Suck many times and add up all syringe volumes. An alternative is to fill a tube with water and replace the water with the gas from the bag. See fig. 3 for an example. Any other alternative (e.g. using Archimedes Law) can be used here. Register the temperature at which the gas volume was determined. Every time the bag is uncoupled from the bottle produce a little liquid via the tube connection: determine the ph in the liquid. If the ph has dropped below 7: Mix and put a ph electrode in the mixture. Add small amounts of a 1 M NaOH solution to adjust the liquid to a ph between 7 and 8. Flush the head space again with nitrogen gas. Put the lid on the bottle and make a connection with an empty gas bag. A table can be made with the cumulative biogas volume (in ml) as function of time, for the bottles with biomass and the bottles with sludge only. Averages can be calculated of each type of bottle. Subsequently, the average amounts of biogas produced by bottles with biomass can be subtracted by the average amounts of biogas produced by bottles with biomass only. This yields the biogas that is produced from the biomass. A graph can be made with the cumulative biogas volume (in ml) on the Y-axis and the time (days) on the X-axis. Do this during the experiment (can be 50 days) to make the leveling-off visible. This way it can be judged when the biogas production is completed. The amount at the end of the experiment gives the ml biogas ultimately produced by 6 gram of biomass dry matter. This can be used to calculate the amount of m 3 /ton biomass dry matter. Alternatively, the amount of biogas produced per ton of fresh (wet) biomass can be calculated. Since the volume of biogas depends on its temperature, often the volume at standard conditions (at 0 C and 1 bar absolute pressure) is given: that is the normal volume, expressed as Nm 3. Nm 3 = (m 3 at temperature A in C) x 273/(A + 273) Six gram of cellulose can produce several liters of biogas (max 5 6 l). If the biomass sample hardly produces biogas but the reference (pure cellulose) does, then the sludge is of good quality but the biogas potential of the biomass is low. If both the biomass sample and the reference hardly produce biogas, then the sludge is of low quality and a different sludge source should be tried. However, it can also be an indication that the procedure is not carried out well (e.g. by mixing it too much with oxygen).


5 Fig. 1 Glass bottle with gas bag Fig. 2 Glass bottle on orbital shaker Fig. 3 Gasmeter
6 More photographs