CTCN: Introduction to Climate Technologies in Buildings. Presented by : Mili Majumdar and Tarun Garg TERI (The Energy and Resources Institute) India
|
|
|
- Luke Melton
- 5 years ago
- Views:
Transcription
1 CTCN: Introduction to Climate Technologies in Buildings Presented by : Mili Majumdar and Tarun Garg TERI (The Energy and Resources Institute) India


2 The Climate Technology Centre and Network Operational arm of the UNFCCC Technology Mechanism Consortium of organizations from all regions Mission to stimulate technology cooperation and enhance the development and deployment of technologies in developing countries Technologies include any equipment, technique, knowledge and skill needed for reducing greenhouse gas emissions and for adapting to climate change effects Core services include: o Technical assistance to developing countries o Knowledge platform on climate technologies o Support to collaboration and partnerships
 State of the art and locally relevant expertise To academic, public, NGO, or private")

3 CTCN Technical Assistance Fast and short (3 pages) application process for countries Provided: To developing countries upon their request Free of charge (value up to 250,000 USD) State of the art and locally relevant expertise To academic, public, NGO, or private entities For a broad range of adaptation and mitigation technologies At all stages of the technology cycle: From identification of needs; policy assessments; selection and piloting technology solutions; to assistance that supports technology customization and widespread deployment


4 CTCN Webinar Series Cities Coastal management Disaster and early warning Poverty Waste Forestry Energy Building Agriculture Industry Transport Water Ecosystem based technologies An introduction to climate technologies
5 Audio Options Two Options for Audio (select audio mode): 1. Listen through your computer Please select the mic and speakers radio button on the right hand audio pane display 2. Listen by telephone Please select the "telephone option in the right-hand display, and a phone number and PIN will display. 3. Please mute your audio device 4. Technical Difficulties: Contact the GoToWebinars Help Desk:
6 Interaction We invite you to introduce yourself Select and type into the chat pane on your screen To ask a question Select the questions pane on your screen and type in your questions The presentations will be made available after the webinar
7 Overview of the presentation/webinar Overview Global overview of energy consumption in building sector Sectoral energy consumption at global level End use consumption breakup for select countries Classification of key end uses that consume maximum energy in buildings (lighting/space cooling and heating/cooking) Role of technologies in reducing consumption patterns (in new and existing buildings) Mitigation options in new and existing buildings Solar passive measures Orientation, site planning Building envelope (walls/roof/fenestration) Other solar passive measures : some examples from India (Earth air tunnel/solar chimneys/pdec etc) Energy systems ( lighting,space conditioning, controls etc) Gaps and barriers and tools to address barriers Case studies
8 Global overview of energy consumption in building sector Globally, buildings account for : 40% energy use 42%water consumption 40% solid waste 50% raw material use 50% of air pollution 42% GHG emission 50% water pollution Total energy use in buildings is growing rapidly due to : Economic development Increasing urbanization Improved lifestyles Increased space conditioning load

9 In 2030, share of buildings related emissions will stay at approximately 1/3 of energy related CO2 emissions CO 2 emissions including through use of electricity, A1B Scenario Source: IPCC 4th Assessment Report
10 Contribution of building sector to total final energy demand globally World regions Share of residential sector in % Share of commercial sector in % Share of total buildings sector in % Residential and commercial energy demand per capita, MWhr/capita-yr USA and Canada 17% 13% 31% 18.6 Middle East 21% 6% 27% 5.75 Latin America 17% 5% 22% 2.32 Former Soviet Union European Union % 7% 33% % 11% 34% 9.64 China 25% 4% 29% 3.20 Asia excluding China 36% 4% 40% 2.07 Africa 54% 3% 57% 3.19 World 23% 8% 31% 4.57 Source: IEA Online Statistics 2007
11 Sectoral Energy Consumption at Global Level

12 Annual energy use in residential and commercial buildings in kwh/capita/year Source: IEA Online Statistics 2007

13 Annual energy use in cooling and heating in buildings in kwh/sq m/year Source: IEA model estimations
14 End use consumption breakup for select countries
15 India: Electricity consumption in commercial buildings Electricity consumption distribution in commercial buildings HVAC 55% Lighting 25% Internal loads 15% Others 5% 55% of electricity consumption is due to HVAC 25% of electricity consumption is due to lighting HVAC market has increased from 800 Million in to 1.5 Billion in nearly double in 4 years- (Source: Report on Tri generation in India- Market Assessment Study, February 2010)
16 Role of technologies in reducing consumption patterns (in new and existing buildings)


17 Buildings: GHG emissions reduction potential for buildings stock in 2020

18 Building sector offers mitigation benefits at net negative costs Source: IPCC 4th Assessment Report
19 Mitigation options for new and existing buildings

20 Energy saving potential- New and existing buildings

21


22 Efficiency in buildings Design Standards Energy Standards Regulatory Framework Rating system (LEED, GRIHA etc)
23 Integrated Approach Passive Design of Building Cheapest Solution Use of Efficient Systems Use of Renewable Energy Most Expensive Building design Envelope optimization Wall optimization Roof optimization Fenestration optimization HVAC system optimization Inside temperature optimization Final building loads and consumption Optimized Electrical load(kw) Lighting system optimization Daylight optimization Artificial lighting Daylight integration Heat load optimization Low energy strategies Efficient HVAC equipment selection Optimized Cooling load (TR) Optimized energy consumption (kwh)
24 Equipment selection 3 E Approach- Effective, Efficient and Economically viable

25 Bioclimatic Architectural Principles Site planning/landscaping Orientation Positioning of windows, shading Selection of materials for wall, roof, windows, including insulation Optimized Building envelope Passive cooling Advanced techniques Daylighting


26 Low Energy Design Features Favorable Orientation, Roof shading, Window Shading

27 Building design examples Shading of walls, roofs and glass using existing site features and proper building design AIIS, New Delhi


28 Solar Passive buildings
29 Building Envelope Walls / Opaque surfaces Roof Windows / Fenestration / Aperture
30 Energy Efficient wall Wall with insulation Wall with high thermal mass Wall with Air Cavity Conventional wall Building Wall 25 mm Plaster 230 mm brick 25 mm Plaster U Value W/m2/deg K 200 mm AAC U Value W/m2/deg K U value of conventional wall is 5 times higher
31 Energy efficient roof Roof with over-deck insulation Cool Roofs Green Roof Conventional roof U value 1.83 W/m2/deg K 100 mm Brick coba 200 mm RCC 75 mm insulation Building roof U Value W/m2/deg K 200 mm RCC U value of conventional roof is 9 times higher

 Roof coatings Broken china mosaic")
32 Cool Roof Cool Roofs (minimum solar reflectance of 0.7and thermal emittance of 0.75) Roof coatings Broken china mosaic terracing Cool colours Traditional methods (lime wash)
33 Fenestration and Shading Devices Most vulnerable to heat gains and losses. Window size and location should be determined by: Orientation Daylight requirement Glazing type external shading wind direction Thermal comfort


34 g

35 Heat gain through glass

36 Optimize Energy Performance

37 Building Envelope optimization- Glass Conventional Glass U value 1.08 W/m2/deg K SC 0.87 Building Glass U value 0.58 W/m2/deg K SC 0.29


38 Daylighting Light Pipes Light Shelves Courtesy: Skyshade Daylights Results After Light Pipe & Light Shelves integration Daylight Area Increased 79 % 56 %


39 TERI-Retreat, Gurgaon
40 Energy systems ( lighting,space conditioning, controls etc.)

41 Approach to Efficient Lighting Indoor lighting shall provide required visual comfort in all the spaces in a building


42 Lighting design Conventional design Green design Achieve Visual comfort Efficiency in design and controls

 absorption Coefficient of utilization refers to lumen")
43 Fixture Efficiency Vs. Coefficient Of Utilization Fixture Efficienc y refers to light output emitted by fixture to light output of lamp 150 lumen 100 Lumens Environmental factors Surface ( wall, ceiling, furniture) absorption Coefficient of utilization refers to lumen output reaching work plane to the output of fixture 50 Lumens

44 Lumen Depreciation
 = 50 lm/w")
45 Luminous Efficacy - CFL 13 W 900 lm 5 W 18 W Luminous Efficacy : 900/(13+5) = 50 lm/w
46 Indoor lamps comparison Light Source Incandescent lamp Fluorescent Lamp Efficacy (lm/w) Average Life (hours) CRI CCT (K) Compact Fluorescent Lamp Metal Halide LED

47 Artificial Lighting Design Meeting recommended lux level for visual comfort Fixing height Reflectance of room surfaces Maintenance factor Controls Separate switch for individual fixtures Occupancy based sensors and daylight sensors to be integrated with artificial lighting scheme


48 Lighting Controls Occupancy sensors Daylight Sensors Timer based controls


49 Building Lighting system optimisation T-5 FTL with electronic choke Wattage =30 W Continuous Dimming Sensor LPD 10.8 W/ft 2 LPD 7 W/ft 2

50 Efficient Space conditioning design Optimize building cooling demand Optimize air system performance Optimize plant selection & performance Use low energy air conditioning systems

51 Building cooling demand optimization deg C 65%RH Heat gain from roof Heat gain from walls Heat gain from glass/daylight from glass Heat gain from infiltration Heat gain from equipment/lighting/people Building Design optimization Building Envelope optimization Building Lighting system optimization Inside temperature Optimization Ventilation Rate optimization
52 Inside temperature optimization C/50% 23C/60% 24C/50% 24C/60% 25C/50% 25C/60% 26C/50% 26C/60% 1deg C decrease in temperature increases cooling load by 3.5%


53 Precooling of fresh air Outside air damper Energy Recovery Wheel Supply air Outside air Filters Return air Cooling demand Reduction 16%

54 Impact on cooling demand Heat load (TR) Optimization Base Case Orientation Optimized WWR Optimized Envelope as per ECBC 233 TR 220 TR 188 TR 163 TR 6 % 20 % 30 % Optimized lighting 210 TR 10 % All 127 TR 45 %
55 Operating hours in a year Building cooling load profile % Loading

56 HVAC plant selection & Performance Annual average performance at different loading percentage & outdoor conditions shall be better than full load rated performance


57 Air conditioning systems Distributed system Window AC COP VRFs COP-4.0 Centralized system Air cooled COP-3.5 Water cooled COP-6
 Higher efficiency at part loads 6 5 4 3 2 1 0 5.34 4.67 4.38 3.")
58 Variable Refrigerant Volume (VRVs) Outdoor unit One outdoor unit and multiple indoor unit Efficiency of VRV at different % loading Conserve space Conserve energy with modular switching (COP = 4.3) Higher efficiency at part loads % loading 75% loading 50% loading 25% loading 10 HP

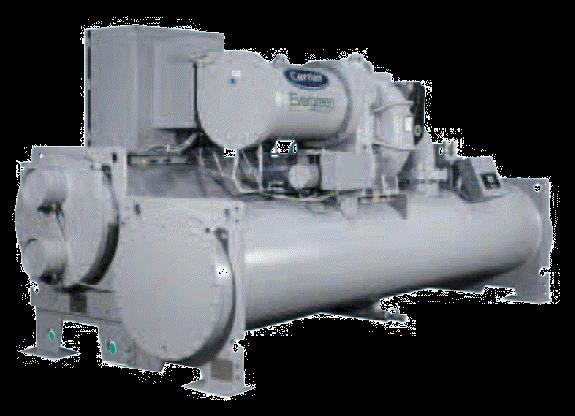
59 Central water cooled chiller plant


60 Efficient chillers High efficiency chillers Chillers with VFD Magnetic bearing chillers


61 Efficient auxiliaries Pump efficiency >80% Motor efficiency >90% Fan efficiency > 60%

62 Automation in chiller plant 5-7% energy savings 10-15% energy savings


63 Radiant floor cooling/heating system
64 Energy and cost analysis-radiant cooling

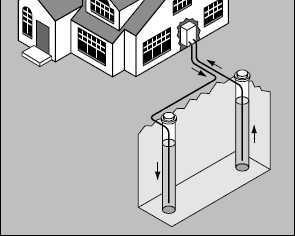

65 Geothermal systems
66 Resource and cost analysis-geothermal

67 Hybrid System


68 Impact of green design on Energy EPI (kwh/m2/yr) Base Case 202 Orientation % Optimized WWR Optimized Envelope as per ECBC % 17 % Optimized lighting % Optimized HVAC % All %
69 Gaps and Barriers and Tools to Address Barriers
70 Gaps and Barriers Financial costs/benefits (Incremental costs, access, subsidies, co benefit costs) Market failures ( Standardised building design process, Fragmented market, split and misplaced incentives Administrative and regulatory ) Gaps and Barriers Behavioral and organizational nonoptimalities (Organizational failures, lack of awareness, and lifestyle, Lack of enforcement /implementation /monitoring)
71 Policies to address the barriers Control and regulatory mechanismsnormative instruments Appliance standards Building codes Procurement regulations Energy efficiency obligations and quotas Regulatory informative instruments Mandatory labeling and certification programs Mandatory audit programs Utility demand-side management programs Economic and market-based instruments Energy performance contracting/esco support Cooperative technology procurement Energy efficiency certificate schemes Fiscal instruments and incentives Taxation (on household fuels) Tax exemption/reductions Capital subsidies, grants, subsidised loans Support, information and voluntary action Voluntary certification and labelling Public leadership programs Awareness raising, education, information campaigns Detailed billing and disclosure programs
72 International Best Practices Issues Applicability Case study country Energy Efficiency Regulatory Framework and Assessment for buildings Mandatory requirements for energy efficiency in conditioned and non-conditioned buildings Natural and mechanical ventilation rates defined Minimum Ventilation opening area Adequate daylighting provision Artificial Lighting efficiency requirements Provisions for Passive Solar Design Measures Energy Efficiency Assessment-Artificial lighting Energy Efficiency Assessment-HVAC Efficiency requirements for system selection and design Energy labeling standards for appliances Energy Efficiency Assessment-Appliances Singapore, Australia, India Singapore, Netherlands Australia U.K. India, UK, Japan, Australia U.K., Ireland, Singapore, Australia U.K., Austria, Singapore, Japan
73 International Best Practices Issues Applicability Case study country Provisions for renewable energy Enhanced capital allowances Green Power Accreditation label Capital allowances, grants Tax exemption Efficiency contracting Low-interest loans Energy advise sessions Building approval process Rebates on electricity bills Implementation and Incentivising U.K. Australia U.K., Germany, Austria Germany Germany Germany Austria Australia West Bengal, Karnataka, Rajasthan Training and Awareness programs Training and accreditation workshops Seminars, workshops, websites, journals Documents on practical examples and solutions on achieving compliance Education system UK, Australia, Japan U.K., Austria, Australia U.K. Singapore
74 Examples from India
75 Innovative financing (promotional programme of 50 million euros by National Housing Bank) for residential sector EE homes Savings verified through assessment tool PLIs on board to disburse loans PLIs get loans refinanced from discounted rate Incentive may be passed on to consumer No. of loans: >1,912 Value of loans: 50 mil. No. of buildings certified: 442 Energy savings: 3,162 MWh/year CO 2 avoided: 2,688 tons/year
76 Studies to Justify Incremental Costs

 25 33% 38 51% Conventional Efficient Envelope Efficient Lighting")
77 Results of TERI study on incremental cost and savings for residential buildings Incremental cost: 0.75% - 4.5% Discounted payback periods not more than 2 years Annual Energy Consumption (kwh/sqm/yr) 25 33% 38 51% Conventional Efficient Envelope Efficient Lighting Efficient Airconditioning Solar Hot Water Systems
78 Cost increment-commercial buildings Conventional case Total project civil & Electrical cost INR 82 crores Total project civil & Electrical cost INR 20500/sqm Green case Total project civil & Electrical cost INR 83.7 crores Total project civil & Electrical cost INR 20925/sqm Cost increment (%) 2.1%
79 Role of voluntary rating system: GRIHA


80 GRIHA-Green Rating for Integrated Habitat Assessment Tool to facilitate design, construction, operation of a green building,and in turn.measure greenness of a building in India What gets measured gets managed
81 GRIHA Set of 34 criteria focusing on: Site Planning 100 (+4 innovation points) point system with differential weightage on various criteria Building Design Energy Efficiency Water and waste management Sustainable Building Materials Occupant Health and comfort

82 Indira Paryavaran Bhawan Net zero approach: GRIHA 5 star rated Energy performance index: 24 kwh/sqm /year 1 MW solar installation

83 First 5 Star Rated GRIHA Building in IIT Kanpur (RE Integration)


84 Pimpri Chinchwad New Town Development Authority (PCNTDA) Pune ECBC compliant envelope and systems Well shaded envelope with 75% areas day lit Efficient water fixtures and recharge of ground water Efficient lighting with controls 100% electricity through Solar PVs
85 Solar PV integration to meet 100% demand Payback period came down to 2.5 years from 9 years by accounting for Government subsidy of 30% Transformer eliminated (LT connection could suffice) HT metering kiosk, synchronizing panels, UPS,battery back up, one DG set eliminated
86 Questions?