Solids Separator System Demonstration Test Report Test Date: August 18-19, 2015 Report Date: September 15, 2015 Pocatello, Idaho.
|
|
|
- Morgan Henderson
- 5 years ago
- Views:
Transcription

1 Solids Separator System Demonstration Test Report Test Date: August 18-19, 2015 Report Date: September 15, 2015 Pocatello, Idaho By: Richard Lewis A. INTRODUCTION: This test was performed at a facility that processes produced water, flowback water, site cleanup water and other waste water streams generated by the oil industry. The purpose for the facility is to separate the oil and solids from the water and then pump the water down a salt water disposal well. Revenue is generated by a service (tipping) fee that is charged to the customer and from selling the oil that is recovered from the water. The current facility uses a series of settling tanks, ponds and centrifuge to accomplish the separation process. This facility has been mandated to eliminate the settling ponds by the EPA within some time frame. Recovered Energy, Inc. (REI) conducted a demonstration test of its SOLID BOSS system to show REI s solution for a replacement system. The objectives of the test were as follows: Demonstrate a system that can eliminate the evaporation ponds. Show an ability to continuously process up to 15,000 barrels of wastewater daily based on scaling up the results of the demonstration test. Remove oil to <100 ppm. Remove solids to < 25 micron particle size. Show that the separated oil meets the quality specifications without further processing. Show that the water can be discharged without further processing. Reduce labor processing costs. B. DESCRIPTION OF THE DEMONSTRATION EQUIPMENT: The SOLID BOSS demonstration system consisted of the following: 1. A manifold that could connect to the existing pump station so that a slip stream could be taken continuously as each pump was unloaded. This allowed for continuous sampling of the truck through the entire pumping process. Demonstration Test Report 1 September 29, 2015
2 2. SOLID BOSS Separator with an oil removal option with a rated capacity of 25 gpm. The SOLID BOSS was mounted on a trailer with an air compressor, generator and holding tank as a self contained system. 3. Hoses to connect the demonstration unit to the customer pump station and discharge line. 4. Buckets and sample jars to collect samples for further processing. C. DESCRIPTION OF THE TEST: 19 truckloads were processed from customer trucks containing produced water, flowback water and ammonia water. The trucks were offloaded at a rate of about 400 gpm. 1 truckload was collected by the customer from their sumps and processed. 1 partial truckload was taken from the bottom of the existing process tanks. This was basically the solids that had settled to the bottom of the existing process tank and contained very little water. This was run straight into the SOLID BOSS. This material was high in oil, bacteria and algae and had gone anaerobic. A continuous slip stream of 25 gpm was pulled out of the trucks throughout the entire unloading period and processed in the SOLID BOSS. In total REI ran approximately 6000 gallons through the SOLID BOSS, although there was no flow meter to verify this. The estimate is based on the average length of time required to empty a truck multiplied by the number of trucks processed. Several samples were taken from the inlet water and discharge water of each truck and dumped into a bucket. This provided a representative sample of all the trucks combined. The samples were taken at the start of the pumping, at the end of the pumping and in the middle to get a representative sample. The solids that were collected by the SOLID BOSS were partially pumped into one section of the holding tank on the trailer and partially given to the customer. Demonstration Test Report 2 September 29, 2015
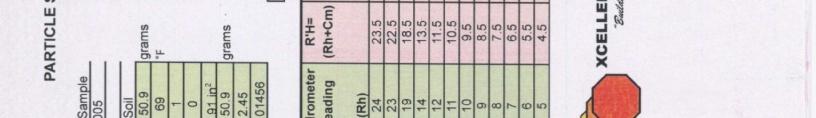
3 At the end of the test REI took back a full bucket of blended inlet water, a full bucket of blended processed discharge water, a sample of the oil that was removed and the solids that were still remaining in the holding tank. D. LAB TESTS PERFORMED: Each of the buckets to be tested were thoroughly mixed to make sure that the sample taken was representative of the entire bucket. A sample of the dirty inlet (raw) water was sent to American West Analytical Laboratories (AWAL) to measure the amount of oil and grease. A sample of the processed discharge water was sent to AWAL to measure the amount of oil and grease. A sample of the solid discharge slurry was sent to AWAL to measure the amount of oil and grease. A sample of the discharge water was sent to Dixon Information to take a microscopic photograph of the solids in the discharge water. The solids were filtered out of the water and then photographed under a microscope to analyze the particle size of the solids in the discharge water. The facility provided a sample of water after their process is complete as a representative sample of what they are currently discharging down the disposal well. A sample of this water was also sent to Dixon Information to be photographed under the microscope. We did not test the oil left in this sample. (It should be noted that another sample was provided of their discharge water. The first sample contained significant amounts of oil and solids. We did not do any testing of the first sample. We cannot say which sample is more representative of the current system.) About 11 lbs of the solids were dried in an oven and then sent to Xcell Engineering (soils testing engineer) to determine the particle size of the solids removed. As part of the test Xcell burned off any organic material (mostly hydrocarbons) to get down to inert solids. The solids were first run through sieves up to a No. 200 sieve. An additional sample was tested with a hydrometer. E. TEST RESULTS: The demonstration test was operated continuously with no interruptions other than waiting to hook up another truck. (Some of the breaks were as much as an hour between trucks.) The test was done with very little operator interference from REI other than getting the system set up and taking samples. The system operated automatically. The inlet raw water contained 16,500 ppm oil and grease. The SOLID BOSS discharge water contained 119 ppm oil and grease. It should be pointed out that the final system will achieve better results for the following reasons: 1. The Demonstration Unit was located 20 feet from the truck pump a large centrifugal pump that emulsified the oil down to about 22 micron particle size (see picture to right showing the location of the test unit adjacent to the pump house.) The demonstration test had only a couple Demonstration Test Report 3 September 29, 2015
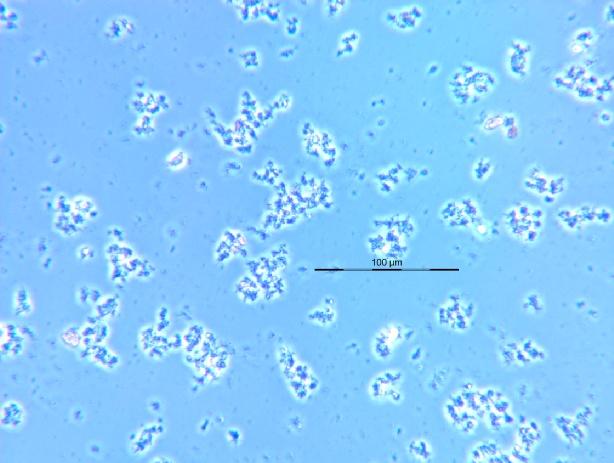
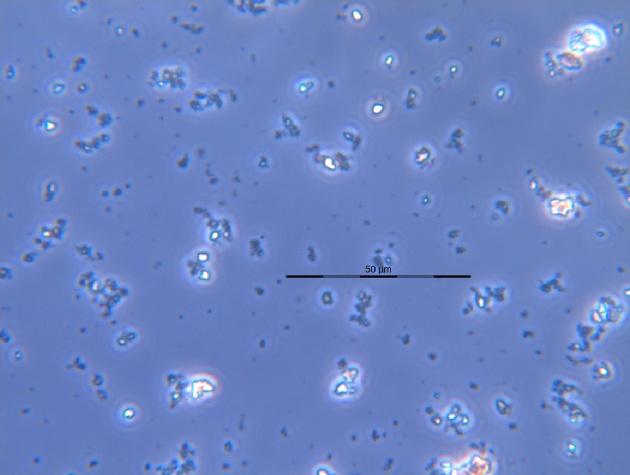
4 seconds of time for the mechical emulsion to break before it entered the system. The final system will be further away from the pump, will have a manifold system and several minutes of time for the mechanical emulsion to break. 2. The Demonstration Unit only had about 5 minutes residence time inside the clarifier. The final system will have > 15 minutes residence time running at full capacity. Most of the time the residence time will be significantly more than 15 minutes because there will always be gaps where the system will be running below full design. 3. The Demonstration Unit did not add any kind of de-emulsifier. The facility is currently adding de-emulsifiers to their inlet water. That is an option of the new system as well and would result in removing more oil. The solids blowdown slurry (about 60-70% water) contained 71,800 ppm oil and grease as analyzed by AWAL. The dried sample from Xcell Engineering shows 24.7% oil in the bone dry solids. The particle size of the solids removed based on the sieve test was 38% smaller than 74 micron.. The particle size of the solids removed based on the hydrometer test was 48% smaller than 74 micron. 29% was smaller than 25 micron and 10% was smaller than 1.5 micron. The particle size of the solids in the sample discharge water given to us by the facility was mostly a similar size maybe just slightly larger, but well below a 25 micron average. (Note: When looking at the photograph consider that some of the particles that look larger are actually multiple particles clumped together or on top of each other.) The particle size of the solids in the SOLID BOSS discharge water based on the microscopic photograph was about the same size (maybe slightly smaller) compared to the 2 nd sample of the discharge water given to us by the facility. We can conclude that both processes removed the solids down to below the 25 micron limit. (Statistically there is no difference.) According to facility personnel the oil coming off the top of the test unit was good enough to sell to the refinery without being further processed. No test was done of this oil. The solids have a very high concentration of oil. A de-emulsifying system could remove the oil in the dirt down to <1%, but REI did not demonstrate that. Further economic analysis would be required to determine whether the economics of the de-emulsifier would warrant the cost. That analysis was not part of this test. The test found large amounts of bacteria and algae. The water from the last 2 trucks was totally black mostly from bacteria and algae, not oil. The expected results based on the test equipment design is shown in the attached Flow Design Table. According to the design of the equipment REI would have expected to remove solids down to about 28 micron particle size. Actual performance was better than expected. REI would have expected to remove oil down to about 113 micron particle size. Without more data we cannot relate that to a ppm number. Attachments: 1. Test reports from AWAL. 2. REI sample microscopy report from Dixon Information 3. Injection water microscopy report from Dixon Information 4. Test report from Xcell 5. Flow Design Table for the test unit. 6. Flow Design Table for the recommended unit. Demonstration Test Report 4 September 29, 2015


5 Demonstration Test Report 5 September 29, 2015
6 Demonstration Test Report 6 September 29, 2015

7 Demonstration Test Report 7 September 29, 2015
8 Demonstration Test Report 8 September 29, 2015
9 Mr. Dave Decato Recovered Energy Inc Rio Vista Rd Dear Mr. Decato: The sample labeled REI discharge water 9/9/2015 was photographed using phase contrast microscopy after being ashed and sonicated in purified water by Dixon Information. A disposable pipette was used to pull out a small amount of material while it was being sonicated for slides and photography. The micron mark distance has four divisions, the measurement is for all four. Sincerely, Steve Dixon Demonstration Test Report 9 September 29, 2015

10 Demonstration Test Report 10 September 29, 2015


11 Demonstration Test Report 11 September 29, 2015

12 Demonstration Test Report 12 September 29, 2015
13 Mr. Dave Decato Recovered Energy Inc Rio Vista Rd Dear Mr. Decato: The sample labeled injection well water 3 Sept 2015 was photographed using phase contrast microscopy after being ashed and sonicated by Dixon Information. A disposable pipette was used to pull out a small amount of material while it was being sonicated for slides and photography. The micron mark distance has four divisions, the measurement is for all four. Sincerely, Steve Dixon Demonstration Test Report 13 September 29, 2015


14 Demonstration Test Report 14 September 29, 2015

15 Demonstration Test Report 15 September 29, 2015


16 Demonstration Test Report 16 September 29, 2015


17 Demonstration Test Report 17 September 29, 2015


18 Demonstration Test Report 18 September 29, 2015


19 Demonstration Test Report 19 September 29, 2015


20 Demonstration Test Report 20 September 29, 2015


21 Demonstration Test Report 21 September 29, 2015


22 Demonstration Test Report 22 September 29, 2015


23 Demonstration Test Report 23 September 29, 2015
24 Demonstration Test Report 24 September 29, 2015