How much does Kansas rangeland burning contribute to ambient O 3 and PM 2.5?
|
|
|
- Mildred Robbins
- 5 years ago
- Views:
Transcription
1 How much does Kansas rangeland burning contribute to ambient O 3 and PM 2.5? - Analysis of data from 21 to 216 Dr. Zifei Liu zifeiliu@ksu.edu Rangeland burning smoke management and air quality workshop April 3rd, 217 Biological and Agricultural Engineering

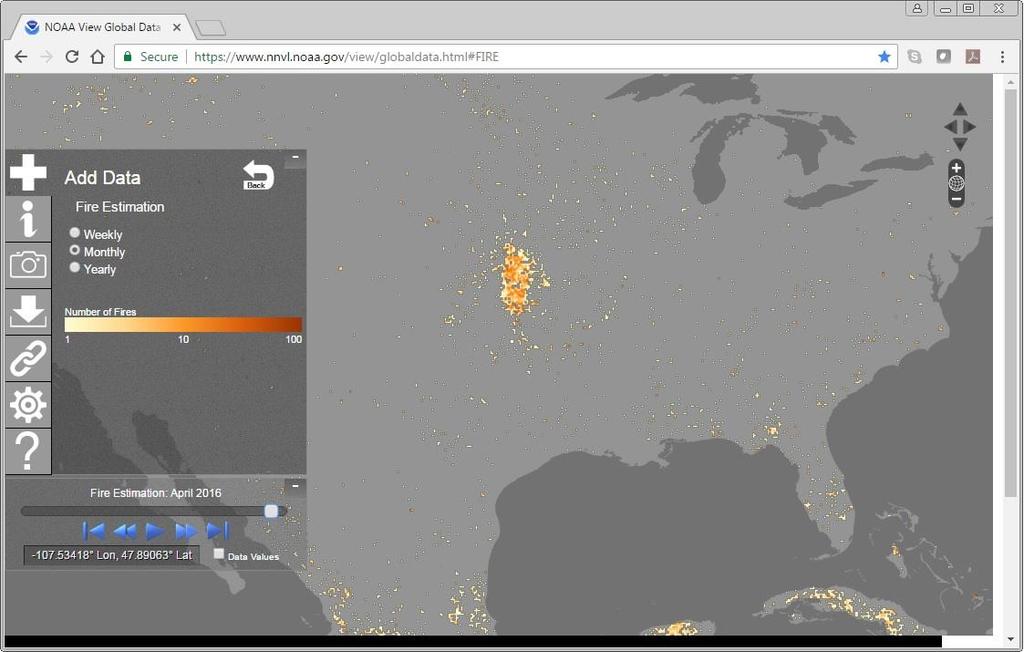
2 Satellite fires 2

3 3


 3 2")


4 2/15-5/15, 22 2/15-5/15, 23 2/15-5/15, 24 2/15-5/15, 25 2/15-5/15, 26 2/15-5/15, 27 4 Acres Burned (Million)


 3 2")


5 2/15-5/15, 28 2/15-5/15, 29 2/15-5/15, 21 2/15-5/15, 211 2/15-5/15, 212 2/15-5/15, Acres Burned (Million)


6 2/15-5/15, 214 2/15-5/15, 215 2/15-5/15, 216 April 1, 215 April 3-4, 216 April 13, 216 Chanute O 3 : 77ppb 4 Sedgwick O 3 : 78ppb Wichita O 3 : 13ppb Topeka O 3 : 64ppb Acres Burned (Million)


7 Smoke and air quality PM 7-9% PM2.5 H 2 O SVOC Complete combustion Combustion Organic irritants CO 2 VOC Toxic CO NO x Form O 3 in the presence of sunlight 7
8 Air pollutants Observed concentrations in literature At the fires At downwind communities Standards PM μg/m μg/m 3 a 35 μg/m 3 Acrolein ppm.9 ppm c.1 ppm Formaldehyde ppm ppm c.16 ppm Isocyanic acid - 6 ppb - PAHs - - d 2 μg/m 3 BaP μg/m 3.7 μg/m 3 - Acenaphthene μg/m μg/m 3 - Naphthalene μg/m μg/m 3 - Phenanthrene.38 μg/m CO 1-14 ppm 1-6 ppm b 9 ppm O 3 - Up by 5 ppb b 7 ppb a. NAAQS 24-hr standards; b. NAAQS 8-hr standards; c. NIOSH 8-hr exposure limits; d. OSHA 8-hr exposure limits 8
 Sulfur Dioxide (SO 2 ) Carbon Monoxide (CO) Lead (Pb) Five year review cycle Nonattainment area State Implementation Plan (SIP) http://www.epa.")
9 Clean Air Act (CAA) Regulations National Ambient Air Quality Standards (NAAQS) Six criteria air pollutants Particulate Matter (PM) Ozone (O 3 ) Nitrogen Dioxide (NO 2 ) Sulfur Dioxide (SO 2 ) Carbon Monoxide (CO) Lead (Pb) Five year review cycle Nonattainment area State Implementation Plan (SIP)
10 Evolution of O 3 standards 8-hour 1-hour ppb ppb 28 75ppb 215 7ppb Biological and Agricultural Engineering 1
11 Evolution of PM standards Annual 24-hour 1971 TSP 75 µg/m 3 26 µg/m PM 1 5 µg/m 3 15 µg/m PM µg/m 3 65 µg/m 3 26 PM µg/m 3 35 µg/m PM 2.5 Primary 12 µg/m 3 Secondary 15 µg/m 3 35 µg/m 3 Biological and Agricultural Engineering 11
12 Kansas O 3 monitoring sites Nine grey dots: Kansas O 3 monitoring network Yellow dot: Konza Prairie research site Purple lines: perimeter of the Flint Hills region 12
13 Design value a statistic of air pollutant concentrations. used to compare with air quality standards and to designate nonattainment areas. The design value of O 3 the annual fourth-highest daily max 8-hour concentration, averaged over 3 years. Biological and Agricultural Engineering 13
14 Kansas 8hr O 3 design values (ppb) 8 75 Old standard 7 New standard 65 6 Kansas City JFK Heritage park Leavanworth Wichita HD Peck Sedgwick Average Topeka KNI 3-5 Average 4-6 Average Cedar Bluff 5-7 Average 6-8 Average 8-1 Average 9-11 Average 1-12 Average Average (Data from KDHE, 21 and Year Ambient Air Monitoring Network Assessment ) Average 14
15 O 3 at the Konza Prairie research monitoring site (22-213) Clean Air Status and Trends Network (CASTNET) 15
16 Daily max 8hr O 3 at the Konza Prairie site (22-213) 16
17 O 3 (ppb) Highest 8hr O 3 in April vs. acres burned (Konza Prairie site) y = x R² = Acres burned (Million) Acres burned (Million) O 3 (ppb) 17
18 Number of days with 8hr O 3 >7ppb in April vs. acres burned (Konza Prairie site) # of days with O 3 >7ppb Acres burned (Million) R² = Acres burned (Million) # of days with O 3 >7ppb 18
19 8hr O 3 at the Konza Prairie site (22-213) O 3 >7ppb occurred in all years when acres burned 2 million (except 29). O 3 >7ppb did not occur for all years when acres burned < 1 million. Biological and Agricultural Engineering 19
")
20 Daily max 8hr O 3 at the Wichita Health Department site (21-216) 2
21 Highest 8hr O 3 in April vs. acres burned at the three sites around Wichita y = 8.86x R² =.7455 Sedgwick site (29-216) O 3 (ppb) y = x R² = Wichita Health Department site (21-216) y = 5.983x R² = Peck site (21-216) Acres burned (Million) 21
22 Number of days with 8hr O 3 >7ppb in April vs. acres burned at the three sites around Wichita R² =.4136 Sedgwick site (29-216) # of days with O 3 >7ppb R² = Wichita Health Department site (21-216) R² = Acres burned (Million) Peck site (21-216) 22
23 Daily max 8hr O 3 in April at the Wichita Health Department site (21-216) 23
24 8hr O 3 at the three sites around Wichita (21-216) When acres burned 1.9 million, O 3 >7ppb may occur. When acres burned < 1.9 million, O 3 >7ppb did not occur. Biological and Agricultural Engineering 24

25 Daily max 8hr O 3 at the Kansas City JFK site (21-216) 25
26 Highest 8hr O 3 in April vs. acres burned at the three sites around Kansas City y = x R² = Leavenworth site (24-216) O 3 (ppb) y = x R² = Kansas City JFK site (21-216) y = x R² = Heritage Park site (24-216) Acres burned (Million) 26
27 # of days with O 3 >7ppb Number of days with 8hr O 3 >7ppb in April vs. acres burned at the three sites around Kansas City R² =.65 R² = Leavenworth site (24-216) Kansas City JFK site (21-216) R² = Heritage Park site (24-216) Acres burned (Million) 27
28 Daily max 8hr O 3 in April the Kansas City JFK site (21-216) 28
29 8hr O 3 at the three sites around Kansas City (21-216) When acres burned 1.9 million, O 3 >7ppb may occur (with less chance than the Wichita sites). When acres burned < 1.9 million, O 3 >7ppb did not occur (with only one exception at the Leavenworth site). Biological and Agricultural Engineering 29
30 Daily max 8hr O 3 at the Topeka site (26-216) 3
31 Daily max 8hr O 3 in April at the Topeka site (26-216) Biological and Agricultural Engineering 31
32 Number of days with 8hr O 3 >7ppb in April vs. acres burned at all the ten sites # of days with O 3 >7ppb R² = Acres burned (Million) When acres burned 1.9 million, O 3 >7ppb occurred at least at one of the 1 sites. When acres burned < 1.1 million, O 3 >7ppb did not occur. 32
33 Factors that affect ambient O 3 Seasonal cycle O 3 on the previous day Air temperature Solar radiation Relative humidity Wind speed Biological and Agricultural Engineering 33
34 O 3 (ppb) 34 Daily max 8hr O 3 at the Konza Praire site hr O 3 standard 1/1/22 1/1/23 1/1/24 1/1/25 1/1/26 1/1/27 1/1/28 1/1/29 1/1/21 1/1/211 1/1/212 1/1/213
35 O 3 on non-rainy days O 3 (d) = sin +.47O 3 (d) 2π d O 3 on the previous day +.17T max +.13(T max -T min ) -15.6RH -.57V Daily max air temperature Air heated by solar radiation R 2 =.71 Biological and Agricultural Engineering 35
36 O 3 on rainy days O 3 (d) = sin +.44O 3 (d) +.15T max +.29(T max -T min ) -25.5RH -.64V 2π d O 3 on the previous day Daily max air temperature Air heated by solar radiation R 2 =.68 Biological and Agricultural Engineering 36
37 8hr O 3 at the Konza Prairie site (22-213) Annual average April average (rainy days) April average (non-rainy days) Measured O 3 (ppb) Modeled O 3 (ppb) Residual (ppb) Likely due to burning Biological and Agricultural Engineering 37
38 Multi-year average O 3 at different sites (non-rainy days in April ) Measured O 3 (ppb) Modeled O 3 (ppb) Highest model R 2 at Cedar Bluff, lowest burning interference, R 2 =
39 Average O 3 model residuals in April (non-rainy days) (Likely due to burning) Konza Prairie site Topeka site Three Wichita sites Three Kansas City sites Cedar Bluff site 3.1 ppb 2.4 ppb.7, 1.3, 1.7 ppb.4, 1.2, 1.5 ppb.7 ppb Biological and Agricultural Engineering 39
40 Average of days with O 3 >7ppb in April (47 days in total) April average Daily Max 8hr O 3 77±5 ppb ppb O 3 on the previous day 6±11 ppb - Daily maximum air temperature 24.5±4.5 ºC 2.7±5.5 ºC T max -T min 16.6±5.3 ºC 12.3±5. ºC Solar radiation 738±279 Langley 67±34 Langley Relative humidity 54±1 % 67±14 % Wind speed 3.4±1.8 m/s 4.1±2. m/s Likely due to burning O 3 model residuals 21±9 ppb - Biological and Agricultural Engineering 4
41 PM 2.5 from smoke ~7 to 9% of smoke particles is PM 2.5. Include primary particles and secondary organic particles that are formed through gas-to-particle conversion processes. Acts as a vehicle to carry adsorbed hazardous compounds into the respiratory tract. Could have greater health impact than normal urban particles. Biological and Agricultural Engineering 41
 Biological and Agricultural Engineering")
42 PM 2.5 speciation data at the Tallgrass IMPROVE site IMPROVE: Interagency Monitoring of Protected Visual Environments Tallgrass (22-214) Biological and Agricultural Engineering 42


43 Annual average contributions to PM 2.5 from the five source categories at the Tallgrass site S1-Nitrate/agricultural 22% S2-Sulfate/industrial 3% S3-Crustal/soil 14% S5-Secondary organic particles 29% S4-Primary smoke particles 5% Results of receptor modeling 43
44 PM 2.5 (µg/m 3) Monthly variation of PM 2.5 contributions from the five source categories at the Tallgrass site % 11% S5:Secondary organic particles S4-Primary smoke particles S3:Crustal/soil S2:Sulfate/industrial S1:Nitrate/agricultural 4 2 Jan. Feb. Mar. Apr. May Jun. Jul. Aug. Sep. Oct. Nov. Dec. 44
45 PM 2.5 (µg/m 3 ) PM 2.5 (µg/m 3 ) S1: Nitrate/Agricultural Jan. Feb. Mar. Apr. May Jun. Jul. Aug. Sep. Oct. Nov. Dec. Featured with high nitrate associated with NH 3 emissions. High in winter and low in summer. Can be modeled using meteorological predictors. 45
46 PM 2.5 (µg/m 3 ) PM 2.5 (µg/m 3 ) S2-Sulfate/Industrial Jan. Feb. Mar. Apr. May Jun. Jul. Aug. Sep. Oct. Nov. Dec. Featured with high sulfate associated with SO 2 emissions. Decreasing trend reflected regulation effects. High in summer due to photochemistry effect and presence of oxidants on secondary sulfate formation. 46
47 S2-Sulfate/Industrial 47
48 48

49 (from KDHE, Year Ambient Air Monitoring Network Assessment ) 49
50 PM 2.5 (µg/m 3 ) PM 2.5 (µg/m 3 ) S3-Crustal/Soil Jan. Feb. Mar. Apr. May Jun. Jul. Aug. Sep. Oct. Nov. Dec. Identified by soil elements (Si, Fe, Al, ). Spikes were observed on windy days. 5
51 PM 2.5 (µg/m 3 ) PM 2.5 (µg/m 3 ) S4-Primary smoke particles /12/23 4/15/24 4/8/26 4/16/25 4/9/27 4/21/28 4/3/212 4/5/214 4/22/29 4/11/214/18/ Likely due to burning Average contribution in months excluding April. Jan. Feb. Mar. Apr. May Jun. Jul. Aug. Sep. Oct. Nov. Dec. Characterized mainly by non-soil potassium. Spikes were consistently observed in April. 51
52 S4-Primary smoke particles 52
53 PM 2.5 (µg/m 3 ) PM 2.5 (µg/m 3 ) S5-Secondary organic particles /9/23 4/16/25 4/9/27 4/6/24 4/8/26 4/21/28 4/11/21 4/18/211 4/5/ Likely due to burning Average contribution in months excluding April Jan. Feb. Mar. Apr. May Jun. Jul. Aug. Sep. Oct. Nov. Dec. Identified by large OC/EC ratio. S5 correlated with S4 with Pearson correlation coefficient of
54 S5-Secondary organic particles 54
55 Importance of secondary organic particles Mass of secondary organic particles from burning 4 Mass of primary smoke particles Biological and Agricultural Engineering 55
56 Average S4 and S5 in April vs. acres burned (Tallgrass site) S4-Primary smoke particles (μg/m 3 ) S5-Secondary organic particles (μg/m 3 ) y =.397x R² = Acres burned (Million) y = x R² = Acres burned (Million) 56
57 Highest S4 and S5 in April vs. acres burned (Tallgrass site) S4-Primary smoke particles (μg/m 3 ) y =.6281x R² =.46 S5-Secondary organic particles (μg/m 3 ) Acres burned (Million) y = x R² = Acres burned (Million) 29 57
58 Highest PM2.5 in April vs. acres burned (Tallgrass site) PM 2.5 (μg/m 3 ) y = x R² = Acres burned (Million) When acres burned 2.5 million, PM 2.5 >35µg/m 3 may occur. When acres burned < 2.5 million, PM 2.5 >35µg/m 3 did not occur. 58
59 O 3 and PM 2.5 O 3 and PM 2.5 controls are traditionally considered separately because their high pollution periods are not concurrent on seasonal timescales O 3 usually peaking in summer and PM 2.5 often peaking in winter. Higher temperature and lower RH promote O 3 formation but cause volatilization of nitrate aerosols. Biological and Agricultural Engineering 59
60 O 3 (ppb) PM 2.5 (µg/m 3 ) Daily max 8hr O 3 at the Konza Praire site 8hr O 3 standard 1/1/22 1/1/23 1/1/24 1/1/25 1/1/26 1/1/27 1/1/28 1/1/29 1/1/21 1/1/211 1/1/212 1/1/ Daily PM 2.5 at the Tallgrass site 24hr PM 2.5 standard
61 Daily max 8hr O 3 Meteorological effect modeling Daily O 3 residuals Daily PM 2.5 Poor correlation Receptor modeling P<.1 Significant effect P<.1 Daily S1, S2, S3, S4, S5 61
62 Influence of O 3 from the previous day Weather conditions S4-Primary smoke particles S5-Secondary organic particles VOCs+ NO x O 3 Interaction S2- Sulfate/Industrial Existing pollutants 62