IPCC WG1 AR5 Report & its relevance to Southeast Asia region
|
|
|
- Alvin Cox
- 5 years ago
- Views:
Transcription
1 IPCC WG1 AR5 Report & its relevance to Southeast Asia region Yann Arthus-Bertrand / Altitude Fredolin Tangang IPCC WG1 Vice-Chair
2 IPCC WG1 AR5 Climate Change 2013: The Physical Science Basis The IPCC has released its WG1 AR5 Climate Change 2013: The Physical Science Basis on 27 Sept 2013 in Stockholm, Sweden The Summary for Policymakers (SPM) can be downloaded from the IPCC website hip:// and This lecture highlights key findings of the report [SPM, TS, Underlying chapters] Cover Page: Folgefonna glacier on the high plateaus of Sør8orden, Norway (60 14 N, 6 44 E).
3 Outline IPCC: Historical perspecsves, roles & funcsons, assessment process Key findings based on observasons DetecSon and airibuson Future climate projecsons Relevance to Southeast Asia region Summary


4 Global Warming / Climate Change These four questions were not easy to answer What is the status of climate change? What are the causes? How can we be affected? How can we mitigate and adapt? In fact IPCC was established by the United Nation 25 years ago to provide answers to these questions
5 Inter-governmental Panel on Climate Change (IPCC) IPCC plenary comprises of all countries in the world IPCC Bureau comprises of 30 elected members with variable numbers for each of the WMO region; IPCC elects its bureau members once in a 6-7 years cycle 3 working groups & a Task Force on NGGI Authors, Contributors, Reviewers, Review Editors
")
6 Inter-governmental Panel on Climate Change (IPCC)
7 Why IPCC? Prior to the establishment of IPCC, growing number of literatures indicate the Earth s climate system is warming due to increasing GHG concentration in atmosphere Independent, objective, fair and transparent assessment of the state of global climate system is required For this reason, United NaSons General Assembly (UNGA) 42 proposed the establishment of IPCC and in 1988 IPCC was established under WMO and UNEP The IPCC provides such assessment and this becomes the source of information particularly to policy makers and UNFCCC on 1. Causes of climate change, 2. Potential impacts on built and natural systems and socio-economic, 3. Possible response options.


8 IPCC Reports FAR 1990 AR5 WGI 2013 SAR 1995 AR5 WGII 2014 TAR 2001 AR AR5 WGIII 2014


9 IPCC Special Reports SRREN (2011) SREX (2012)


10 How IPCC produces these reports? Independent research, Knowledge generation, publication of literatures by Scientific community IPCC Assessment Process IPCC Assessment Report IPCC doesn t involve at this stage


11 IPCC Assessment Process IPCC assessment is based on available peer- reviewed publicasons

12 Key SPM Messages 19 Headlines on less than 2 Pages Summary for Policymakers ~14,000 Words 14 Chapters Atlas of Regional Projections 54,677 Review Comments by 1089 Experts 2010: 2009: 259 Authors Selected WGI Outline Approved 12

13 The RelaSve Comprehensiveness of IPCC WG1 AR5
14 Key Statement / Headline of IPCC WG1 AR5 SPM Warming of the climate system is unequivocal, and since the 1950s, many of the observed changes are unprecedented over decades to millennia. The atmosphere and ocean have warmed, the amounts of snow and ice have diminished, sea level has risen, and the concentrations of greenhouse gases have increased

15 The globally averaged surface temperature data as calculated by a linear trend, show a warming of 0.85 [0.65 to 1.06] C over Each of the last three decades has been successively warmer at the Earth s surface than any preceding decade since In the Northern Hemisphere, was likely the warmest 30-year period of the last 1400 years (medium confidence) (IPCC 2013, Fig. SPM.1a)
 Increase trend ~ 1.0oC per century over Southeast Asia region")
16 Warming in the climate system is unequivocal (IPCC 2013, Fig. SPM.1b) Increase trend ~ 1.0oC per century over Southeast Asia region

17 Multiple evidences Temperature é Ocean heat content é Sea Level é Snow Cover ê Glacier ê (IPCC Fig TS.1) Arctic Sea-ice extent ê

18 Wetter region became more wetter and drier become more drier since the second half of the 20 th century (IPCC Fig SPM.2) Extreme weather & climate events became more frequent

19 Glaciers and ice melting has accelerated in unprecedented speed in the last decade (IPCC Fig TS.3)
20 40% increase since pre-industrial period Ocean absorbed 30% of these emitted CO2 (IPCC Fig SPM.4a) The atmospheric concentrations of carbon dioxide (CO 2 ), methane (CH 4 ), and nitrous oxide (N 2 O) have increased to levels unprecedented in at least the last 800,000 years.
21 Ocean became more acidic (IPCC Fig SPM.4b)
 Positive à near-surface")
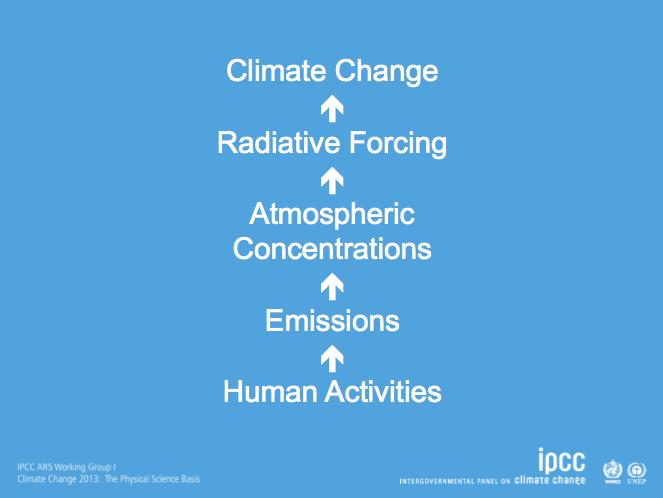
22 What is Radiative Forcing? Change in energy flux caused by natural or anthropogenic drivers of climate change (in Wm -2 ) Positive à near-surface warming; Negative à cooling Puts various drivers on common scale, indicates magnitude of impact

23 Except volcanic, changes gradual Anthro. faster since ~1970, CO2 largest every decade since 1960s Time-averaged natural forcing small (IPCC Fig 8.18)
")
24 (IPCC Fig TS.6)
")
25 (IPCC Fig 8.20)
26 Earth has been in radiative imbalance, with more energy from the sun entering than exiting the top of the atmosphere, since at least circa It is virtually certain that Earth has gained substantial energy from More than 90% of this extra heat is absorbed by the ocean (high confidence)

27 Detection and Attribution The complexity of climate model over time (IPCC Fig 1.13)


28 Climate Models Responses to Various Forcings Natural + Anthropogenic Natural CO2 forcing only (IPCC Fig TS.9)
")
29 (IPCC Fig 10.7)

30 Human influence on the climate system is clear (IPCC Fig SPM.6)
31
32 Future Climate Projections For future climate projections, climate models require Emission Scenarios. Models in AR5 use Representative Concentration Pathway (RCP)
33 Indicative Anthropogenic Radiative Forcing (RF) for RCPs RCP= Representative Concentration Pathway (IPCC Box TS.6)
 The temperature increase during the last 100 years was only about 0.")
34 Projected Global Average Temperature Change by end of 21 st Century (IPCC Fig SPM.7a) The temperature increase during the last 100 years was only about 0.8 o C.

 The temperature increase during the last 100 years")
35 Projected Global Average Temperature Change by end of 21 st Century 3-5 o C projected increase over Southeast Asia Region (IPCC Fig SPM.8a) The temperature increase during the last 100 years is only about 0.8 o C.

36 Projected Air Temperature (DJF) (RCP4.5)

37 Projected Average DJF Temperature Change Over Southeast Asia Region (Land)

38 Projected Air Temperature (JJA) (RCP4.5)

39 Projected Average JJA Temperature Change Over Southeast Asia Region (Land)

40 Projected Precipitation Change by end of 21 st Century Some regions will become more wetter and others become more drier. Extreme weather / climate events will (IPCC Fig SPM.8b) become more frequent and intense

41 Arctic will be nearly ice-free by the end of the 21 st (IPCC Fig SPM.8c) century
42 (IPCC Fig TS.20a)

43 Ocean will be more acidic by the end of the 21 st century (IPCC Fig TS.20b)

44 Global mean sea level will continue to rise during the 21st century (IPCC 2013, Fig. SPM.9)

45 m projected SLR around Southeast Asia region IPCC 2013 Fig 13.20b

 25 o N PACIFC OCEAN 0 o")

 ---- Interannual oscillation (2-7")
")
46 Monsoon & Dominant Modes of Climate Variability Description of slide / Title of slide SWM (Late May to Sept) 50 o N NEM (Nov to March) 25 o N PACIFC OCEAN 0 o INDIAN OCEAN 25 o S 50 o S 50 o E 100 o E 150 o E 160 o W 110 o W 60 o W Indian Ocean Dipole (IOD), El Nino-Southern Oscillation (ENSO) ---- Interannual oscillation (2-7 years) Madden-Julian Oscillation (MJO) intra-seasonal oscillation (20-60 days) UNIVERSITI KEBANGSAAN MALAYSIA
 Juneng and Tangang (Clim Dyn.")
47 Typical evolution anomalous SST associated with an El Nino ( La Nina) Juneng and Tangang (Clim Dyn. 2005)
 Salimun, Tangang & others (2013, Int. J.")
48 Composites of Rainfall Anomaly during Convention al El Nino (a) & El Nino Modoki (b) Salimun, Tangang & others (2013, Int. J. Climatol.)

49 Schematic Representation of MJO eastward propagation from Indian Ocean to western Pacific Ocean
50 El Niño-Southern Oscillation (ENSO) IPCC AR5 Chapter 14 There is high confidence that ENSO will remain the dominant mode of interannual variability in the tropical Pacific, with global effects in the 21st century. Due to the increase in moisture availability, ENSO-related precipitation variability on regional scales will likely intensify.
51 How Southeast Asia region could be affected in the future? Warmer temperature More intense precipitation events Large variations of rainfall and temperature associated with ENSO Changes in monsoon Sea level rise Warmer ocean & acidification
 Limiting climate change will require substantial and sustained")
52 2 o C limit (IPCC 2013, Fig. SPM.10) Limiting climate change will require substantial and sustained reductions of greenhouse gas emissions
53 RCP2.6 would be the Emission Scenario to follow if we were to cap warming at 2 o C Can the world follow RCP2.6?

54 November 11-22, 2013, Warsaw, Poland Urging all Parties to the Kyoto Protocol to ratify and implement the Doha Amendment to the Kyoto Protocol as a matter of urgency
55 SUMMARY Warming of the climate system is unequivocal, and since the 1950s, many of the observed changes are unprecedented over decades to millennia. The atmosphere and ocean have warmed, the amounts of snow and ice have diminished, sea level has risen, and the concentrations of greenhouse gases have increased Human influence on the climate system is clear Continued emissions of greenhouse gases will cause further warming and changes in all components of the climate system. Global surface temperature change for the end of the 21st century is likely to exceed 1.5 C relative to 1850 to 1900 for all RCP scenarios except RCP2.6. Limiting climate change will require substantial and sustained reductions of greenhouse gas emissions
56 Yann Arthus-Bertrand / Altitude Further Information