3.0 Existing Mine Water Management System
|
|
|
- Domenic Mason
- 5 years ago
- Views:
Transcription
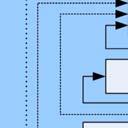
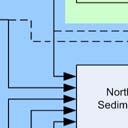
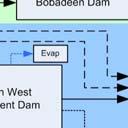
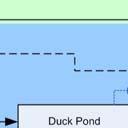
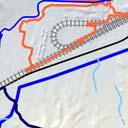
1 Existing Mine Water Management System 3.0 Existing Mine Water Management System UCML has an extensive mine water management system, which includes mine dewatering systems, water storages, the Bobadeen Irrigation Scheme, a water treatment facility, sedimentation and retention basins, settlings and tailings ponds, drains, levee banks and earth bunding around the main stockpile, laydown hardstand areas and fuelling areas. As discussed in Section 2.1.1, a major diversion of Goulburn River was established in 1982 as part of previous operations. Other key functions of the mine water management system include: divert clean water around mining operations to prevent the contamination by mining activities; reducing the discharge of pollutants from the mine to the environment; minimising adverse effects on the Goulburn River and Ulan Creek (i.e. hydraulic and water quality impacts); managing approved water discharges to meet licence conditions; controlling the diversion of non-mine impacted waters away from mining activities to reduce the volume of mine impacted water; and segregating mine impacted water from better quality water to minimise the volume of mine impacted water that requires recycling and treatment. A layout of the key components of the Ulan Mine Water Management System in relation to surrounding drainage systems is shown on Figure 1.5. A schematic of the mine water management system is shown in Figure 3.1. The existing mine water management system will continue to be used to control and treat runoff from the site with all pit water and mine surface runoff directed to the mine water management system. The capability of the mine water management system to contain and manage water associated with the Project is addressed in Section Overview The main sources of water for the Ulan complex are rainfall into the open cut mining area and dirty water catchments and groundwater inflows to the underground mining operations. Some of the water flowing into the open cut area may flow through to groundwater, however the majority of the water flows into the mine water management system. Groundwater inflows to the underground mine area are directed to the mine water management system. The extraction of groundwater is licensed under Part 5 of the Water Act 1912 which currently provides for extraction of up to 4000 ML per year (UCML applied to Department of Water & Energy in February 2007 to seek an increase to this limit in accordance with previous Environment Impact Assessment predictions). Potable water needs for the site are provided from external sources when and where required and through the extraction of groundwater from an on-site borehole under licence 20BL The extracted water is treated through the Millers Dam Water Treatment Facility and used for potable water and facilities such as the bathhouse and for some underground mining operations. Current potable water usage on site is in the order of 50 ML per year. 2423/R06/Final October


2
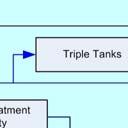
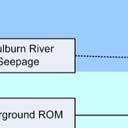
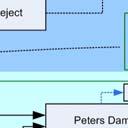
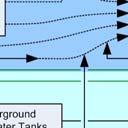
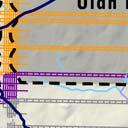
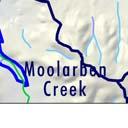
3 Existing Mine Water Management System Sewage treatment at UCML is provided by dedicated Sewage Treatment Plants (STPs) at both the open cut facilities and the underground facilities. The STPs both have primary and secondary treatment systems. Effluent from the STPs is irrigated on dedicated land located within the mine water management system (presently used for the open cut facilities) or retained in a series of oxidation ponds (as used at the Ulan No. 3 surface facilities). Moolarben Creek Dam is a catchment dam located to the south of Ulan Road (refer to Figure 1.5). The pipeline connecting the Moolarben Creek Dam to the mine water management system is currently disconnected at the dam. Riparian flows are released from Moolarben Creek Dam in accordance with the UCML water licence for this structure. Water within the mine water management system is used to support the mining operation. The associated infrastructure has been developed to facilitate the efficient use and re-use of this water. The infrastructure components include water storage areas, transfer pipelines, water treatment plants and water recovery systems. The underground voids, particularly the Main North Underground Void (located in the northern section of Ulan No. 3 underground) (refer to Figure 3.1), are key water storage facilities within the mine water management system. Current available storage capacity with the underground voids is approximately 1400 ML. Water is pumped into the underground for use in the mining operations from other storage areas such as the Bobadeen Dam via the Bobadeen service borehole facility and Rowans Dam via the Treble Tanks. Water from the West Pit spoil area flows to Ulan No. 3 underground as seepage. The East Pit is also a key water storage area with a capacity in excess of 3400 ML. The East Pit holds catchment and s from disturbed areas around the pit, excess water pumped from other storage areas including Peters Dam (underground ROM stockpile area), Shearers Dam (i.e. the coal preparation area) and Rowans Dam plus water recovered from East Pit Tailings Dam. The southern section of the East Pit is used as a tailings emplacement area with the decant water flowing into the water storage area in the northern section of the East Pit. The major water demands or losses within the mine water management system are the Coal Handling and Preparation Plant (CHPP), dust suppression and evaporation. Water for the CHPP is supplied via Rowans Dam to the CHPP Lagoons. Approximately 251 L per tonne of ROM coal is used in the CHPP for washing coal. With recovery of tailings, decant water from the East Pit Tailings Dam and South 5 Tailings Dam (now decommissioned), the net water usage for coal handling and processing was approximately 150 L per tonne (2007 and 2008). Surplus water is either discharged to Ulan Creek following treatment or used within the Bobadeen Irrigation Scheme. Water discharged to Ulan Creek is passed through the Mixing Dam where it can be mixed with water treated by the Bobadeen Water Treatment Facility in order to achieve discharge criteria as per EPL No Approximately 55 per cent of the water discharged from the site during the 2007/2008 period was discharged to Ulan Creek at the Bobadeen licensed discharge point and approximately 45 per cent was used for irrigation within the Bobadeen Irrigation Scheme. Key surface infrastructure components within the mine water management system are Rowans Dam and Bobadeen Dam. These dams play an important role in the surplus water management strategy for the Ulan complex and facilitate the off-site discharge of surplus water (refer to Section 3.3). The East Pit and the underground storage areas are also key infrastructure components as they facilitate the storage of water to be recycled and used on site. 2423/R06/Final October
4 Existing Mine Water Management System 3.2 Management of Surface Water Surface water at UCML is characterised as either clean water or dirty water. Clean water is generally surface water flow from areas which have not been impacted by the mine and current rehabilitation areas. Dirty water is generally water which is on site and comes into contact with ground disturbed by mining and associated activities. Dirty water is directed to the mine water management system and is used in the mining operation. UCML has implemented a range of controls to maintain the separation of clean and dirty water and to prevent the contamination of clean water by mining activities. These controls are outlined in Sections to Open Cut Pit Water Controls Where possible, runoff from undisturbed areas of the site is diverted around the disturbed areas of the mine using diversion drains. The diversion drains prevent the contamination of clean water by mining activities and minimise the inflow of clean water runoff into the pits. However the clean water diversions around the open cut pit have been removed by recent open cut mining so that clean catchment runoff is currently draining to the mine water management system. A series of additional clean water diversions around the open cut pit have been included in the Project to improve surface water management (refer to Section 5.3). A series of catch drains have been constructed around the perimeter of the open cut pit to ensure that no discharge of dirty water occurs from the pit into the surrounding creeks and drainage lines. Surface water runoff from disturbed areas is directed to the mine water management system Overburden Emplacement Area Controls Runoff from overburden emplacement areas is collected in catch drains and directed through sediment dams to remove suspended sediment prior to use or discharge from site. Similarly diversion drains and sediment dams have been constructed to collect and treat runoff from rehabilitated sections of the emplacement areas, including the rehabilitated East Pit emplacement area, prior to overflow into natural drainage lines downstream of the rehabilitated areas Coal Handling and Preparation Area Controls The coal handling and preparation area comprises the various stockpile emplacement areas and the CHPP (refer to Figure 1.7). Coal from the open cut and underground mines is currently held in the following stockpiles for processing and handling: ROM hub stockpile; underground ROM stockpile; open cut ROM stockpile; reject stockpile; and CHPP product stockpile. 2423/R06/Final October
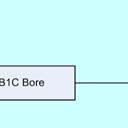
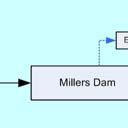
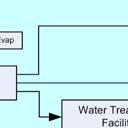
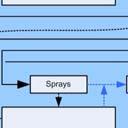
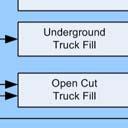
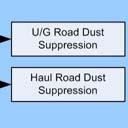
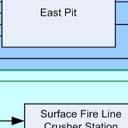
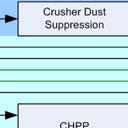
5 Existing Mine Water Management System Runoff generated from the CHPP area, underground crusher and associated stockpiles is diverted to sediment dams by a series of bunds, culverts, channels and drains (refer to Figure 3.2). The sediment dams are designed to retain dirty water runoff from the CHPP and stockpile areas for a residence time long enough to allow for settlement of suspended solids. Decant water from the sediment dams is directed to the existing mine water management system where it is either used in mining operations (the surface crusher, the CHPP, haul road dust suppression) or transferred to the East Pit for storage. Runoff from the Hub Stockpile and the Dump Slot areas report directly to the East Pit (refer to Figure 1.7). 3.3 Water Discharge Capacities In the past, surplus mine water was discharged into the Ulan Creek under licence. A commitment by UCML to minimise off-site discharges resulted in the introduction of the Bobadeen Irrigation Scheme in Under the scheme, approximately 242 hectares of land is irrigated with surplus mine water and used for fodder production and cattle grazing. Surplus water is directed to the Bobadeen Irrigation Scheme. In mid 2006 UCML installed the Bobadeen Water Treatment Facility as part of the mine water management system in response to increasing mine water make and varying water quality as underground mining progressed. Surplus water is directed to the Bobadeen Dam. Water is recovered from the dam, treated at the Bobadeen Water Treatment Facility, blended with mine water and then discharged to Ulan Creek in accordance with UCML s EPL No. 394 discharge criteria. The reverse osmosis (RO) plant located at the Bobadeen Water Treatment Facility has an operational efficiency in the order of 80 per cent. For example, for every 5 ML of mine water inflow into the RO plant, 4 ML of treated RO water and 1 ML of wastewater are produced. To achieve the water quality criteria at the Bobadeen Discharge Point (as defined by EPL No. 394, refer to Table 3.1) the treated RO water is then blended with mine water. The blending ratio is variable and dependant on the mine water quality. Previous blending experience at UCML has seen a nominal blending ratio of three parts mine water to one part treated RO water (i.e. 3:1). As such to achieve a discharge volume of 12 ML per day, 9 ML of mine water would be blended with 3 ML of treated RO water. This process (i.e. discharge of 12 ML per day) would produce approximately 0.75 ML per day of wastewater. The wastewater produced at the Bobadeen Water Treatment Facility has a water quality typically in the order of 6500 µs/cm and a ph of 7.5. The proportion of wastewater produced will vary with mine water quality and RO plant efficiencies. There is also a licensed discharge point at Rowans Dam (no discharge limit is specified in EPL No. 394) and approval has recently been granted for the installation of water treatment facilities with a discharge of 10 ML per day. This facility will be adjacent to the Rowans Dam discharge point to facilitate the treatment of surplus water prior to discharge. Installation of the Rowans Dam Water Treatment Facility has not yet been completed. UCML also maintains licensed discharge points at Millers Dam (85 kl per day) and Truckfill Dam (2000 kl per day) (refer to Figure 3.3 and Table 3.1). 2423/R06/Final October


6


7
8 Existing Mine Water Management System Location Table 3.1 UCML Licensed Discharge Points EPL No. 394 Licence Point Iron (mg/l) Conductivity (µs/cm) Discharge Limits Oil & Grease (mg/l) ph Zinc (mg/l) Volume (kl/day) Millers Dam 1 85 Effluent Storage Dam Overflow from Rowans Dam to Ulan Creek Discharge to Ulan Creek from Rowans Dam Water Treatment Facility Drainage Outlet from Truckfill Dam to unnamed watercourse Discharge to Ulan Creek from the Bobadeen Water Treatment Facility Not specified , ,000 Groundwater modelling and associated water balance predictions for the Ulan complex (refer to Section 4.1 and Appendix A) indicate an increased need for the management of surplus water within the proposed mining operation. The continued use of water treatment facilities and the Bobadeen Irrigation Scheme will be key components of the future water management strategy for the Ulan complex. Future water management strategies for the Project are discussed in Section Surface Water Monitoring Surface water quality and quantity is monitored in the surrounding drainage system in accordance with the UCML Water Management Plan (UCML, 2007). The statutory surface water monitoring locations, including flow gauging stations on the Goulburn River, are shown on Figure 3.3. Water monitoring at UCML is undertaken to assess compliance against licence conditions and Consent Conditions, provide data for the management of water within the mine and to assess the impacts of the mines operations when compared against UCML imposed criteria or predictions. The surface water monitoring routine at UCML is derived from the licence criteria as outlined in EPL No. 394 and listed in Table 3.1. UCML also undertakes monitoring for operational purposes which is in addition to that outlined in the various licences. This monitoring is undertaken on an as needs basis to assist the mine in its day to day management of its mine water operations. The frequency of monitoring and the parameters monitored for operational purposes is undertaken at the discretion of UCML. Monitoring at these operational monitoring locations is generally triggered by unexpected results from the statutory monitoring regime, i.e. operational monitoring is undertaken on as need basis or for project specific purposes. 2423/R06/Final October
9 Existing Mine Water Management System Where no water quality criteria have been set under the various licences, the monitoring data is compared against: the previous range of data at that location; and/or the trend associated with the previous data collected (i.e. seasonal movements, historical trends, etc); and/or forecast predictions or estimates. As required by EPL No. 394, all monitoring records are to be kept for at least four years for reference on request by DECCW. The UCML Annual Environmental Management Report (AEMR) for 2008 indicates that discharge volumes and quality from the site for the period were within the licence discharge limits. 2423/R06/Final October
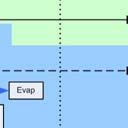
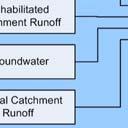
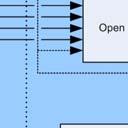
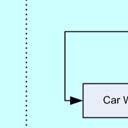
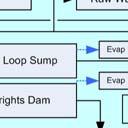
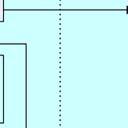
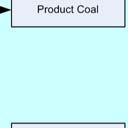
10 Mine Water Management System Impacts 4.0 Mine Water Management System Impacts 4.1 Site Water Balance The Ulan complex water balance model is detailed in Appendix A of this report. A summary of the outcomes of the water balance modelling is included in Sections and Appendix A includes the following: a description of the reporting water balance model of the Ulan complex; details of the historical water balance for the period January 2007 to December 2008; water balance predictions for the Project; and a discussion of the proposed future water management strategy for the Project /2008 Complex Water Balance A reporting water balance model was developed for the Ulan complex during This model has been used to update the operational water balance for the Ulan complex for the period from January 2007 to December The reporting water balance model comprises a series of modules that represent the catchments and major components of the mine water management system. Each module is balanced individually and then brought together to represent the total water balance for the Ulan complex. The operational water balance calculations use data compiled from coal processing operational reports, meteorological data from the Bureau of Meteorology (BoM) and on-site measurements including telemetry data and manual readings of rainfall, water levels and flow rates. The net water balance is the difference between the water sources, losses and discharges for the period under consideration and takes into account the changes in the volume of water that is stored around the Ulan complex (i.e. the water inventory). A summary of the site water balance for 2007 and 2008 is presented in Table 4.1. The Ulan complex had a gross water surplus for 2007 and 2008 of approximately 4360 ML and approximately 3773 ML respectively. The lower net water balance in 2008 is primarily driven by less catchment runoff during 2008 compared to A simplified schematic of the water balance model for the Ulan complex with the 2007 and 2008 water balance volumes for the Ulan complex is shown on Figure 4.1. Details of the 2007 and 2008 water balance for the Ulan complex are provided in Appendix A. 2423/R06/Final October
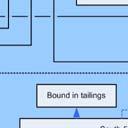
11 Period of Interest Evaporation (dams) with ROM Dust suppression Evaporation (dust suppression) Other losses (seepage, etc) 8212 Ulan Mine -657 Freshwater s Moisture bound with product coal Groundwater Change in Inventory Moisture bound 4380 ML rejects/tailings Irrigation Off-site discharge Total Inputs Net Water Balance Total Outputs ML 3758 ML ML 19.8 ML/day 5.1 ML/day ML/day
12 Mine Water Management System Impacts Table 4.1 Ulan Complex Water Balance Summary 2007 & 2008 Item & 2008 Combined Total Gross water sources 7,712 ML 6,737 ML 14,449 ML Gross water losses -3,352 ML -2,964 ML -6,316 ML Gross water balance 4,360 ML 3,773 ML 8,133 ML Average daily gross water balance 11.9 ML/day 10.3 ML/day 11.1 ML/day Off-site discharge -1,844 ML -2,531 ML -4,375 ML Annual net water balance 2,516 ML 1,242 ML 3,758 ML Average daily net water balance 6.9 ML/day 3.4 ML/day 5.1 ML/day Predicted Complex Water Balance The predictive water balance model for the Project is based on the model developed for the reporting water balance. The main water sources identified for the Project are catchment runoff, rainfall on dams within the mine water management system, groundwater inflows to the Ulan No. 3 and Ulan West underground mines, and the potable water supply. Historical meteorological data from the Scone BoM station was used to predict the range in potential future rainfall, run-off and evaporation characteristics for the Project. Scone daily matched rainfall and evaporation data is available for the last 36 years. Comparison with Ulan rainfall data indicates that Ulan and Scone rainfall characteristics since 1973 are similar (refer to Appendix A). There is no evaporation data available for Ulan. Evaporation data from Scone is considered to adequately represent the evaporation rates experienced at Ulan, as evaporation tends to be regionally driven. Estimates of future groundwater make in the Ulan No. 3 and Ulan West underground mines were sourced from the Ulan Coal Continued Operations Groundwater Assessment (MER, 2009) (refer to Appendix 6 of the EA). The main water losses identified for the Project include water lost (i.e. bound) in product coal, coarse rejects and tailings, water used for dust suppression, water lost to evaporation, and potable water use. Estimates of water lost to product coal, coarse rejects and tailings were based on the production schedule for the Project and historical rates of water use/loss in coal handling and processing. Proposed haul roads lengths and meteorological data were used to estimate the water required for dust suppression. Historical evaporation rates were used to estimate the water lost to evaporation from dam surfaces. Future potable water use was based on historical usage and predicted staffing levels for the Project. Risk analysis software was applied to the predictive model outputs to calculate the probability of different water balance outcomes based on variability in the model input data, e.g. rainfall, runoff, production water demands. The three probable scenarios from the risk analysis that are included in the report are for the 10 th percentile, 50 th percentile and 90 th percentile water balance predictions. The predictive water balance model and risk analysis output provide information on the demand and supply peaks for the Project and identify storage and discharge requirements for the mine water management system over the life of the mine. 2423/R06/Final October
13 Mine Water Management System Impacts The predicted water balances for selected future stages of the Project are listed in Table 4.2. The future stages selected represent Years 1 and 20 and three intermediate years (Years 6, 8 and 13), including the year with the maximum predicted complex water surplus (i.e. Year 8). These stages best represent the potential fluctuations in the predicted water balance. Table 4.2 Predicted Ulan Complex Water Balance Item Year 1 Year 6 Year 8 Year 13 Year 20 Gross water sources 6995 ML ML ML 7143 ML 4548 ML Gross water losses ML ML ML ML ML Gross water balance 4160 ML 6650 ML 7211 ML 4281 ML 3001 ML Average daily gross water balance 11.4 ML/day 18.2 ML/day 19.8 ML/day 11.7 ML/day 8.2 ML/day The predictive water balance model for the Project indicates that the maximum predicted water surplus (i.e. inputs minus outputs, without consideration of discharges or changes in available water storage) occurs in Year 8 and is in the order of 19.8 ML per day (refer to Table 4.2). 4.2 Mine Water Management Water Storage and Usage The future tailings emplacement strategy for the Project is based on the continued use of the East Pit as a tailings dam. The East Pit is currently used for tailings emplacement and for water storage and will require dewatering to allow for the construction of two additional tailings emplacement areas. The water in the East Pit has a higher salinity than water currently being managed through the mine water management system and will be treated prior to discharge if required. Approval has recently been granted for the installation of a Water Treatment Facility adjacent to the existing Rowans Dam licensed discharge point (refer to Section ) to facilitate the treatment and discharge of water from the southern portion of UCML operations. With the construction of two additional tailings emplacement areas in the East Pit, the available water storage volume within East Pit will decrease by approximately 3230 ML by As mining progresses, increased storage capacity will become available in the voids of the Ulan No. 3 underground mine. The additional capacity available within these voids is estimated to be approximately 1100 ML. It is proposed to manage wastewater produced by any reverse osmosis plant contained within a water treatment facility within a segregated wastewater system. All wastewater will be transferred from the northern water treatment facilities via surface and underground pipelines to deliver the wastewater to the southern area of operations where it will be managed and contained within UCML s existing water management system through storage tanks and dedicated pipelines. Based on current mine water qualities and RO plant efficiencies at Bobadeen, it is estimated that wastewater volumes will be in the order of 6 per cent of the total water discharged from 2423/R06/Final October
14 Mine Water Management System Impacts the water treatment facilities (i.e. the combined blend of treated RO water and mine water), will have a typical water quality in the order of 6500 µs/cm and a ph of 7.5. It is proposed to use the wastewater for coal stockpile dust suppression and operational process water circuit (i.e. crusher facilities). Any runoff from the areas where the wastewater is applied will be contained and diverted to sediment dams, by a series of bunds, culverts, channels and drains (refer to Figure 3.2) prior to use in the mine water management system. Based on the proposed water management strategy, the volume of wastewater generated in the water treatment facilities will range between approximately 50 ML per year and approximately 360 ML per year. Analysis indicates that for all years, except for Year 7 (2016), the water demands for the crusher process (based on proposed production schedules) will exceed the potential wastewater generated based on the proposed water management and discharge strategy (refer to Section and Appendix A). During Year 7 (2016) the crusher water demands are estimated to be approximately 350 ML compared to a wastewater production of 360 ML. The volume of wastewater produced is dependent on several variables including feed water quality, plant efficiency and blending ratio. Based on these variables and the analysis undertaken to date, it is considered that UCML can manage the water management system and associated discharges and wastewater production to ensure that wastewater can be managed via the crusher and coal stockpile dust suppression during the Project life Management of Water Surplus Off-site Discharge The predicted site water balance for the Project (refer to Appendix A) indicates that an increased off-site discharge capacity will be required to manage the predicted water surplus for the Project, including the dewatering of the East Pit. Existing licensed discharge facilities will be maintained under UCML s EPL No. 394 (refer to Section 3.3) and the continued use of the Bobadeen Water Treatment Facility and the Bobadeen Irrigation Scheme will be key components of the future water management strategy for the Project. The approved Rowans Dam Water Treatment Facility will be used in conjunction with the existing licensed discharge point at Rowans Dam to facilitate the treatment and discharge of treated water from the southern portion of the operation under UCML s EPL No There is no specified discharge limit at the existing Rowans Dam licensed discharge point in EPL No The proposed Ulan West Water Treatment Facility conceptual layout, which includes staging and blending dams, pipeline and discharge structure is located in the north of the project area (refer to Figure 1.5). The proposed Ulan West Water Treatment Facility will be used to facilitate the treatment and discharge of up to 17.5 ML per day. The proposed discharge structure is to be located on the Talbragar River near its confluence with Mona Creek (refer to Figure 1.5). The management of wastewater produced in the water treatment facilities will be within a segregated system and is discussed in Section /R06/Final October
15 Mine Water Management System Impacts Water Sharing UCML has recently established two water sharing agreements with the adjacent mines to ensure the responsible management of the water resource. Wilpinjong Coal Mine is located approximately 7 kilometres to the south-east of the project area. A Heads of Agreement has been reached with Wilpinjong Coal Mine for the supply of water on an as required basis. Moolarben Coal Project (MCP), located to the south and east of the project area, has recently commenced operations. A water transfer agreement is in place between UCML and MCP for a minimum of 1000 ML per year to be supplied from Licensing requirements for the proposed water transfer are discussed in Section 7.6. Progression of these water sharing projects will be in accordance with relevant statutory provisions in relation to establishment of the water sharing infrastructure and transfer of water between the operations. In addition to these water sharing agreements, UCML maintains incidental water sharing agreements with adjacent small industrial operations Water Management Strategy The licensing requirements for the proposed discharge structures and potential impacts associated with the proposed discharges are discussed in Section 5.0. The existing and proposed discharge and water sharing facilities are summarised in Table 4.3. Table 4.3 Proposed Discharge Facilities Discharge Facility Status Rate (ML/day) Bobadeen Irrigation Scheme Existing 4* Moolarben Coal Project Proposed >= 2.74** Wilpinjong Coal Mine Proposed to be determined Bobadeen Water Treatment Facility (Ulan Creek) Existing 15 Rowans Dam Water Treatment Facility (Ulan Creek) Approved 10 Ulan West Water Treatment Facility (Talbragar River) Proposed 17.5 * Based on historical rates ** Potential to transfer additional water if agreed UCML has a defined hierarchy of water usage and discharges. Water required to be discharged from site to meet operational requirements will be used at the Bobadeen Irrigation Scheme first, followed by water sharing with adjacent coal mines. Additional water discharge requirements will continue to be met by treatment and discharge to Ulan Creek, in addition to the proposed discharge to the Talbragar River. An example discharge strategy has been simulated (refer to Appendix A) to demonstrate how UCML might dispose of the predicted water surplus. In the simulation the future discharge rate peaks at 21.7 ML per day in Years 7 and 8 (i.e and 2017). This discharge rate (i.e ML per day) includes gross water make (refer to Table 4.2) and reducing water stored on site (e.g. East Pit) and is within the capacity of the existing and proposed discharge facilities (refer to Section ). Reduction of water stored in East Pit (refer to Section 4.2.1) will preferably occur through water sharing with Moolarben Coal Project and Wilpinjong Coal Mine. Wastewater produced in the water treatment facilities will 2423/R06/Final October
16 Mine Water Management System Impacts be used for dust suppression on coal stockpiles and in the crusher / sizing station facilities (refer to Section 4.2.1). UCML proposes to vary its discharge regimes by varying the water flow rates between the various discharge structures based on environmental and water requirements of the Project. As such the proposed discharge infrastructure will provide flexibility and significant extra capacity within the water management system. 2423/R06/Final October
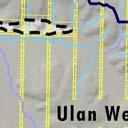
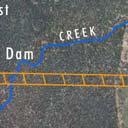
17 Surface Water Impacts and Management 5.0 Surface Water Impacts and Management 5.1 Catchment Areas and Watercourses Overview of Potential Impacts Predicted subsidence impacts resulting from the proposed underground mining operations of Ulan No. 3 and Ulan West may potentially affect Ulan Creek, Bobadeen Creek, Curra Creek, Mona Creek and Cockabutta Creek catchments. Surface water management for predicted subsidence impacts is discussed in Section 5.2. The proposed mining operations will result in changes to the clean water catchments within the project area with surface water flow from all mining disturbance areas being captured and directed to the mine water management system. The mining disturbance areas include the open cut extension, overburden emplacement areas, stockpile and reject areas and surface infrastructure areas. The main long term beneficial impact on clean water catchment areas will result from the progressive rehabilitation of the existing open cut and proposed open cut extension with some 880 hectares that is currently within the mine water management system being returned to the catchment area of Ulan Creek during the Project. The surface water management for the surface mining disturbance areas and associated surface infrastructure is discussed in Sections 5.3 to 5.6. The existing licensed discharges to Ulan Creek under UCML s EPL No. 394 will remain. An additional discharge facility, the Ulan West Water Treatment Facility, will be constructed in the north of the project area. The proposed Ulan West Water Treatment Facility will discharge treated water to the Talbragar River. The details of the proposed Ulan West Water Treatment Facility and associated infrastructure, and the potential impacts on the Talbragar River are discussed in Section Remediation of the Goulburn River Diversion The Goulburn River diversion was approved as part of previous operations and completed in It diverts a 3.6 kilometre length of the Goulburn River around the UCML East Pit, to a location approximately 700 metres east of the river s original flowpath. The Goulburn River diversion consists of two straight reaches joined by a 90 degree bend. There have been a number of concerns raised by government and community stakeholders regarding the Goulburn River diversion including adverse impacts on water quality from sediment and erosion of the river banks, interaction with previously mined areas and loss of river base flows. In response to these concerns, UCML commissioned a study to identify and understand the issues and have since resolved to develop and implement a remediation strategy to address the major issues. The contents and outcomes from this study by URS (2009) are summarised below. The URS Study (2009) examined the geomorphology, geotechnical (including drill logs and slope stability analysis), soils testing, hydrology and hydraulic assessments of the Goulburn River diversion. The geomorphology assessment (URS, 2009) indicated that the Goulburn River diversion channel is unable to be re-engineered as an alluvial channel due to the high stream powers and narrow bed. However, the geomorphological assessment indicated that restoring the Goulburn River diversion to a semi-natural state and controlling erosion would promote natural processes and enhance the appearance of the Goulburn River diversion. The hydraulic analysis (URS, 2009) indicates that there is potential flow capacity within the 2423/R06/Final October
18 Surface Water Impacts and Management diversion channel to incorporate semi-natural features in the channel bed, including pool and riffles sequences into the remediation works. URS (2009) modelled the Goulburn River diversion, including the reaches of the river upstream and downstream of the diversion, using the one dimensional steady state model HEC-RAS. The hydrology and hydraulic modelling indicated that the channel has sufficient capacity to contain the 100 year Average Recurrence Interval (ARI) storm event flood flows. The hydraulic modelling results indicated that the stream power of the Goulburn River diversion channel has been slightly increased from the natural non-diverted condition. The studies also indicated that the stream power (i.e. scouring and erosion potential) of the channel is high, with potential for channel bed and bank erosion during higher flows (i.e. greater than 20 year ARI). However, field observations indicated that, although the stream power was high, the channel is reasonably stable. As part of the study (URS, 2009) long-term options were examined for the morphological stability of the Goulburn River diversion. Fourteen diversion options and combinations of these options were considered both qualitatively and quantitative along the different distinctive reaches of the Goulburn River diversion. These fourteen options were considered by UCML when developing the remediation works program for the Goulburn River diversion. In accordance with the preferred options UCML is planning to undertake remediation works along the Goulburn River diversion based on the strategy recommended by URS (2009) in accordance with reasonable and feasible measures as determined by the cost benefit analysis completed as part of this study. This strategy has been discussed with key stakeholders including DECCW (formerly DECC and DWE), DoP and the Ulan Coal Community Consultative Committee (CCC). The main goal for the remediation strategy is to improve the long-term stability of the Goulburn River diversion channel, however ecological and visual amenity aspects have also been taken into consideration. The proposed remediation measures for the Goulburn River diversion include: improvements to surface drainage in order to reduce erosion; bank profiling to reduce velocity and stream power; and revegetation along the banks of the diversion in order to reduce erosion from rainfall and overland flow and enhance riparian habitat. Construction of the proposed remediation works will be staged to ensure successful establishment of vegetation within each stage, prior to further disturbance for remediation works. A detailed monitoring program will also be prepared as part of the detailed construction plans for the remediation project. It is proposed to complete the works in a staged manner in order to mitigate any in-stream and water quality impacts. Information regarding the implementation is included in Section of the EA. Implementation of the works will be undertaken in consultation with DECCW (formerly DECC and DWE), CMA and DoL and in accordance with statutory requirements. Community stakeholders will also be consulted in the process. 2423/R06/Final October
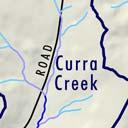
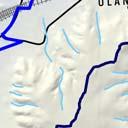
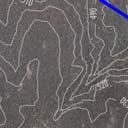
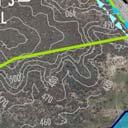
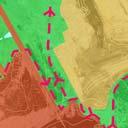
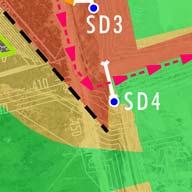
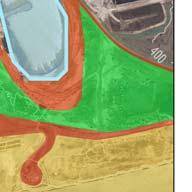
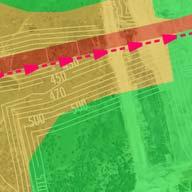
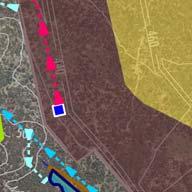
19 Surface Water Impacts and Management 5.2 Surface Water Management for Subsidence Areas Predicted Subsidence Impacts Subsidence predictions for the proposed Project and the potential range of impacts resulting from the predicted subsidence have been documented by Strata Control Technologies (SCT) (2009) (refer to Appendix 5 of the EA). The predicted subsidence affectation area, defined by the 20 mm subsidence line, is shown on Figure 5.1. The subsidence predictions have been used to determine the potential impacts of the proposed underground mining operations on the surface drainage regime of the predicted subsidence affectation area and downstream catchments. The subsidence predictions have also been used in determining the potential management and mitigation measures that may need to be implemented as part of the Project. Sections to discuss the potential impacts of underground mining on surface water drainage and detail the proposed mitigation measures to be implemented. The different mechanisms of subsidence are discussed further below. Longwall mining typically results in subsidence bowls forming on the surface. These subsidence bowls typically form a continuous relatively smooth landform on the surface, with resulting changes to grades and elevations. The subsidence predictions (SCT, 2009) indicate that the proposed underground mining, will result in maximum predicted vertical subsidence of up to approximately 1.6 metres in some areas. Mining subsidence is expected to cause cracking and fracturing of the overburden strata throughout the overburden section. As such a torturous pathway may be created through the overburden strata from the surface to the mining strata (SCT, 2009). When this occurs, surface runoff may be provided with a torturous flow path from the surface to the underground mining operation. The result is potential capture of surface flows into the underground mining operation. The soils within the predicted subsidence affectation zone along the creeklines are typically shallow, with sandy soils above the Triassic sequences and some areas containing clay and loam components above the Jurassic sequences. The main creek channels proposed to be undermined are typically sandy. It is considered that the potential for cracking to connect through the sandy soil layers to surface is minimal due to the mobile nature of the soil profile. In addition, if cracking does occur through the surface soil layers this cracking may potentially be self healing as over time it is likely that fine grained material will gradually fill surface cracks and reduce the hydraulic conductivity of immediate surface strata (SCT, 2009). The main channel of Ulan Creek is located outside of the predicted subsidence zone (refer to Figure 5.1) and is considered that the proposed underground mining will have negligible impacts on the character and capacity of the creek to maintain flow (SCT, 2009). Further discussion regarding potential for stream capture and downstream effects is provided in Section Existing Catchment Areas and Watercourses The predicted subsidence affectation area (refer to Section 5.2.1) is located within the catchments of Ulan, Bobadeen, Curra, Mona and Cockabutta Creeks (refer to Figure 5.1). The boundaries of the subcatchments are shown on Figure 2.1 and described in further detail in Section 2.0. The subcatchment areas, and areas and stream ordering within the predicted subsidence affectation area are listed in Table /R06/Final October


20
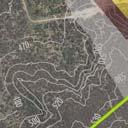
21 Surface Water Impacts and Management Creek Table Catchment Areas and Stream Ordering Total Catchment Area (ha) Catchment Area within Predicted Subsidence Affectation Area (ha) Catchment Area within Predicted Subsidence Affectation Area (%) Stream Category - within Subsidence Affectation Area Ulan Creek 3,900 1,130 29% 2 (3 rd order) Bobadeen Creek 2, % 1 (1 st order) Curra Creek 1, % - Mona Creek 4,720 2,050 43% 2 (3 rd order) Cockabutta Creek 10,330 1,250 12% 1 (2 nd order) Topographic and Catchment Boundary Changes Analysis of the subsidence predictions (SCT, 2009) indicates that the proposed underground mining, will result in maximum predicted vertical subsidence of up to approximately 1.6 metres in some areas, but will not significantly alter the catchment boundaries from those that currently exist as shown on Figure Farm Dams, Roads and Culverts The predicted subsidence affectation area is primarily forested with some grazing, irrigation and other rural land uses. Associated with the land uses are a number of access roads and tracks, and farm dams. There is potential for the predicted subsidence from the proposed underground mining to affect this infrastructure. Analysis has been undertaken of the likely impacts on the drainage of this existing infrastructure during the life of the project. This analysis indicates that remediation works may include: reshaping of farm dam embankments; and works as required to ensure that drainage is maintained at all access roads and tracks, and associated culverts and drainage. Reconstruction of access roads, tracks and associated culverts, and reshaping of dams is addressed in detail in the subsidence assessment (refer to Appendix 5 of the EA) (SCT, 2009). Figure 5.2 shows the privately owned farm dams that may require monitoring for potential impacts Drainage Lines Surface Mitigation and Remediation Works There are numerous drainage lines proposed to be undermined (refer to Figure 5.1). These drainage lines range from first order to third order tributaries and streams and form part of the subcatchment areas described in Section and Table 5.1. As indicated on Figure 5.1 and in Table 5.1, the majority of drainage lines occurring within the predicted subsidence affectation area are first and second order. 2423/R06/Final October


22
23 Surface Water Impacts and Management The soil characteristics of the predicted subsidence affectation area along the creeklines are typically shallow, well drained and susceptible to erosion. The soils typically have low fertility. The majority of the drainage lines in the predicted subsidence affectation area are currently in good condition with some showing signs of minor erosion. The soil characteristics and site inspections indicate that the creek lines are potentially all subject to erosion with the potential for erosion being increased where vegetation cover is absent. Modelling of a typical drainage line located in the Ulan Creek catchment area (considered to be representative of drainage lines within the predicted subsidence affectation area) indicates that the drainage lines are typically subject to velocities in the range of approximately 1.2 m/s to approximately 2.4 m/s during major storm events (i.e. a 100 year ARI storm event) and approximately 0.9 m/s to approximately 1.6 m/s during minor storm events (i.e. a 5 year ARI storm event). Velocities typically lower than 1.5 m/s to 2.3 m/s are typically non-scouring in vegetated channels. Modelling also indicated that peak velocities of approximately 3.4 m/s may occur at the confluence of the modelled drainage line and Ulan Creek during the 100 year ARI storm event. At this location site inspection indicates that the creek is slightly incised with some bed and bank erosion. However, for velocities higher than this and when vegetative cover is absent, as indicated by field inspection, some scouring and erosion may occur. Modelling of the typical drainage line indicates that there will be negligible changes to the velocities during both major and minor storm events with the landform changes as a result of the predicted subsidence. The predicted subsidence has limited potential to result in increased ponding, both in or and out of the drainage lines. Site inspection indicates that in the majority of areas where the topographical survey indicates existing ponding, water does not pond in these areas as the soils are sandy and relatively free draining. As such, it is considered unlikely, based on the analysis of the predicted subsidence that any additional ponding will occur within the predicted subsidence affectation area. This is due to both the steepness of the existing landform and sandy soils. It is proposed to monitor areas where potential ponding (based on topographical analysis) may occur (refer to Figure 5.2). If monitoring indicates that remediation works are required, remediation works will need to maintain channel grades and take into consideration channel stabilities and existing channel characteristics. In areas where surface cracking occurs, remediation works (e.g. surface tilling) will be undertaken to fill the cracks at the surface and limit potential ingress of surface runoff into the proposed underground mining operations Subsidence remediation works will result in ground disturbance and will reduce vegetative cover in the short term. As discussed above, this has the potential to result in erosion. Erosion and sediment controls will be implemented for all remediation works as described in Section 5.7 to effectively manage these potential impacts Proposed Monitoring and Remediation Protocols Taking into consideration the existing surface water regime, associated topography and depth of cover of the subsidence affectation area and previous experience at UCML, it is considered unlikely that remediation works will be required. However, a comprehensive monitoring regime will be implemented to monitor major drainage lines and the locations identified in Figure 5.2 for potential subsidence impacts. 2423/R06/Final October
24 Surface Water Impacts and Management Due to the predicted subsidence affectation area and the range of variables influencing the potential surface water impacts and potential works areas (refer to Figure 5.2) it is proposed to implement and refine monitoring and remediation protocols as part of the Subsidence Management Plan or equivalent process throughout the life of the Project to ensure that surface water impacts are minimised. The required controls and protocols will utilise standard erosion and sediment control techniques to manage surface water during remediation (refer to Section 5.7). Similarly due to the steepness of the catchment areas and surrounding topography and vegetation it is not considered practical to divert runoff from upstream catchment areas around potential impacts areas if works are required. As such it is proposed that all remediation works are managed in stream. This situation is considered typical of the majority of the drainage lines within the project area. It is proposed to refine and implement procedures as part of the Subsidence Management Plan or equivalent process to manage the drainage line remedial works after subsidence has occurred. These procedures may include but not be limited to: monitoring of vertical and horizontal subsidence along second and third order drainage lines as determined in consultation with the Department of Industry and Investment (DII) (formerly Department of Primary Industries); monitoring, measurement and recording (e.g. photographic records) of extent and magnitude of any surface cracking along second and third order drainage lines that may occur during and post mining operations. If works are required these may include sealing of cracks, using methods approved by DECCW and DII; visual inspection and recording (including photographic records at least every 50 metres) of stream bed and bank condition and riparian vegetation along second and third order drainage lines, including collection of baseline data and monitoring during and post mining operations; management of surface water runoff post mining until completion of remediation. The volumes of runoff likely to be encountered in a rainfall event and how to control this water will need to be considered; sediment and erosion controls; treatment of soils with gypsum, if required, to reduce potential dispersibility; revegetation techniques and maintenance; and construction of sediment dams/controls downstream of disturbed areas to collect sediment Potential Impact on Downstream Water Users The regions downstream of the project area are primarily forested within the Goulburn River catchment but also include irrigated pasture/fodder crops within the Talbragar River catchment. Groundwater is extracted at several locations in and around the project area to support the aforementioned land uses. Groundwater licences and potential impacts on baseflows are discussed in detail Appendix 6 of the EA. 2423/R06/Final October
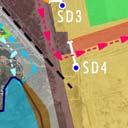
25 Surface Water Impacts and Management MER (2009) (refer to Appendix 6 of the EA) indicates that during the life of the Project baseflows in the Goulburn River system may be reduced by an additional 0.02 ML per day to 0.11 ML per day compared to current baseflow losses estimated to result from previous mining between 1986 and Baseflow losses in the Goulburn River system are predicted to increase in 0.52 ML per day after cessation of mining. MER (2009) also indicates that increases in baseflow losses of 0.18 ML per day to 0.21 ML per day may result in the Talbragar River system. Baseflow losses in the Talbragar River system are predicted to increase in 0.38 ML per day after cessation of mining. UCML propose to offset these losses to the baseflows of the Goulburn and Talbragar River system by discharge of treated surplus mine water to both river systems (refer to Section 4.2.2). At UCML the soils are typically sandy with some areas containing clay and loam components. The creek systems within the project area are also ephemeral. Historical observations indicate that the volume of rainfall that translates to runoff is relatively low (estimated to be in the order of 12 per cent) (refer to Appendix A). The remaining 88 per cent of rainfall is lost to evaporation, evapotranspiration and baseflow. The estimated runoff rates correspond with average regional runoff estimates provided by DECCW ( of 0.7 ML per hectare per year. There is some potential that during the time between mining and completion of any required surface remediation works (refer to Section ) some minor stream capture may occur during rainfall events. As such there is potential to influence the volume of runoff available for harvestable rights at downstream properties. However, it is considered that this potential is limited as the catchment areas upstream of the mining areas are small, sequential mining will affect only short sections of creek at any time, runoff rates are relatively low and as such only a relatively low volume of runoff could be captured during storm events due to surface cracking. As any cracking will appear very rapidly on the surface after longwall mining, regular checking and resealing of in channel cracks will be undertaken. These progressive resealing works will significantly reduce the potential for loss of surface flows due to subsidence cracking. 5.3 Surface Water Management for Open Cut Areas The surface water management strategy has been designed to integrate management of the proposed open cut extension area with the existing open cut disturbance areas. The strategy includes the separation of clean and dirty water, preventing the contamination of clean water by mining activities and ensuring compliance with UCML statutory obligations. The clean water management system includes a series of diversion drains and catch drains, and clean water catch dams around the perimeter of the open cut area in order to safely capture and divert upstream catchment runoff away from the mining disturbance areas. As mining progresses, the clean water controls will be maintained by the construction of new drains and dams as needed. The major components of the proposed clean water and dirty water management systems for the continued operations are shown in Figures 5.3 to 5.7. The proposed clean water and dirty water dams are listed in Table /R06/Final October


26


27


28


29


30
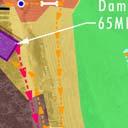
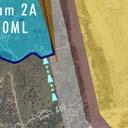
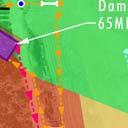
31 Surface Water Impacts and Management Table 5.2 Proposed Dam Volumes for Open Cut Extension (ML) Dam Type Year 1 Year 5 Year 7 Year 12 Final Landform Dam 1 Dirty Water Dam 2a Clean Water Dam 2b Clean Water Dam 3 Clean Water Dam 4a Clean Water Dam 4b Clean Water Dam 5 Clean Water Dam 6 Clean Water Dam 7 Clean Water Dam 8 Dirty Water Total The clean water catch dams will be designed to capture runoff from the 100 year ARI 24 hour duration storm event. The clean water catch dams will be emptied using a pump and pipe system after rainfall events. Diversion drains and catch drains will be sized to safely convey the 100 year ARI critical storm duration flows and proposed pump flows from upstream clean water dams to each of the respective clean water catch dams or and downstream receiving catchment area. All diversion drains and catch drains will be vegetated and constructed with longitudinal grades of 0.6 per cent to 1 per cent and 1:3 (vertical:horizontal) side batters to ensure that the design flow velocities are non-scouring. Rock protection and energy dissipation structures will be installed at the downstream outlets, where required, to ensure that runoff does not cause scour or erosion in downstream drainage systems, including the natural tributaries and main channel of Ulan Creek. The dirty water management system includes a series of catch drains and sediment dams located to capture and treat runoff from disturbed areas. The treated runoff from the disturbed areas will be pumped to the existing mine water management system. The dirty water management system will be designed in accordance with Managing Urban Stormwater: Soils and Construction (the Blue Book), Volumes 1 and 2E - Mines and Quarries (Landcom, 2004 and 2008) to treat and convey runoff from the 10 year ARI storm event. The sediment dams will be emptied using a pump and pipe system after rainfall events. Two major sediment dams are proposed within the dirty water management system for the open cut extension. The proposed dam volume for Dam 1 is 65 ML and the proposed dam volume for Dam 8 (located down slope of the Open Cut Surface Facilities) is 8 ML (refer to Table 5.2). Rehabilitation of the open cut area will be undertaken as mining progresses. The ongoing rehabilitation is shown in Figures 5.3 to 5.7. Runoff from final, stable rehabilitated areas will be conveyed to the downstream catchment area once the required runoff water quality criteria are achieved. In the final landform, clean and dirty water management system controls will be removed where possible. Components of the clean and dirty water management systems may remain in place following the completion of mining and on decommissioning of the site. 2423/R06/Final October
32 Surface Water Impacts and Management Changes to Annual Flow Volumes The proposed mine water management system has been designed to divert clean upstream runoff around the open cut pit extension, and capture runoff from the open cut pit extension and emplacement areas for treatment and use on site. In 2007/2008 the mine water management system had a catchment area of approximately 1520 hectares. A large proportion of this area was originally part of the Ulan Creek catchment area which had a pre-mining area of approximately 4970 hectares. Table 5.3 shows the progressive changes as a result of reinstatement of catchment of Ulan Creek due to progressive rehabilitation activities during the proposed Project life relative to the premining catchment area of Ulan Creek. Table 5.3 Predicted Reinstatement of Ulan Creek Catchment Area Stage Ulan Creek Catchment Area (ha) Proportion of Pre-mining Ulan Creek Catchment Area 2007/ % Year % Year % Year % Final Landform % Consequently, the Project and associated changes to the mine water management system will reinstate the majority of Ulan Creek pre-mining catchment area. At the end of the Project life approximately 96 per cent of the pre-mining catchment area will contribute runoff to Ulan Creek. The areas proposed to be reinstated to flow into the Ulan Creek system include undisturbed catchment area upstream of the open cut pit extension and rehabilitated overburden emplacement areas. The undisturbed upstream catchment areas were previously diverted into the tributary of Ulan Creek via a system of diversion drains. These drains were removed in the last two years of open cut mining. It is proposed to divert undisturbed upstream catchment areas into the previous (i.e. two years ago) receiving drainage systems. Runoff from the rehabilitated overburden emplacement areas will also be returned to the original receiving drainage systems. 5.4 Entrance to Underground Workings Ulan No. 3 underground will continue to be accessed using the existing drift located at the Ulan No. 3 surface facilities (refer to Figure 1.4). Runoff from the sub-catchments around the drift access point will continue to be diverted away from the drift. These sub-catchment areas are all located within the existing mine water management system and will remain within the mine water management system for the Project. Portal entries located at the Ulan No. 3 underground drift allow access to the mine for the coal clearance system and a means for emergency egress. Surface water runoff and washdown water within this area is contained via drains and a sump and pumped to the existing mine water management system 2423/R06/Final October
33 Surface Water Impacts and Management A man-riding shaft and associated facilities are also proposed to be constructed in the north of the project area to provide additional access to Ulan No. 3 underground. The proposed surface water management controls for the man-riding shaft and associated facilities are discussed further in Section Ulan West underground will be accessed directly from the open cut extension. To prevent surface water runoff entering the Ulan West underground workings, a series of diversion drains, catch drains and sumps will be constructed to divert runoff from upstream areas away from the portal. These controls are shown on Figures 5.3 to 5.7. The water collected in the sumps will be pumped to the existing mine water management system. All pumps and sumps will be designed to safely store runoff from a 100 year ARI critical duration storm event and be able to pump from the pit floor to the mine water management system. The portal water management system will be designed to ensure that adequate freeboard exists between the design top water level of each sump and the invert of the entries to the longwalls. The water management system for the Ulan West underground mine entry will be constructed prior to the entry being utilised for access to the underground workings and will remain operational until underground mining is completed. 5.5 Surface Water Management for Coal Handling Areas The existing surface water management strategy for the coal handling areas has been designed to maintain the separation of the clean water and dirty water systems and to prevent the contamination of clean water by mining activities (refer to Section 3.2). Coal from the Ulan No. 3 underground mine is currently stockpiled at the following locations: ROM hub stockpile; underground ROM stockpile; open cut ROM stockpile; reject stockpile; and CHPP product stockpile. The Project will continue to use the existing stockpile areas and will not require modification of the existing surface water management structures associated with these areas. The following new stockpile areas are also proposed: ROM hub stockpile complex; dump slot stockpile; Ulan West portal stockpile; and Ulan West reject stockpile. The locations of the proposed stockpile areas are shown in Figure /R06/Final October
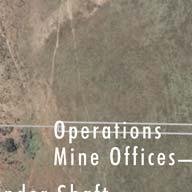
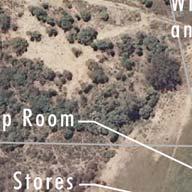
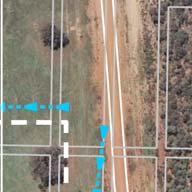
34 Surface Water Impacts and Management Surface water management for the stockpile areas will be consistent with existing water management strategies. Surface water management controls (i.e. bunds, culverts, diversion drains and catch drains) will be constructed around these stockpiles to divert runoff to sediment dams for treatment. Treated runoff water in the sediment dams will be pumped to the mine water management system where it will be used to support the mining operation. 5.6 Surface Water Management for Infrastructure Areas Man-Riding Shaft and Associated Facilities Description The proposed site for the man-riding shaft and associated facilities lies within the Ulan Creek catchment area. The proposed site has a footprint of approximately 3 hectares and is to be located immediately to the west of an existing access road in the northern section of the project area (refer to Figure 1.2). Approximately 14 hectares of natural catchment of Ulan Creek lies upstream of the proposed site. The proposed structures within the site include a man-riding facility (for access to the underground mine), offices, car park, bathhouse, stores and other associated facilities (refer to Figure 5.8). Vehicle access to the site will be via an existing access road to the east of the site Water Management Strategy The concept erosion and sediment control strategy for the site of the man-riding shaft and associated facilities has been designed to minimise the potential impacts on the surrounding environment and downstream catchment areas. The objectives of the water management strategy are to: divert clean water from upstream natural catchments around the site; maintain water quality in downstream watercourses; minimise the erosion potential of the site; and minimise the amount of sediment transported off the site. Clean water from the upstream natural catchment areas will be diverted around the site by two diversion drains designed to safely convey the 100 year ARI critical duration storm event (refer to Figure 5.8). Surface water runoff from the site will be treated to achieve a suitable water quality for discharge to downstream watercourses. Runoff from potential dirty water areas, will be treated to remove sediment, oil and fuels prior to discharge while the runoff from the remaining areas of the site will have sediment controls. Two catch drains, a sediment dam and an oil/water separation unit will constructed as a part of the support facilities for the site. The internal catch drains will be designed to convey the 20 year ARI storm event runoff to the sediment dam. The proposed sediment dam will be designed in accordance with Managing Urban Stormwater: Soils and Construction, Volumes 1 and 2E Mines and Quarries (the Blue Book) (Landcom, 2004 and 2008). 2423/R06/Final October


35
36 Surface Water Impacts and Management The existing access road will be upgraded with formalised road batters, retaining systems and drainage infrastructure will be installed, including culverts and scour protection, and sealed. Stable vegetative cover will be established on all disturbed areas of the site that are not sealed. Typical sediment and erosion controls required during the construction phase are outlined in Section 5.7. The major design components of the surface water management controls outlined above are shown on Figure Water Storages The existing water storages within the Ulan complex will continue to be used for the life of the Project. Although UCML has development consent approval to augment Moolarben Creek Dam through the construction of Moolarben Creek Dam No. 2 (upstream of the existing structure), there are at present no plans to augment this dam (refer to Section 2.1.7). New staging dams are required as part of the Ulan West Water Treatment Facility. The proposed Ulan West staging dams and potential impacts are discussed in Section Discharge Facilities The predicted water balance for the Project (refer to Section 4.1 and Appendix A) indicates that an increased off-site discharge capacity will be required to manage the predicted water surplus from the Project, including the dewatering of the East Pit. In order to manage the predicted water surplus the existing licensed discharge facilities will be maintained (refer to Section 3.3 and Table 3.1), including construction of the approved Rowans Dam Water Treatment Facility. The Project includes the construction of a third water treatment facility, the Ulan West Water Treatment Facility, to be located in the north of the project area with the associated infrastructure, including a discharge structure on the Talbragar River (refer to Figure 1.5). Additional discharge structures may be constructed to convey runoff from the rehabilitated areas of the open cut areas (refer to Figures 5.3 to 5.7). These discharge structures will be licensed where required and designed to ensure that erosion of the bed or banks of the tributary or downstream reaches does not occur Rowans Dam Water Treatment Facility (Approved) Development approval was granted in 2008 for the installation of the Rowans Dam Water Treatment Facility adjacent to the existing Rowans Dam licensed discharge point near the confluence of Ulan Creek and the Goulburn River (refer to Figure 1.5). The installation of the Rowans Dam Water Treatment Facility will enable UCML to treat and discharge water from the East Pit, via Rowans Dam, in accordance with the water quality criteria detailed in the EPL. The Rowans Dam Water Treatment Facility will be used in conjunction with the existing licensed discharge point at Rowans Dam (EPL No. 394). The approved Rowans Dam Water Treatment Facility has not yet been constructed. 2423/R06/Final October
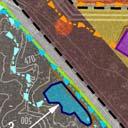
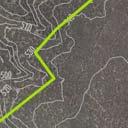
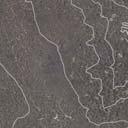
37 Surface Water Impacts and Management Ulan West Water Treatment Facility An additional water treatment facility, staging dams, pipeline and discharge structure are proposed in the northern part of the project area, referred to as the Ulan West Water Treatment Facility (refer to Figures 1.5 and 5.9). Water will be pumped to the staging dams, prior to treatment in the proposed Ulan West Water Treatment Facility and pumped via a pipeline to the proposed discharge structure on the Talbragar River. The Ulan West Water Treatment Facility will be used in conjunction with the proposed Ulan West staging dam to facilitate the treatment and discharge of up to 17.5 ML per day. The proposed Ulan West staging dams will be located adjacent to the proposed Ulan West Water Treatment Facility (refer to Figure 5.9). Water from the mine water management system will be directed to the Ulan West staging dam prior to treatment in the Ulan West Water Treatment Facility. The proposed staging dam will have a suitable factor of safety to cater for the received water volumes and has been designed as a turkeys nest dam and as such will not intercept natural catchment runoff. The proposed discharge pipeline is generally to be an above ground pipeline that is proposed to be constructed adjacent to Mona Creek to Uarbry Road and then continue to the Talbragar River (refer to Figure 5.9). The pipeline will be buried where it crosses Uarbry Road. A one-dimensional hydrodynamic XP-Storm flood model was developed of the Mona Creek catchment area to determine the 100 year ARI critical duration storm event flood extent for Mona Creek (refer to Figure 5.9). The proposed pipeline is typically located outside the 100 year ARI flood extent, except in specific locations where the pipeline must cross either tributaries of, or the main channel of, Mona Creek (i.e. upstream of Uarbry Road). The proposed pipeline crosses the floodplain of the Talbragar River from Uarbry Road to the proposed discharge structure (refer to Figure 5.9). At locations where the proposed pipeline must cross either a tributary of Mona Creek or the main channel the creek, crossing points will be designed to have no adverse impact on flood levels, flows or velocities. Where the pipeline crosses the Talbragar River floodplain, installation will be designed so as to not adversely influence flood levels, flows or velocities on the Talbragar River floodplain or pose pipeline integrity issues. The typical erosion and sediment controls to be used during the construction of the pipeline are outlined in Section 5.7. The proposed Talbragar River discharge structure will utilise an existing rock bar structure on the Talbragar River to assist in minimising the potential for scour and erosion at the discharge point. There is an existing culvert and crossing point over the Talbragar River at the rock bar. This culvert and crossing point was damaged during the June 2007 storm event. It is proposed to upgrade the culvert and reinstate the crossing point as part of the Project (refer to Figure 5.10) in order to facilitate the discharge point. The previous crossing point had a single pipe culvert installed with a diameter of approximately 375 millimetres. In the concept design for the crossing point (refer to Figure 5.10) it is proposed to install up to five 375 millimetre diameter pipes at the crossing point. It is proposed to maintain a similar top elevation of the crossing point roadway as the original crossing point. 2423/R06/Final October


38
39
40 Surface Water Impacts and Management The potential impacts associated with the proposed discharge structure include: erosion of the Talbragar River bed and banks with the proposed discharge of up to 17.5 ML per day (refer to Section ); increases in annual flow volumes in the Talbragar River with the proposed discharge of up to 17.5 ML per day (refer to Section ); changes to water quality in the Talbragar River with the proposed discharge of up to 17.5 ML per day (refer to Section ); and changes to flow velocities and levels with the construction of the proposed discharge structure and changes to the crossing point (refer to Section ) Potential Erosion Impacts of Proposed Discharge The channel of the Talbragar River where the proposed discharge structure will be constructed was modelled using HEC-RAS to determine the potential impacts of the proposed maximum discharge rate (i.e ML per day or 0.2 m 3 /s) on the river bed and banks. Modelling indicates that the Talbragar River at the proposed discharge structure has a flow capacity of approximately 10 m 3 /s (i.e. 870 ML per day) at bank full, with corresponding velocities in the order of 1.2 m/s to 1.3 m/s. It is proposed that discharges to the Talbragar River will be ceased if flows exceed two thirds of the within bank capacity (i.e. 6.7 m 3 /s). This flow rate will be monitored by use of a level gauge located on the river bank. The modelling indicates that discharges of up to 17.5 ML per day (i.e. 0.2 m 3 /s) will produce velocities in the order of 0.3 m/s in the reaches downstream of the proposed discharge structure. Velocities of 0.3 m/s are considered non-scouring and do not present an erosion risk for either the existing rock bar, reinstated crossing point or downstream of the crossing point. UCML propose to discharge to the Talbragar River during a range of flow events. The discharge strategy will be developed in consultation with DECCW and will consider hydraulic capacities, salt loads and resulting concentrations. Based on the river characteristics, including the rock bar, the most likely location for channel and bank impacts associated with the proposed discharges would be in the reaches immediately downstream of the discharge structure. Although, based on the proposed discharge strategy and associated modelled flow rates, it is not expected that any remediation works will be required in the Talbragar River, UCML proposes to monitor the channel and bank condition for approximately 200 metres downstream of the proposed discharge structure. Monitoring will be undertaken six monthly and after major flow events and will include visual inspections and recording (including photographic records at least every 25 metres) of channel and bank condition. If monitoring indicates that any impacts on the channel or banks of the river have occurred as a result of discharges, UCML will remediate these areas to similar to pre-discharge conditions Potential Changes to Annual Flow Volumes Discharge volumes for the Talbragar River are measured by the DECCW at Elong Elong (Stream Gauge ) approximately 100 kilometres downstream of the proposed discharge structure. Incomplete flow gauging records exist for the gauge at Elong Elong from early The catchment area of the Talbragar River at Elong Elong is approximately 3050 km 2 (DWE, 2006). The catchment area of the Talbragar River at the proposed discharge structure is approximately 675 km 2. The historical annual flow volumes for the Talbragar River at the proposed discharge structure were estimated by comparing the relative 2423/R06/Final October
41 Surface Water Impacts and Management catchment areas at Elong Elong and the catchment area at the proposed Talbragar River discharge structure (refer to Table 5.4). Two potential discharge volumes from the Ulan West Water Treatment Facility were then compared with the historical flowrates in the Talbragar River in Table 5.4. The maximum proposed discharge volume from the Ulan West Water Treatment Facility is 17.5 ML per day. The proposed average discharge volume from the Ulan West Water Treatment Facility is 7.5 ML per day which is consistent with the discharge strategy presented in Section 4.2. Flow Scenario 10 th percentile 50 th percentile 90 th percentile Table 5.4 Talbragar River Annual Flow Volumes Measured at Elong Elong Flow Volume Annual / Daily (ML / ML/day) Estimate at proposed discharge structure Elong Elong Proportion of proposed discharge to natural flow volume Discharge of 17.5 ML/day Estimate proposed discharge structure Discharge of 7.5 ML/day Elong Elong Estimate proposed discharge structure 2,381 / / % 1212% 115% 519% 51,805 / ,465 / % 56% 5% 24% 154,371 / ,164 / % 19% 2% 8% Source: Elong Elong flow volumes DWE, 2006 and Analysis indicates that discharges of up to 17.5 ML per day will result in flow velocities in the order of 0.3 m/s and flow depths of approximately 200 millimetres in the reaches of the Talbragar River downstream of the proposed discharge point. The analysis indicates that the proposed discharge of up to 17.5 ML per day may increase average annual flow volumes (50 th percentile) by up to 56 per cent at the proposed discharge structure and by up to 12 per cent Elong Elong. The proportional increase in annual flow volumes is estimated to range between a 1212 per cent increase in 10 th percentile (i.e. dry) flow years to a 19 per cent increase in 90 th percentile (i.e. wet) flow years. The predicted increase in annual flow volume in the Talbragar River for the proposed discharge strategy flow rate of 7.5 ML per day is approximately 24 per cent at the proposed discharge structure and approximately 5 per cent at Elong Elong during a 50 th percentile (i.e. average) flow year (refer to Section 4.2 and Appendix A). Where possible, UCML proposes to vary the discharge regimes by varying the water flow rates between the various discharge structures based on the environmental and water requirements of the Project. At the Talbragar River discharge this will enable UCML to replicate some of the wetting and drying cycles that occur naturally within the Talbragar River Potential Changes to Water Quality Electrical conductivity is currently measured by DECCW at the Elong Elong stream gauging location, approximately 100 kilometres downstream of the proposed Talbragar River discharge structure and by UCML at two locations on the Talbragar River near the proposed discharge structure between October 2008 and December /R06/Final October
42 Surface Water Impacts and Management Analysis of the DECCW records (2000 to 2006) indicates that electrical conductivity in the Talbragar River ranges typically between approximately 1360 µs/cm and approximately 3170 µs/cm, with an average electrical conductivity of approximately 2300 µs/cm. Historical records indicate that the electrical conductivity typically decreases during flood flows (i.e. in excess of 900 ML per day) to less than 1000 µs/cm. The UCML water quality monitoring indicates that average electrical conductivities range between 740 µs/cm and 920 µs/cm, indicating that the Talbragar River potentially has lower electrical conductivities in the upstream reaches in the vicinity of the proposed Talbragar discharge structure. It is proposed to discharge up to 17.5 ML per day at the Talbragar River discharge structure of water with an average electrical conductivity within the range of historical electrical conductivity levels recorded within the Talbragar River at Elong Elong and the proposed discharge structure and in accordance with ANZECC Guidelines (ANZECC, 2006). The water discharged to the Talbragar River will be treated (using similar tried and tested technologies (i.e. reverse osmosis)) and blended using similar methods to that used at the existing Bobadeen Water Treatment Facility (refer to Section 3.3). Water quality limits for discharges to Ulan Creek via the Bobadeen Water Treatment Facility (refer to Section 3.3) are set to 900 µs/cm. UCML proposes to utilise a similar system at the Ulan West Water Treatment Facility. It is proposed to set water quality discharge limits from the Ulan West Water Treatment Facility based on historical electrical conductivity levels in the Talbragar River, taking into consideration total salt load and fluctuations during low and high flow periods. As such the proposed discharge of 17.5 ML per day will be designed to have negligible effect on water quality in the Talbragar River Potential Changes with Reinstatement of Crossing Point Using the HEC-RAS model developed of the channel of the Talbragar River where the proposed discharge structure will be constructed (refer to Section ) the potential impact that the reinstated/upgraded crossing point might have on flow velocities and flood levels in the river were examined. The Talbragar River both upstream and downstream of the proposed discharge structure has a longitudinal grade of approximately 0.17 per cent. This grade is fairly low and is typical of the meandering nature of the river channel. Modelling results confirm that the original crossing point would have had negligible impacts on downstream flow levels or velocities. Modelling results also confirm that the reinstated/upgraded crossing point is predicted to have negligible impacts on flow velocities and flood levels downstream of the crossing point. Modelling also indicates that the proposed reinstated/upgraded crossing point may influence flood levels upstream of the rock bar for approximately 40 metres. The modelled influence includes increases in potential flood levels for flow rates of up to approximately 80 m 3 /s (i.e ML per day). This modelled increase in flood levels will be contained within the existing pond immediately upstream of the natural rock bar structure. The proposed reinstated/upgraded crossing point is also expected to have a reduced impact on low level flows within the Talbragar River compared to the original crossing point. It is proposed to upgrade the single pipe culvert to five 375 millimetre diameter pipes. Modelling 2423/R06/Final October
43 Surface Water Impacts and Management indicates that the five 375 millimetre diameter pipes will provide flow conveyance for up to approximately 1.5 m 3 /s (i.e. 130 ML per day) prior to the crossing point being overtopped Ulan West Surface Facilities The proposed Ulan West surface facilities will be constructed to the east of the Ulan West portal (refer to Figure 1.3). The Ulan West surface facilities will provide a similar function to the existing Ulan No. 3 underground surface facilities and will be used to support the Ulan West underground mining operation. Vehicle access to the site will be via the proposed Ulan West access road (refer to Figure 1.4). Surface water management for the Ulan west surface facilities site is discussed in Section 5.3 in conjunction with the surface water management for the open cut pit extension Minor Infrastructure The Project will require the construction of a range of infrastructure components associated with the proposed mining operation (refer to Figures 1.3 to 1.6). This infrastructure will include: access roads, infrastructure corridors and overland conveyors; ancillary mining surface infrastructure and services; and continued operation of the existing Bobadeen Quarry Access Roads and Overland Conveyors The proposed access roads for the Project are shown on Figure 1.4. Water management controls will be constructed for the access roads in accordance with the Blue Book (Landcom, 2004 and 2008) and in accordance with the erosion and sediment control measures outlined in Section 5.7. Two new overland conveyors are proposed as part of the Project (refer to Figure 1.7). The Ulan West overland conveyor will convey coal from the Ulan West underground portal to the proposed ROM hub stockpile complex and the CHPP area. The Ulan No. 3 overland conveyor will convey coal from the existing ROM hub stockpile to the CHPP area. The overland conveyors will cross the upstream end of the Goulburn River diversion to the north of the CHPP area. Where the proposed overland conveyors cross over the Goulburn River diversion the overland conveyor crossings will be designed so as to not adversely influence flood levels, flows or velocities in the Goulburn River diversion. Water management controls for the proposed overland conveyors will be constructed in accordance with the Blue Book (Landcom, 2004) and in accordance with the erosion and sediment controls outlined in Section 5.7. As part of the overland conveyor construction a catch tray (or similar) will be installed on the underside of the overland conveyors where they pass over the Goulburn River diversion to ensure that any spillage cannot enter the diversion. A sump will be constructed near the north or south bank of the Goulburn River diversion to recover any potential spillage from the overland conveyor system. 2423/R06/Final October
44 Surface Water Impacts and Management Ancillary Mining Surface Infrastructure and Services The ancillary surface mining infrastructure components required to support the proposed underground mining operations include: ventilation fans; service boreholes; dewatering boreholes; infrastructure corridors; pumps, pipelines and drainage works; and services, including power and telecommunications. The locations of these infrastructure components are shown on Figures 1.3 and 1.6. Each of the Project s infrastructure components listed above will potentially result in minor disturbance to the land surface. It is proposed that for all works listed above, construction erosion and sediment control plans will be developed as a part of the detailed designs. The construction and erosion and sediment control plans will incorporate the requirements listed in Section 5.7. The proposed Ulan West surface facilities will have a dedicated STP with primary and secondary treatment systems. The proposed man riding shaft and associated facilities, the Ulan West Water Treatment Facility and other permanent surface infrastructure sites will have on site aerobic wastewater treatment systems. All STPs will continue to be maintained by licensed contractors Continued Operation of the Bobadeen Quarry Basalt extracted from the existing Bobadeen Quarry will be used to provide ballast for the construction and maintenance of internal roads, hardstand areas and other infrastructure areas within the mine. The footprint of the quarry is currently approximately 16 hectares. The quarry will be operated on a campaign basis using earth moving equipment, crushing equipment and/or blasting to extract up to 100,000 tonnes per year. Existing erosion and sediment controls will continue to be used at the quarry and will be consistent with the requirements listed in Section 5.7 for the life of the Project. 5.7 Erosion and Sediment Control Measures Construction The surface water assessment has been conducted on the basis that erosion and sediment control measures will continue to be incorporated into the detailed construction plans for, and built as a part of the additional infrastructure to be constructed as a part of the Project. All erosion and sediment control measures will be consistent with the objectives of the existing Ulan Mine Water Management Plan (UCML, 2007) and will be carried out in accordance with relevant guidelines for erosion and sediment control, including: 2423/R06/Final October
45 Surface Water Impacts and Management Managing Urban Stormwater Soils and Construction (the Blue Book) Volume 1 (Landcom, 2004) and Volume 2E Mines and Quarries (Landcom, 2008); and where relevant to a standard consistent with Draft Guidelines for the Design of Stable Drainage Lines on Rehabilitated Minesites in the Hunter Coalfields (DIPNR, undated). The erosion and sediment control measures proposed to be incorporated into the infrastructure construction during the Project to control the quality of runoff from the site include: construction of erosion and sediment controls prior to the commencement of any substantial construction works; construction and regular maintenance of sediment fences downslope of disturbed areas, including the construction sites for the sediment dams and diversion drains and catch drains; applying gypsum, where required, to reduce the dispersibility of the subsoils that will be disturbed and to minimise the potential for tunnel erosion and surface rilling of disturbed or reshaped areas. The application rate to be determined by site specific soil testing as required; seeding and controlled fertilising of disturbed areas to provide for rapid grass cover. Areas will be seeded with a grass mix specific to the needs of the area to be grassed; inspection of all works daily and immediately after storm events to ensure sediment and erosion controls are performing adequately; provision for the immediate repair or redesign of sediment and erosion controls that are not performing adequately; and placement of floatation booms (or other devices performing the same function) at the outlet of sediment dams to trap possible oil and grease spills. In addition to the above erosion and sediment control measures, the construction plans will detail the specific inspection, maintenance and revegetation requirements for each works area based on the construction program schedule. These control measures will be set out in a detailed Erosion and Sediment Control Plan for the Project Operations This surface water assessment has been conducted on the basis that as part of the operational plans for the Project, erosion and sediment control measures will be designed and constructed to a standard consistent with: Managing Urban Stormwater: Soils and Construction (the Blue Book) Volume 1 (Landcom, 2004) and Volume 2E Mines and Quarries (Landcom, 2008); and Draft Guidelines for the Design of Stable Drainage Lines on Rehabilitated Minesites in the Hunter Coalfields (DIPNR, undated). 2423/R06/Final October
46 Surface Water Impacts and Management Water quality and erosion and sediment control measures proposed to be implemented for the Project include: constructing diversion drains upslope of areas to be disturbed to convey clean runoff away from disturbed areas; clearly identifying and delineating areas required to be disturbed and ensuring that disturbance is limited only to those areas, clearing vegetation only as required to achieve the works and minimising machinery disturbance outside of these areas; limiting the number of roads and tracks established; constructing catch drains downstream of disturbed areas to convey runoff to sediment dams; constructing sediment dams to capture, contain and treat runoff from disturbed areas; designing sediment dams to be capable of treating contained dirty water to achieve sediment concentrations of 50 mg/l or less as a result of prolonged wet periods when discharges from the site may be required; constructing access road and earthworks cut and fill batters at slopes (of 1V:3H or less, where possible), to maximise long term stability; reshaping, topsoiling and vegetating road cut and fill batters as soon as practical; progressively stripping and stockpiling topsoil for later use in rehabilitation; diverting clean upstream runoff away from disturbed areas; regular maintenance of erosion control works and rehabilitated areas; prompt revegetation of areas as soon as earthworks are complete; and the placement and maintenance of oil management systems downslope of key infrastructure and high traffic hardstand areas. Topsoil stockpiles are proposed to be placed within the perimeter of the dirty water management system where runoff will be contained within the mine water management system. Where necessary, sediment fences are to be placed around the downslope batter of all topsoil stockpiles to reduce the potential for sediment transport from the stockpile. Stockpiles that are to remain undisturbed for periods of greater than six months will be grassed. 2423/R06/Final October
47 Summary of Potential Impacts on Existing Environment 6.0 Summary of Potential Impacts on Existing Environment 6.1 Open Cut Mining Areas As discussed in Section 4.0, future mine plans indicate that the catchment area of the Ulan complex mine water management system, which is currently approximately 1520 hectares, will decrease to approximately 590 hectares over the life of the Project. As mining and rehabilitation of mined areas progresses and overburden emplacement areas are satisfactorily rehabilitated and made externally draining, annual catchment yields in Ulan Creek will increase. As such, the catchment contribution to Ulan Creek will also start to more closely replicate the flow regimes that existed prior to the mine being developed. 6.2 Underground Mining Areas It is considered that the predicted subsidence impacts will not result in any substantial ponding or drainage realignment within the project area. However, a number of monitoring points have been identified (refer to Figure 5.2) where, based on the topography, potential impacts are more likely. If monitoring (refer to Section ) indicates that remediation works are required, remediation works will need to maintain channel grades and take into consideration channel stabilities and existing channel characteristics. If remediation works are required, these works have the potential to generate short term impacts in terms of water quality while the remediation works are being undertaken and stable vegetated post mining landforms are being achieved. Potential water quality impacts in terms of downstream users and downstream ecosystems will principally be due to the potential for increased sediment generation and export of sediment off site. To mitigate this potential impact it is proposed to implement a number of erosion and sediment control measures (refer to Section 5.2 and 5.7). The implementation of the proposed erosion and sediment control measures will ensure that underground mining and surface remediation works do not have a significant adverse impact on downstream water users or on downstream ecosystems. 6.3 Ulan Complex Mine Water Management System In terms of water quality, the only discharges from the Ulan complex mine water management system other than clean water diversions will be from licensed DECCW discharge points which are monitored and controlled. Consequently, potential water quality impacts will be limited to that associated with the EPL. As a result it is considered that the Project will not significantly alter water quality or ecology of downstream systems. It is also considered that the Project will not adversely impact on the potential use of water for downstream users on the local creek systems or rivers (refer to Section 5.2.6). UCML propose to continue the current operating regimes and irrigation volumes at the Bobadeen Irrigation Scheme and as such no changes are predicted to occur to the salinity impacts related to this scheme. As part of the implementation of the Bobadeen Irrigation Scheme in 2003, a salinity offset area was established to offset the salt load within the catchment due to irrigation. This scheme was developed in consultation with DECC and the Department of Land and Water 2423/R06/Final October
48 Summary of Potential Impacts on Existing Environment Conservation (now DECCW). The Department of Land and Water Conservation identified that 4460 hectares of land is required to offset the salt load associated with the operation of the Bobadeen Irrigation Scheme (DLWC 2003). It is noted that the Moolarben Coal Mines mining leases overlap with the lands available for salinity offset. Moolarben Coal Mines is currently in negotiations with UCML to compensate for this reduction in capacity. As part of these negotiations Moolarben Coal Mines has entered into a water sharing agreement with UCML to take saline water from the site (refer to Section ). The proposed water treatment facilities and associated discharge strategy will provide UCML with flexibility to discharge excess water whilst minimising potential impacts on downstream ecology. UCML will continue to supply surplus water, under agreement (refer to Section ) to Wilpinjong Coal Mine and the Moolarben Coal Project. Recent studies undertaken by Gilbert & Associates (2005) and Patterson Britton & Partners (2006) respectively indicate that Wilpinjong Coal Mine will require water sourcing from a groundwater borefield and the Moolarben Coal Project, during average rainfall years, will have a neutral water balance during the early stages (i.e. up to the first ten years) of these projects. As such it is considered that water sharing between UCML will assist in reducing the overall potential impact on regional surface waters and groundwaters for at least the next ten years. 6.4 Water Planning Context Consistent with the current planning context related to surface water, the Project has been assessed against the following water planning policies/plans: State Water Management Outcomes Plan (SWMOP); Hunter-Central Rivers Catchment Action Plan; Central West Catchment Action Plan; Water Management Act 2000; and Water Act State Water Management Outcomes Plan and Catchment Action Plans The State Water Management Outcomes Plan (SWMOP) and the Hunter-Central Rivers Catchment Management Authority and Central West Catchment Management Authority Catchment Action Plans provide guidelines for water management in NSW, the Hunter Valley and the Macquarie and Talbragar Rivers respectively and are therefore relevant to the Project. The introduction of the Water Management Act 2000 led to the development of a statewide policy on water management known as the SWMOP. This plan provides direction for all water management actions in NSW by setting out the overarching policy context, targets and strategic outcomes for NSW water management. The intent of Catchment Action Plans (CAPs) is to identify the key natural resource features of the catchment that the community and government wish to see protected or improved, and then to determine the best way to achieve these outcomes. The CAPs guide how improvements in natural resources will be achieved in the next ten years and define where effort and funding should be focussed to get the best protection and improvement in natural resources and the most benefits for the community. The CAPs build on planning and 2423/R06/Final October
49 Summary of Potential Impacts on Existing Environment activities defined in the catchment blueprints, regional vegetation management and water sharing plans. The Hunter-Central Rivers Catchment Authority Catchment Action Plan and the Central West Catchment Action Plan both commenced in 2006 and have terms of ten years. The Project is consistent with the SWMOP and the Catchment Actions Plan objectives both within the project area and on potential downstream interactions. This will be achieved as: the majority of surface infrastructure will be located within the Ulan complex mine water management system minimising the potential for off-site impacts; the Project will result in only minor disturbance of land outside of the Ulan complex mine water management system. The proposed monitoring and potential surface remediation measures and associated erosion and sediment controls will effectively minimise environmental impacts (refer to Section 5.7); the open cut extension provides opportunity to reshape and rehabilitate the existing open cut pit to a free draining landform; rehabilitation of the Goulburn River diversion, including establishment of riparian vegetation; to meet surplus water management requirements, water sharing arrangements have been negotiated with two neighbouring coal mines. Water sharing will potentially reduce the impact of coal mining on the water resources of the region (refer to Section 4.3); and water will be discharged from the site via licensed discharge points to Ulan Creek and the Talbragar River to reduce the predicted water surplus on site (refer to Section 4.3) Water Management Act 2000 and Water Act 1912 As yet no Water Sharing Plans have been finalised for the areas in the vicinity of the project area including surface water and groundwater within the Talbragar River catchment area. Therefore the project area within the Talbragar River catchment area is governed by the Water Act 1912 until such plans are gazetted. The Water Sharing Plan for the Hunter Unregulated and Alluvial Water Sources 2009 commenced on 1 August The Water Sharing Plan for the Hunter Unregulated and Alluvial Water Sources 2009 is a macro water sharing plan. That is, a plan that applies to a number of water sources across catchments or different types of aquifers. The plan is broken into a number of extraction management units (EMU). The sections of the project area that lie to the east of the Great Dividing Range fall within the Upper Goulburn River Management Zone of the Goulburn River EMU. Key aspects of the Water Sharing Plan for the Hunter Unregulated and Alluvial Water Sources 2009 are listed below and commented on in regard to the surface water interactions with the Project. The Plan provides for no new growth in water entitlements with the annual extraction limit typically set to the current annual extraction limits. The Project does not propose to extract surface water from the surrounding streams or rivers. 2423/R06/Final October
50 Summary of Potential Impacts on Existing Environment Extraction of water from a runoff harvesting dam requires an unregulated river access license nominating an approval for a runoff harvesting dam, unless the dam is within the maximum harvestable right dam capacity for the property on which it is located, in which case no licences or approvals are required. There are several dams proposed as part of the Project. These dams include clean water catch dams for control of upstream runoff/flooding and sediment dams. The water collected in the clean water catch dams will be diverted around the open cut pit extension. The water captured in the sediment dams will either be used for dust suppression or discharged to downstream watercourses. No new runoff harvesting dams are proposed for the Project. All water storage dams to be constructed are to be turkeys nest dams with no contributing upstream catchment. 6.5 Cumulative Impacts UCML will continue to discharge surplus water to the Goulburn River system and propose to also discharge surplus water to the Talbragar River system. Any discharges from the site will continue to be managed under the EPL. The proposed discharges from the site will assist in offsetting predicted losses to baseflows to the Goulburn and Talbragar River systems for the duration of the Project (refer to EA Section 5.3 and Appendix 6). The reinstatement of Ulan Creek catchment area through progressive rehabilitation (refer to Section 5.3.1) will return runoff from approximately 880 hectares of catchment area to Ulan Creek. The average regional runoff is 0.7 ML per hectare (based on the NSW Farm Dams harvestable rights calculator). As such the reinstatement of Ulan Creek catchment area is estimated to return approximately 616 ML per year (i.e. approximately 1.69 ML per day) of runoff to Ulan Creek. This will offset the estimated baseflow losses of 0.11 ML per day to ML per day (refer to Appendix 6 of the EA) in the Goulburn River system after Project completion. The Talbragar River does not have a persistent long term baseflow and as such sustains small flows during dry periods and ceases to flow during drought periods. As such the long term predicted losses to baseflows in the Talbragar River system are expected to have negligible impacts on the streamflow conditions in the Talbragar River. A draft water management plan for the Collaburragundy - Talbragar River Groundwater Management Unit (GMU) was completed in 2006 by the Department of Land and Water Conservation (DLWC). The GMU is located approximately 12 kilometres downstream of the proposed Talbragar River discharge location. The plan indicates that the GMU has a sustainable yield of 7000 ML per year. The sustainable yield was determined based on the percentage of recharge. The estimated long term baseflow losses to the Talbragar River system (refer to Appendix 6 of the EA) are approximately 140 ML per year, assuming the modelled worst case baseflow loss actually occurs. This equates to a minor portion (approximately 2 per cent) of the sustainable yield of the Collaburragundy Talbragar River GMU. The surface water assessment of the predicted subsidence impacts indicates that the catchment boundaries of the creek systems to be undermined will not change significantly. It is also considered unlikely that any significant ponding or storage of surface runoff will occur. A series of monitoring points have been identified to monitor potential drainage grade changes, ponding and dam spillway changes. 2423/R06/Final October
51 Summary of Potential Impacts on Existing Environment Sediment and erosion control measures are proposed to ensure that there will be no significant impact on downstream water qualities if subsidence remediation works are required. On this basis it is considered that the proposed development will not result in adverse cumulative impacts on water use, flows or qualities in the surrounding areas. 2423/R06/Final October
52 Monitoring, Licensing and Reporting Procedures 7.0 Monitoring, Licensing and Reporting Procedures 7.1 Construction Phase Works During the construction of infrastructure for the Project all works and their erosion and sediment controls will be inspected on a frequent basis to ensure that all required controls are in place and effective. Following the completion of construction works, the work areas will be inspected in accordance with UCML s current inspection program and after any rainfall events generating runoff until revegetation and stabilisation of drainage structures are complete. All erosion and sediment controls and their monitoring and maintenance requirements for the construction phase of major infrastructure components of the Project will be detailed in a construction plan. 7.2 Operational Works During the operational phase of the Project, monitoring of the water management controls will be undertaken on a monthly basis and after major storm events (refer to Section 3.4). The walls of all water management dams will be inspected biennially (every two years) for their structural integrity and for any maintenance requirements. The walls of the water management dams will be grassed and kept free of any trees and shrubs. 7.3 Decommissioning Assuming that the mine is decommissioned at the end of the Project (i.e. 21 years), water management dams will either remain in use as farm dams or will be removed (refer to Figure 5.7). If the dams are to be retained, the capacity of the dams will be reviewed and the size/volume modified, if required. The proposed diversion drains, catch drains and site bunding will remain in place as part of the final landform. All buildings/workshops and associated hardstand and sealed areas will be removed and revegetated. During the decommissioning phase all access and ventilation shafts to the underground workings will be sealed and landscaped appropriate to the surrounding area. Any future development application beyond the 21 year life of the Project will include a revision of the existing soil and mine water management system. 7.4 Surface Water Monitoring and Reporting The surface water quality monitoring network for UCML was extended to provide baseline data for the Project (refer to Sections 3.4 and ). The monitoring and reporting program will be continued for the life of the Project. All monitoring results will be reported in the UCML AEMR which is distributed to DoP, DII (formerly DPI), DECCW (formerly DECC and DWE) and other relevant government agencies and made available to the community through UCML s website. All monitoring data will be retained in an appropriate database. 2423/R06/Final October
53 Monitoring, Licensing and Reporting Procedures The results of the water quality monitoring will be used to review the effectiveness of the UCML mine water management system on an ongoing basis. Water usage, rainfall, dam volumes and discharges (including transfers) at the Ulan complex will also continue to be monitored for the entire operation to assist in the management of the mine water management system. Once operational, the water management dams will be monitored to ensure that any overflows or discharges are to an appropriate standard and in accordance with licence conditions. 7.5 Contingency Measures Water The Project will continue to have water in excess of its operational needs. With the proposed discharge facilities there is considerable flexibility in managing the volume of water that is discharged from the site. Management options include cycling the use of the discharge facilities and varying the rate at which water is discharged from the site. Water sharing opportunities may provide additional discharge capacity and additional water storage opportunities may be available within the open cut extension and underground voids if required Soil If surface stabilisation during remediation works is required due to surface rilling, tilling with gypsum or lime during reshaping and prior to revegetation may be required and additional erosion and sedimentation controls will be implemented (refer to Section 5.7). 7.6 Licensing Requirements Water Act and Water Management Act There is only one water sharing plan, Water Sharing Plan for the Hunter Unregulated and Alluvial Water Sources 2009 commenced for the areas in the vicinity of the project area including surface water and groundwater. Therefore the surface waters of the project area are governed by the Water Management Act 2000 and the groundwater associated with the hardrock aquifers (i.e. coal seams) is governed under the Water Act The potential implications of the Water Sharing Plan Hunter Unregulated and Alluvial Water Sources 2009 are considered in Section 6.5. Groundwater that flows into the underground mines will continue to be pumped from the mine under existing Part 5 licences of the Water Act A variation to the existing Part 5 licences has been requested to allow for the extraction of the predicted increases to groundwater inflows. Potable water needs for the site will continue to be provided through the extraction of groundwater from an on-site borehole (PB1C) under licence 20BL and treated at water treatment facilities on site. UCML will continue to monitor its potable bore water supply and consult with DECCW if any bore refurbishment or replacement is required. 2423/R06/Final October
54 Monitoring, Licensing and Reporting Procedures Protection of the Environment Operations Act The proposed mine water management system will continue to be licensed under the Protection of the Environment Operations Act 1997 Section 120, with the existing licence varied to include new activities associated with the Project. Variations will be requested to EPL No. 394 to allow the proposed discharge to Talbragar River and the proposed water transfers to Wilpinjong Coal Mine and the Moolarben Coal Project. 2423/R06/Final October
55 References 8.0 References ANZECC/ARMCANZ, National Water Quality Management Strategy: Australian Guidelines for Water Quality Monitoring and Reporting. DIPNR, undated. Draft Guidelines for the Design of Stable Drainage Lines on Rehabilitated Minesites in the Hunter Coalfields. DIPNR, PINNEENA Water Resources Database. DWE, undated. Draft Guidelines for Management of Stream/Aquifer Systems in Coal Mining Developments Hunter Region. Gilbert & Associates, Wilpinjong Coal Project, prepared for Wilpinjong Coal Pty Limited. Landcom, (2004). Managing Urban Stormwater: Soils and Construction Volume 1. Landcom, (2008). Managing Urban Stormwater: Soils and Construction Volume 2E Mines and Quarries. Mackie Environmental Research, Ulan Coal Continued Operations Project Groundwater Assessment. Murphy, B.W. and Lawrie, J.W., Soil Landscapes of the Dubbo 1: Map Sheet. Department of Land & Water Conservation of NSW, Sydney. Patterson Britton & Partners Pty Ltd, Moolarben Coal Project Surface Water Assessment, prepared for Moolarben Coal Mines Pty Ltd. Strata Control Technology, Part 3A Subsidence Assessment, Ulan Coal Continued Operations. UCML, Ulan Coal Mines Limited Water Management Plan. UCML, Annual Environmental Management Report. Umwelt, Ulan Mine Water Management Report for Subsidence Management Plan Approval Conditions and 25. URS, Goulburn River Diversion - Long Term Stability Strategy, prepared for Ulan Coal Mines Limited. Wells Environmental Services, Moolarben Coal Project Environmental Assessment Report Volume 1. Yoo, E K, Tadros, N Z, and Bayly, K W, A Compilation of Geology of the Western Coalfield. Geological Survey of New South Wales, Report GS2001/204 (unpublished) HITS water database. 2423/R06/Final October
56 APPENDIX A Complex Water Balance
57 Appendix A Complex Water Balance Prepared by on behalf of Ulan Coal Mines Limited Project Director: Project Manager: Barbara Crossley Rod Williams Report No. 2423/R06/AA Date: October /20 The Boulevarde PO Box 838 Toronto NSW 2283 Ph: Fax: mail@umwelt.com.au Website:
58 Complex Water Balance Table of Contents TABLE OF CONTENTS 1.0 Introduction Overview Major Factors Existing Ulan Complex Water Balance Overview Data Sources Model Outputs /2008 Complex Water Balance Predicted Water Balance Model Structure Data Sources Rainfall and Evaporation Predictive Water Balance Model Outputs Water Management Strategy On-Site Water Storages Off-Site Discharge and Water Sharing Infrastructure Future Water Management Strategy Example Discharge Strategy FIGURES 2.1 Ulan Complex Water Balance Summary Ulan Complex Predictive Water Balance Graphical Summary Year 1 (2010) Ulan Complex Predictive Water Balance Graphical Summary Year 6 (2015) Ulan Complex Predictive Water Balance Graphical Summary Year 8 (2017) Ulan Complex Predictive Water Balance Graphical Summary Year 13 (2022) Ulan Complex Predictive Water Balance Graphical Summary Year 20 (2029) /R06/AA October 2009 i
59 Complex Water Balance Predicted Water Balance 1.0 Introduction 1.1 Overview A reporting site water balance model was developed for UCML during The reporting site water balance model has been used to determine monthly water balances for the Ulan complex since the start of The development of the reporting site water balance followed on from and built on work completed in a series previous studies undertaken by Umwelt, including: 1. Water Balance Assessment Report (September 2006). 2. Water Management Plan (January 2007). 3. Water Management Report for Subsidence Management Plan Approval Conditions and 25 (January 2007). The Ulan complex water balances for 2007 and 2008 are discussed in further detail in Section 2.0. A predictive water balance model was prepared for the Project based on likely water uses and likely water makes from the associated open cut extension, underground mining and surface facilities. The objective of the predictive water balance is to establish the requirements of the water management system for the Project. The predictive water balance model and its outcomes are discussed in further detail in Section 3.0. Across the Ulan complex there are a number of existing water discharge facilities and as part of the proposed project some additional discharge facilities are planned. These facilities and the proposed water management strategy for the Ulan complex are discussed in further detail in Section Major Factors The major factors affecting the Ulan complex water balance are: Inflows: catchment runoff; direct rainfall onto dam surfaces; groundwater extractions for potable water supply; and groundwater inflows to the underground operations. Outflows: discharges to Ulan Creek (Bobadeen Water Treatment Facility); dust suppression; evaporation from dam surfaces; 2423/R06/AA October
60 Complex Water Balance Predicted Water Balance water lost (i.e. bound) to product coal, coarse reject and water trapped in tailings; and irrigation (from Bobadeen Dam). Changes in the inventory of water on site. Each of these major components is considered in the Ulan complex water balance models (refer to Sections 2.0 and 3.0). 2.0 Existing Ulan Complex Water Balance 2.1 Overview The water balance model contains a series of localised water balance calculations for each of the main components of the water management system. These local water balances are calculated on a monthly basis and then compiled into a six month water balance for the complex. The water balance for the complex is a compilation of the local water balances derived for each component of the water management system. The water balances around each component of the water management system take into account the flow of water into and out of each system component and changes in the water inventory or volume of water stored in each system component. The model uses a series of worksheets to collate data, make calculations and output summary tables. The model also uses inputs from other Microsoft Excel spreadsheets which calculate the volume changes in the East Pit and Ulan No. 3 underground goafs. 2.2 Data Sources Data used in the model comprises the following sources: daily telemetry data (e.g. volumes pumped and levels); fortnightly recorded storage levels (e.g. old underground goafs); daily rainfall data recorded by UCML; daily evaporation data from Bureau of Meteorology (BoM) (Scone); daily production data; and catchment areas delineated for the water management system in March Model Outputs The model outputs are used to: provide data for calibration of the regional groundwater model; provide data for Annual Environment Management Reports; 2423/R06/AA October
61 Complex Water Balance Predicted Water Balance provide data for reporting against surface water and groundwater licences; and as a management tool to identify/assess the mine water management system performance /2008 Complex Water Balance The water balance for the Ulan complex during the 2007 and 2008 calendar years was compiled from data in the reporting water balances. A summary of the 2007 and 2008 water balances for the complex is shown in Table 2.1. The inflows, outflows and discharges at the Ulan complex for the 2007/2008 period are also shown graphically on Figure 2.1. Table and 2008 Water Balance Summaries Production Item ROM Coal tonnes tonnes Product Coal tonnes tonnes Meteorology Period Rainfall 764 mm 712 mm Estimated Period Runoff 212 mm 151 mm Period Pan Evaporation* 1694 mm 1694 mm Water Inputs - Rainfall on Dams and Ponds and Catchment Runoff 4574 ML 3638 ML - Groundwater to Underground 2783 ML 2850 ML - Potable Water Bore 50 ML 46 ML - In ROM Coal 305 ML 203 ML Water Outputs - Evaporation from Dams and Ponds ML ML - Other losses (seepage, etc) -372 ML -285 ML - Haul Road Dust Suppression ML -833 ML - Lost with Product Coal -548 ML -680 ML - Lost with Coarse and Fine Rejects -257 ML -164 ML - Irrigation ML ML - Discharged Off-site -842 ML ML Summary Gross Water Inputs 7712 ML 6737 ML Gross Water Outputs ML ML - as water discharged from site ML ML Net Water Balance 2516 ML 1242 ML * Regional average evaporation Scone BoM 2423/R06/AA October
62 Complex Water Balance Predicted Water Balance Figure Ulan Complex Water Balance Summary Period of Interest Evaporation (dams) with ROM Dust suppression Evaporation (dust suppression) Other losses (seepage, etc) 8212 Ulan Mine -657 Freshwater s Moisture bound with product coal Groundwater Change in Inventory Moisture bound 4380 ML rejects/tailings Irrigation Off-site discharge Total Inputs Net Water Balance Total Outputs ML 3758 ML ML 19.8 ML/day 5.1 ML/day ML/day 3.0 Predicted Water Balance 3.1 Model Structure The Ulan complex predictive water balance model is a yearly time step water balance model of the Project. The predictive water balance model is programmed in Microsoft Excel and utilises software to undertake a Monte Carlo analysis to calculate the probability of different water balance outcomes based on the variability of the model input data. The predictive water balance considers the variations in following parameters: rainfall; evaporation; catchment runoff for natural and rehabilitated ground surfaces; catchment runoff for extraction areas and disturbed ground surfaces; catchment runoff for impervious areas; effective evaporation; coal handling and processing water requirements; dust suppression requirements; and potable water consumption. 2423/R06/AA October
63 Complex Water Balance Predicted Water Balance The predictive water balance model uses a series of modules to represent the catchments and the components of the Project. These modules are the same as those used in the reporting water balance (refer to Section 2.0). The predicted water balance does not take into account any water that will be sourced to or discharged from the site. However, the water demands or surplus/discharge requirements are able to be considered based on the model outputs and the associated predicted water balance. The outputs from the predictive water balance model were cross-checked against the outputs for the reporting water balance model for the water balances for 2007 and 2008 using actual rainfall, evaporation and production data. The predictive water balance model provides the same outputs as determined for the reporting water balance for these years. 3.2 Data Sources There are three main water sources (i.e. inputs) for the Project: catchment runoff / rainfall on dams The future catchment areas for the surface facilities were determined based on the proposed mine plans over the life of the mine. The range in potential rainfall and runoff characteristics were determined based on 36 years of matched daily rainfall and evaporation data from Scone BoM station (refer to Section 3.2.1). groundwater inflow to the underground goafs Groundwater inflows to the underground goafs of Ulan No. 3 underground and Ulan West underground were sourced from the Ulan Coal Continued Operations Groundwater Management Studies (MER, 2009). potable water supply Potable water supply for the complex was determined based on meeting the potable water requirements for the proposed staff levels for the Project and the high quality water used by the longwall machinery. There are five main water demands (i.e. outputs) for the Project plus evaporative losses from the mine water dams. The details of each of the water demands/losses are as follows: water lost to product coal The rates of water lost to product, including product from the crusher plant and coal handling and processing plant (CHPP), used in the predictive water balance were based on the existing water losses to product (derived from the 2007 and 2008 water balances). The water lost to product was calculated based on the production schedule for the Project, which range up to 20 Mtpa. water lost to coarse rejects The rate of water lost (i.e. bound) to coarse rejects used in the predictive water balance were based on the existing water losses to coarse reject (derived from the 2007 and /R06/AA October
64 Complex Water Balance Predicted Water Balance water balances). The water lost to coarse reject was calculated based on the production schedule for the Project, which range up to 20 Mtpa. water lost to fine rejects The rate of water lost (i.e. bound) to fine rejects (i.e. tailings) used in the predictive water balance were based on the existing water losses to fine reject (derived from the 2007 and 2008 water balances for the East Pit tailings dam, including rates of water recovery)). The water lost to fine reject was calculated based on the production schedule for the Project, which range up to 20 Mtpa. dust suppression The lengths of haul roads and ancillary roads requiring dust suppression for the Project have been determined based on the concept mine plans. potable water The potable water demand is based on the predicted staffing levels for the Project, which ranges up to 1083 people on site. evaporation The range in potential rainfall and runoff characteristics were determined based on 33 years of matched daily rainfall and evaporation data from Scone BoM station (refer to Section 3.2.1) Rainfall and Evaporation Daily rainfall data is available from sixty-one Bureau of Meteorology (BoM) Stations within a 50 kilometre radius of UCML. However, the data available from most of these stations is only for short periods of time or is incomplete. In addition, UCML measure daily rainfall data at two locations on site the Open Cut Office and Rowans Dam (refer to Figure 1.5). For rainfall/runoff and water balance modelling purposes it is considered important to use matched daily rainfall and evaporation records. The closest BoM rainfall station is Ulan Post Office (BoM Station ) located 1.5 kilometres to the west of UCML with daily rainfall recorded from 1906 to date. Of the sixty-one BoM Stations within a 50 kilometre radius of UCML, only one station (Station Kerrabee) records daily pan evaporation. However evaporation data is only available for a ten year period from 1968 to No evaporation data is recorded on site. In the wider region there are three BoM Stations that record daily pan evaporation. The locations of these stations vary from 76 kilometres to the south-west of UCML (Mumbil) to 116 kilometres to the east-south-east of UCML (Jerrys Plains). The periods of record for each of the relevant rainfall and evaporation sites are listed below in Table /R06/AA October
65 Complex Water Balance Predicted Water Balance Table Meteorology Sites Station Number* Site Distance from UCML Direction from UCML Rainfall Period Record Evaporation Period Record Jerrys Plains 116 ESE 1886-date Scone 105 ENE 1950-date *** Mumbil (Burrendong Dam) 76 SW 1951-date date Ulan Post Office 2 SW 1906-date - RDrain Rowans Dam ** ** 2004-date - Open Cut Office ** ** 2006-date - * Telemetry Code is given for UCML data, otherwise BoM Station Number. ** Located at UCML. *** Numerous unrecorded days from 1995 onwards An analysis of rainfall data for the rainfall stations listed in Table 3.2 for the period from 1952 to 2005 is shown in Table 3.2 below. During this period all these stations have good quality rainfall records. Table Comparison of Annual Rainfall BOM Station Ulan Post Office (Station ) Scone (Station ) Jerrys Plains (Station ) Mumbil (Burrendong Dam) (Station ) 10 th Percentile Average Year th Percentile The average annual rainfall for all four stations shown in Table 3.2 is consistent for the period 1952 to In order to model the water balance for the project, evaporation data representative of that experienced on site is required for the rainfall period used. Evaporation is not measured on site. Annual pan evaporation recorded at Scone (Station 61089) ranges from 1329 mm per year to 2093 mm per year for the period of record (1973 to 2009). Analysis of the historical record shows an expected trend of evaporation increasing during the summer months and decreasing during the winter months. Average daily Scone evaporation data for each month of the year is shown in Table 3.3. An analysis of historical data indicates that average daily evaporation typically exceeds average daily rainfall through all months of the year. 2423/R06/AA October
66 Complex Water Balance Predicted Water Balance Table Average Daily Pan Evaporation Month Average Daily Pan Evaporation (mm/day) January 6.3 February 5.0 March 3.6 April 2.5 May 1.9 June 2.0 July 2.9 August 4.3 September 5.7 October 6.9 November 7.4 December 7.2 Evaporation data from Scone (Station 61089) is considered to adequately represent the evaporation rates experienced at UCML, as evaporation tends to be regionally driven. 3.3 Predictive Water Balance Model Outputs The predicted water balance for the Project is summarised in Graphs 3.1 to 3.3. Graphs 3.1 to 3.3 show the 10 th percentile, 50 th percentile and 90 th percentile predicted water balance, water inputs and water outputs. The predictive water balance model outputs for selected years of the predicted water balance for the Ulan complex are also shown on Figures 3.1 to 3.5. The predicted water balance for each of the selected years are summarised in Table 3.4. Table 3.4 Summary of Predicted Water Balance (50 th Percentile) Stage Water Inputs (ML/year) Water Outputs (ML/year) Water Balance* (ML/year) Water Balance* (ML/day) Year 1 (2010) 6,995-2,835 4, Year 6 (2015) 10,855-4,205 6, Year 8 (2017) 11,070-3,860 7, Year 13 (2022) 7,140-2,860 4, Year 20 (2029) 4,550-1,550 3, * Gross water balance (not including discharges) The maximum water surplus for the Project is predicted to occur during Year 8 with a maximum modelled water surplus of approximately 7,210 ML per year (i.e ML per day). The outputs from the predictive water balance model are shown on Figures 3.1 to /R06/AA October
67 Complex Water Balance Predicted Water Balance Graph Predicted Complex Water Balance (no discharges) Volume (ML/year) Year Prediction - 10th %ile Prediction - 50th %ile Prediction - 90th %ile Graph Predicted Complex Inputs (no discharges) Volume (ML/year) Year Prediction - 10th %ile Prediction - 50th %ile Prediction - 90th %ile 2423/R06/AA October
68 Complex Water Balance Predicted Water Balance Graph Predicted Complex Outputs (no discharges) Volume (ML/year) Year Prediction - 10th %ile Prediction - 50th %ile Prediction - 90 %ile 2423/R06/AA October
69 Complex Water Balance Predicted Water Balance Figure Ulan Complex Predictive Water Balance - Graphical Summary - Year 1 (2010) A1 Rowans Dam/ NW Sed Dam 275 Balance = 0 A2 East Pit 458 Balance = 0 to the Mine Water System -99 to the Mine Water System -180 Evaporation -176 Evaporation -278 A3 Duck Pond Evaporation 30 Balance = from Mine A4 Bobadeen Dam Evaporation Balance = 0 Irrigation Estimate of Brine from Mine RO PLANT Evaporation A5/6 Mixing Dam -6 Balance = 0 Discharge to Ulan Creek Estimate of Brine Rowans Dam from Mine 0 Discharge to RO PLANT Ulan Creek 0 Balance = 0 0 Estimate of Brine Ulan West from Mine 0 Discharge to Mona RO PLANT Creek 0 Balance = 0 0 Excess from Dams to Moolarben Water from to Bobadeen Underground Surface facility 6980 Mine dust suppression Brine from RD -515 to RD & UW RO &UW West RO Balance = ML 0 0 Recovery from to CHPP and Tailings/Rejects Crusher Potable water Underground dust recovery suppression A11 West Pit Loss from evap or to g/w 562 Balance = Brine from to the Mine Water A7 Underground Boobadeen RO System Seepage from groundwater Balance = Vent fan humidity -55 from Mine 2% Moisture 97 Crushed Coal Moisture with in Raw Coal 4.84 Mt Crushed Coal crushed coal 97 Dust suppression Balance = from mine water 290 CHPP Area 367 Lagoons and Dams Evaporation from Mine Balance = Drainage to Mine Moisture bound 2% Moisture A8 CHPP Mt Rejects with rejects -69 in Raw Coal 5.69 Mt ROM 4 Mt Clean Coal Moisture with 114 Dust suppression Balance = 0 clean coal from mine water Drainage to Mine A10/9 Tailing -455 Evaporation -90 Balance = Mt Tailings Bound with tailings Groundwater A12 Potable Water 213 Onsite potable bore PB1C water use 71.0 Balance = A14 Ulan West Seepage from groundwater Underground 0 Balance = 0 to the Mine Water System 55 Vent fan humidity -55 Total Inputs Gross Water Balance Total Outputs 6995 ML 4160 ML ML 19.2 ML/day 11.4 ML/day -7.8 ML/day 2423/R06/AA October
70 Complex Water Balance Predicted Water Balance Figure Ulan Complex Predictive Water Balance - Graphical Summary - Year 6 (2015) A1 Rowans Dam/ NW Sed Dam 238 Balance = 0 A2 East Pit 542 Balance = 0 to the Mine Water System -62 to the Mine Water System -264 Evaporation -176 Evaporation -278 A3 Duck Pond Evaporation 30 Balance = from Mine A4 Bobadeen Dam Evaporation Balance = 0 Irrigation Estimate of Brine from Mine RO PLANT Evaporation A5/6 Mixing Dam -6 Balance = 0 Discharge to Ulan Creek Estimate of Brine Rowans Dam from Mine 0 Discharge to RO PLANT Ulan Creek 0 Balance = 0 0 Estimate of Brine Ulan West from Mine 0 Discharge to Mona RO PLANT Creek 0 Balance = 0 0 Excess from Dams to Moolarben Water from to Bobadeen Underground Surface facility Mine dust suppression Brine from RD -822 to RD & UW RO &UW West RO Balance = 132 ML 0 0 Recovery from to CHPP and Tailings/Rejects Crusher Potable water Underground dust recovery suppression A11 West Pit Loss from evap or to g/w 916 Balance = Brine from to the Mine Water A7 Underground Boobadeen RO System Seepage from groundwater Balance = Vent fan humidity -55 from Mine 2% Moisture 168 Crushed Coal Moisture with in Raw Coal 8.38 Mt Crushed Coal crushed coal 168 Dust suppression Balance = from mine water 502 CHPP Area 367 Lagoons and Dams Evaporation from Mine Balance = Drainage to Mine Moisture bound 2% Moisture A8 CHPP Mt Rejects with rejects -117 in Raw Coal Mt ROM 7.69 Mt Clean Coal Moisture with 212 Dust suppression Balance = -1 clean coal from mine water Drainage to Mine A10/9 Tailing -858 Evaporation -149 Balance = Mt Tailings Bound with tailings Groundwater A12 Potable Water 213 Onsite potable bore PB1C water use 80.0 Balance = A14 Ulan West Seepage from groundwater Underground 2374 Balance = 0 to the Mine Water System Vent fan humidity -55 Total Inputs Gross Water Balance Total Outputs ML 6650 ML ML 29.7 ML/day 18.2 ML/day ML/day 2423/R06/AA October
71 Complex Water Balance Predicted Water Balance Figure Ulan Complex Predictive Water Balance - Graphical Summary - Year 8 (2017) A1 Rowans Dam/ NW Sed Dam 238 Balance = 0 A2 East Pit 537 Balance = 0 to the Mine Water System -62 to the Mine Water System -259 Evaporation -176 Evaporation -278 A3 Duck Pond Evaporation 30 Balance = from Mine A4 Bobadeen Dam Evaporation Balance = 0 Irrigation Estimate of Brine from Mine RO PLANT Evaporation A5/6 Mixing Dam -6 Balance = 0 Discharge to Ulan Creek Estimate of Brine Rowans Dam from Mine 0 Discharge to RO PLANT Ulan Creek 0 Balance = 0 0 Estimate of Brine Ulan West from Mine Discharge to Mona RO PLANT Creek 3285 Balance = Excess from Dams to Moolarben Water from to Bobadeen Underground Surface facility Mine dust suppression Brine from RD -876 to RD & UW RO &UW West RO Balance = -676 ML Recovery from to CHPP and Tailings/Rejects Crusher Potable water Underground dust recovery suppression A11 West Pit Loss from evap or to g/w 849 Balance = Brine from to the Mine Water A7 Underground Boobadeen RO System Seepage from groundwater Balance = Vent fan humidity -55 from Mine 2% Moisture 150 Crushed Coal Moisture with in Raw Coal 7.48 Mt Crushed Coal crushed coal 150 Dust suppression Balance = from mine water 448 CHPP Area 367 Lagoons and Dams Evaporation from Mine Balance = Drainage to Mine Moisture bound 2% Moisture A8 CHPP Mt Rejects with rejects -62 in Raw Coal 7.18 Mt ROM 5.53 Mt Clean Coal Moisture with 144 Dust suppression Balance = 1 clean coal from mine water Drainage to Mine A10/9 Tailing -548 Evaporation -219 Balance = Mt Tailings Bound with tailings Groundwater A12 Potable Water 213 Onsite potable bore PB1C water use 80.0 Balance = A14 Ulan West Seepage from groundwater Underground 2695 Balance = 0 to the Mine Water System Vent fan humidity -55 Total Inputs Gross Water Balance Total Outputs ML 7211 ML ML 30.3 ML/day 19.8 ML/day ML/day 2423/R06/AA October
72 Complex Water Balance Predicted Water Balance Figure Ulan Complex Predictive Water Balance - Graphical Summary - Year 13 (2022) A1 Rowans Dam/ NW Sed Dam 238 Balance = 0 A2 East Pit 510 Balance = 0 to the Mine Water System -62 to the Mine Water System -232 Evaporation -176 Evaporation -278 A3 Duck Pond Evaporation 30 Balance = from Mine A4 Bobadeen Dam Evaporation Balance = 0 Irrigation Estimate of Brine from Mine RO PLANT Evaporation A5/6 Mixing Dam -6 Balance = 0 Discharge to Ulan Creek Estimate of Brine Rowans Dam from Mine 0 Discharge to RO PLANT Ulan Creek 0 Balance = 0 0 Estimate of Brine Ulan West from Mine -822 Discharge to Mona RO PLANT Creek 2465 Balance = Excess from Dams to Moolarben Water from to Bobadeen Underground Surface facility 6277 Mine dust suppression Brine from RD -876 to RD & UW RO &UW West RO Balance = ML Recovery from to CHPP and Tailings/Rejects Crusher Potable water Underground dust recovery suppression A11 West Pit Loss from evap or to g/w 339 Balance = Brine from to the Mine Water A7 Underground Boobadeen RO System Seepage from groundwater Balance = Vent fan humidity -55 from Mine 2% Moisture 67 Crushed Coal Moisture with in Raw Coal 3.32 Mt Crushed Coal crushed coal 66 Dust suppression Balance = from mine water 199 CHPP Area 367 Lagoons and Dams Evaporation from Mine Balance = Drainage to Mine Moisture bound 2% Moisture A8 CHPP Mt Rejects with rejects -31 in Raw Coal 3.54 Mt ROM 2.73 Mt Clean Coal Moisture with 71 Dust suppression Balance = -1 clean coal from mine water Drainage to Mine A10/9 Tailing -222 Evaporation -184 Balance = Mt Tailings Bound with tailings Groundwater A12 Potable Water 213 Onsite potable bore PB1C water use 52.0 Balance = A14 Ulan West Seepage from groundwater Underground 2224 Balance = 0 to the Mine Water System Vent fan humidity -55 Total Inputs Gross Water Balance Total Outputs 7143 ML 4281 ML ML 19.6 ML/day 11.7 ML/day -7.8 ML/day 2423/R06/AA October
73 Complex Water Balance Predicted Water Balance Figure Ulan Complex Predictive Water Balance - Graphical Summary - Year 20 (2029) A1 Rowans Dam/ NW Sed Dam 238 Balance = 0 A2 East Pit 510 Balance = 0 to the Mine Water System -62 to the Mine Water System -232 Evaporation -176 Evaporation -278 A3 Duck Pond Evaporation 30 Balance = from Mine A4 Bobadeen Dam Evaporation Balance = 0 Irrigation Estimate of Brine from Mine RO PLANT Evaporation A5/6 Mixing Dam -6 Balance = 0 Discharge to Ulan Creek -274 Estimate of Brine Rowans Dam from Mine 0 Discharge to RO PLANT Ulan Creek 0 Balance = 0 0 Estimate of Brine Ulan West from Mine -274 Discharge to Mona RO PLANT Creek 822 Balance = Excess from Dams to Moolarben Water from to Bobadeen Underground Surface facility 3191 Mine dust suppression Brine from RD -302 to RD & UW RO &UW West RO Balance = 62 ML Recovery from to CHPP and Tailings/Rejects Crusher 5 76 Potable water Underground dust recovery suppression A11 West Pit Loss from evap or to g/w 203 Balance = Brine from to the Mine Water A7 Underground Boobadeen RO System Seepage from groundwater Balance = Vent fan humidity -55 from Mine 2% Moisture 6 Crushed Coal Moisture with in Raw Coal 0.28 Mt Crushed Coal crushed coal 6 Dust suppression Balance = 0-28 from mine water 16 CHPP Area 367 Lagoons and Dams Evaporation from Mine Balance = Drainage to Mine Moisture bound 2% Moisture A8 CHPP Mt Rejects with rejects -5 in Raw Coal 0.49 Mt ROM 0.38 Mt Clean Coal Moisture with 10 Dust suppression Balance = 0 clean coal from mine water Drainage to Mine A10/9 Tailing 0 Evaporation -132 Balance = Mt Tailings Bound with tailings Groundwater A12 Potable Water 213 Onsite potable bore PB1C water use 34.0 Balance = A14 Ulan West Seepage from groundwater Underground 1252 Balance = 0 to the Mine Water System Vent fan humidity -55 Total Inputs Gross Water Balance Total Outputs 4548 ML 3001 ML ML 12.5 ML/day 8.2 ML/day -4.2 ML/day 2423/R06/AA October
74 Complex Water Balance Water Management Strategy 4.0 Water Management Strategy The predicted water surplus for the Project (refer to Section 3.0) needs to be managed both with consideration of the available on-site water storage (refer to Section 4.1) and the available discharge facilities (refer to Section 4.2). Historical operations at UCML have indicated that the need to maintain off-site discharge capacity is required. Significant work has been undertaken in recent years to develop a sophisticated water balance model (refer to Sections 2.0 and 3.0) to enable accurate predictions of the complex water balance. The proposed water management strategy for the Project is discussed in Section On-Site Water Storages At the time of the 2007/2008 water balance there was approximately 5370 ML of water storage capacity at the Ulan complex. This storage includes dams, old open cut mining voids (i.e. East Pit) and underground mining voids (e.g. Ulan No. 3 underground). As part of the Project two new tailings dams are proposed to be built within the East Pit. As such the available water storage volume within East Pit will decrease by approximately 3230 ML by 2015, to allow these dams to be constructed. As such the total available water storage capacity at the Ulan complex will reduce to approximately 2140 ML from Following the cessation of mining in Ulan No. 3 underground additional water storage of approximately 1100 ML will become available within the goafs of the underground mine. As such the total water storage capacity at the Ulan complex will increase to approximately 3240 ML from Off-Site Discharge and Water Sharing Infrastructure The proposed discharge locations for the Project are listed below. Existing Bobadeen Irrigation Scheme available for the Project. Proposed Moolarben Mine able to discharge up to 2.74 ML per day (i.e ML per year) and is available from the start of 2010 for the Project. Existing Bobadeen Water Treatment Facility (Ulan Creek) pre-filtration equipment installed at start of 2009 able to discharge up to 15 ML per day from the start of 2009 and for the Project. Approved Rowans Dam Water Treatment Facility (Ulan Creek) able to discharge up to 10 ML per day and is available from 2010 for the Project. Proposed Ulan West Water Treatment Facility (Talbragar River) able to discharge up to 17.5 ML per day and is available from the start of 2014 for the Project. The licensing requirements for these structures and potential impacts associated with the proposed discharges are discussed in Section 5.0 of the Report. 2423/R06/AA October
75 Complex Water Balance Water Management Strategy 4.3 Future Water Management Strategy For the Project UCML propose to maintain a neutral site water balance by utilising all of the existing and proposed discharge facilities (refer to Section 4.2). UCML propose to vary their discharge regimes by varying the water flow rates between the various discharge structures (when constructed) based on environmental and water requirements of the Project. As such the proposed discharge infrastructure will provide flexibility and significant redundancy within the water management system The highest predicted water discharge, including managing the predicted water surplus and decreasing the complex water inventory, is in the order of 21.2 ML per day during Year 8. This predicted water discharge volume (i.e ML per day) also corresponds to the year with the highest predicted complex water surplus of 19.8 ML per day (refer to Table 3.1). The proposed discharge strategy is capable of a maximum discharge of 52 ML per day and as such allows for flexibility in the discharge strategy to cater for the predicted water surplus and managing the requirements of changing water storage capacities for the Project. 4.4 Example Discharge Strategy Based on the predicted water balance for the Ulan complex an example discharge strategy has been developed to demonstrate how UCML might dispose of the predicted net water surplus, including water disposal associated with changes in on-site storage volumes. The results of the simulation are shown on Graph 4.1 and are based on the discharge strategy outlined in Table 4.1. Year Bobadeen Irrigation (ML/day) Table 4.1 Example Discharge Strategy Rates Bobadeen RO (Ulan Creek) (ML/day) Rowans RO (Ulan Creek) (ML/day) Ulan West RO (ML/day) Off Site to Moolarben (ML/day) Total Discharge (ML/day) Total Discharge (ML/year) /R06/AA October
76 Complex Water Balance Water Management Strategy Graph Performance with Example Discharge Strategy Volume (ML) Year Total Available Storage (ML) Proposed Discharge (ML) 50th %ile On-Site Volume (ML) 90th %ile On-Site Volume (ML) 10th %ile On-Site Volume (ML) 2423/R06/AA October
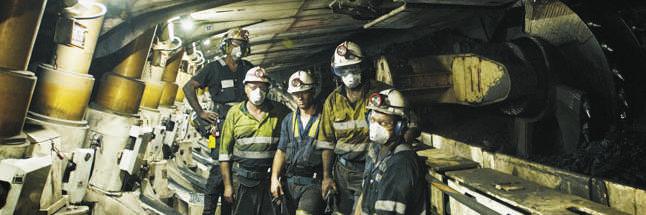


77