Better Understanding the Impact of Onsite Sewage System on Quality of Florida Groundwater and Springs
|
|
|
- Hannah Briggs
- 5 years ago
- Views:
Transcription
1 Better Understanding the Impact of Onsite Sewage System on Quality of Florida Groundwater and Springs Xueqing Gao, PhD Eberhard Roeder, PhD, PE, CPM Bureau of Environmental Health Division of Disease Control and Health Protection Florida Department of Health November 3,
2 2
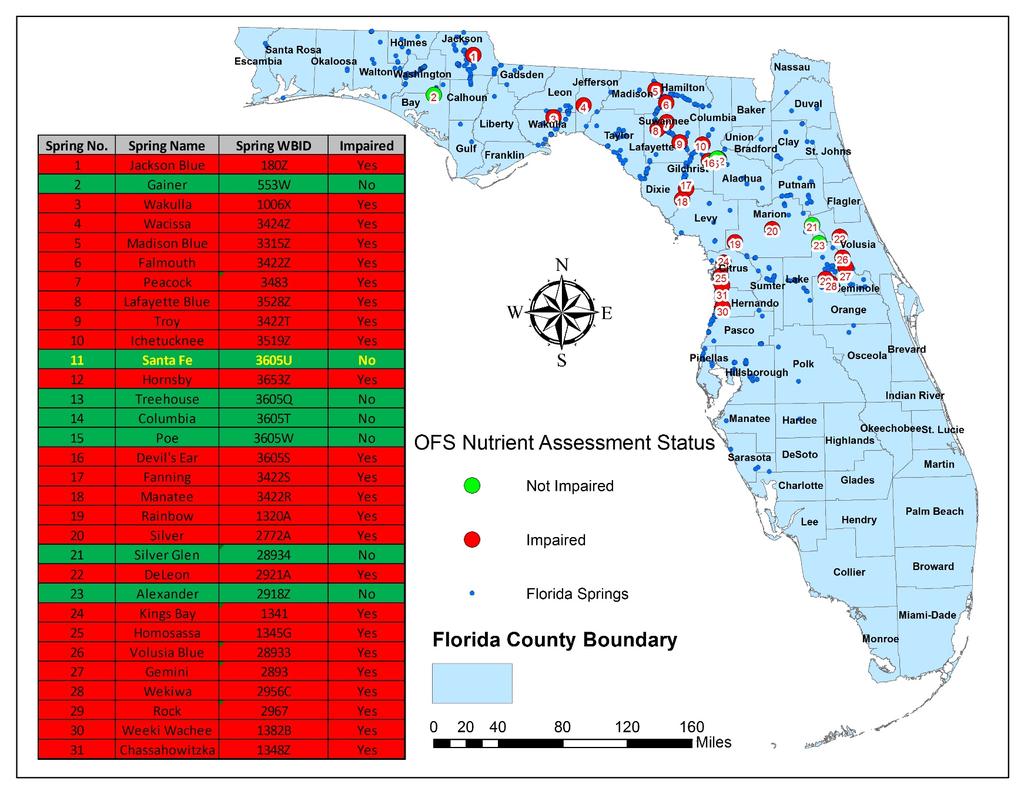
3 Statutory Mandate Protection of Water Quality in Outstanding Florida Springs (OFSs) (Florida Statute Section ) Identify all OFSs impaired for nutrients by July 1 of 2018 Adopt basin management action plan (BMAP) within two years of the adoption of the total maximum daily load (TMDL) (the latest July 1, 2018) Target achieving TMDL goals in 20 years Develop Onsite Sewage Treatment and Disposal System (OSTDS) remediation plans for basin where OSTDSs contribute more than 20% of nonpoint source loads or if FDEP considers an OSTDS plan is needed 3
4 4
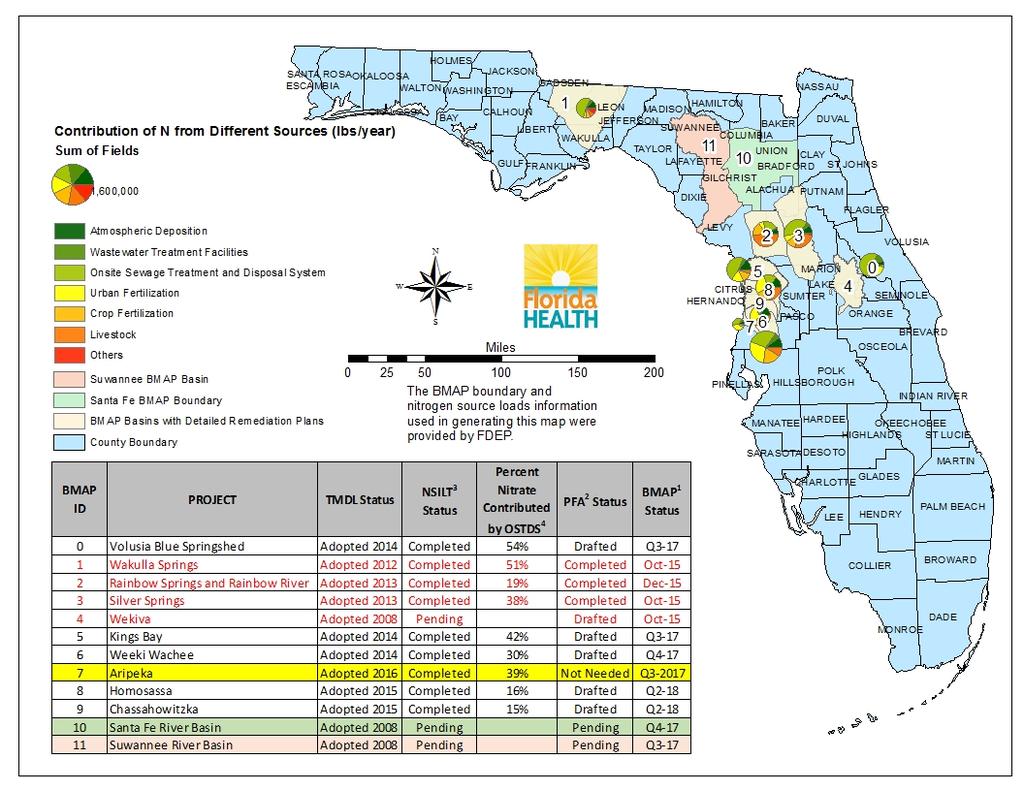
5 Establish Load Reduction Benchmarks PROJECT Total Nitrate Percent Loads to Nitrate Groundwater Contributed by (lb-n/yr.) OSTDS Volusia Blue Springshed 514,095 54% Wakulla Springs 341,848 30% Rainbow Springs and Rainbow 602,405 19% River Silver Springs 752,979 38% Wekiva Kings Bay 592,440 42% Weeki Wachee 940,143 30% Aripeka 137,929 39% Nitrogen Source Inventory Loading Tool (NSILT) a) Major sources included: i. Atmospheric deposition ii. OSTDS iii. Wastewater Treatment Plants iv. Urban turf grass and golf course fertilization v. Agricultural fertilization vi. Livestock b) Attenuation: soil attenuation rate and recharge factors Homosassa 582,076 16% Chassahowitzka 380,462 15% 5


6 NSILT Nitrogen Load, Spring Vent Nitrogen Load, And TMDL NSILT Load Spring Vent Load TMDL Kings Bay Springs Silver Springs Volusia Blue Springs Weeki Wachee To protect, Springs promote and improve the health of all people in Florida through integrated state, county, and community efforts. Homosassa Springs Rainbow Springs 6

7 Percent Reduction Needed to Achieve TMDL? Estimate by comparing spring vent load with spring vent TMDL? Estimate by comparing NSILT loads with spring vent TMDL? Estimate by comparing spring vent load with spring vent TMDL and apply percentage to NSILT loads? NSILT Load Spring Vent Load TMDL NSILT Nitrogen Source Inventory Loading Tool 7


8 Volusia Blue BMAP Area, PFA, and Percent Contributions from All Sources Total Load Reduction Needed: 48,743 lbs-n/year Total Project Credits: 47,745 lbs-n/year Remaining Needed Load Reduction: 997 lbs-n/year 8
9 Gap in Understanding the Relationship between NSILT Load and Spring Vent Load ii CCCCCCCCCCCCCCCCCCCCCC SSSSSSSSSSSS LLLLLLLLLL 0 Load to Land Surface Soil Attenuation Load after Going through Soil Recharge Factor Load Reach Floridan Aquifer No Further Attenuation Load Reaching Spring Vent Accuracy of Estimating total loads to the springshed land? Setting soil attenuation rate? Setting recharge factor? Understanding nitrogen transport in groundwater? 9
10 Springshed Delineations 1. Different methods may produce different delineations Potentiometric surface delineation Groundwater flow modeling 1000-year capture area. 2. Other factors also influence the delineation Availability and location of monitoring wells Hydrology of the year Years and the number of years being included 3. Final BMAP boundary may not completely match the springshed boundary 10


11 Springshed and BMAP Boundary Delineation for Silver Spring (FDEP 2013) 11
12 Estimating Nitrogen Loads from OSTDS (Method by The Florida Department of Environmental Protection-FDEP) Where, L: the total nitrogen load reaching the Upper Floridan Aquifer N: number of OSTDSs in the springshed P: number of people per household I: per capita nitrogen load D: soil attenuation rate L = N * P * l * (1-D) * R R: Floridan Aquifer recharge factor 12

13 Number of OSTDS in Spring Basins Inventory Website 13
14 Distribution of OSTDS Count Categories Row Labels Kings Bay/Crystal River Silver Spring Volusia Blue Spring Counts Percent Counts Percent Counts Percent KnownSeptic 13, % 54, % 15, % LikelySeptic 15, % 17, % 27, % SWLSeptic 4 0.0% 2, % % UNDT % % 6 0.0% UNK % 2, % 4, % Total 29, % 77, % 47, % Row Labels Weeki Wachee Springs Homosassa Springs Rainbow Spring Counts Percent Counts Percent Counts Percent KnownSeptic 12, % 4, % 26, % LikelySeptic 21, % 8, % 9, % SWLSeptic % 5 0.0% % UNDT % 2, % % UNK 1, % % 6, % Total 35, % 16, % 43, % 14
15 Occupied and Vacant Housing Units in Spring Counties Occupancy Citrus County Counts Hernando County Pasco County Percent Counts Percent Counts Percent Total housing units 78, , , Occupied housing units 63, , , Vacant housing units 14, , , Occupancy Volusia County Marion County Alachua County Counts Percent Counts Percent Counts Percent Total housing units 254, , , Occupied housing units 208, , , Vacant housing units 45, , ,
16 Number of People Per Household FDEP Approach: 1. County-wide average of people per household: County population/occupied housing units 2. The people per household adjusted by hours at work and school, which is 43.5 hours or 26% of a week 3. Depending on percent county population in the school and working group, reduces effective number per household by 13% 4. Reduces amount of nitrogen being produced for each OSTDS unit by about 13%, which may cause underestimation 16
17 Per Capita Loads of Nitrogen Based on Published Literatures (FDEP Used lbs/yr./person) Study Grouping TN (mg/l) Flow (gpd) Persons Input/ capita (lb/yr) Data source Florida Studies Anderson, 1998 (pre-wekiva) Wekiva Studies Water Environmental Research Foundation Study Wakulla Sites (means) Nielsen et al. 2002, McAvoy et al Seminole Site, Lake Site, Orange Site, F1 Lowe et al F2 Lowe et al F3 Lowe et al F4 Lowe et al F5 Lowe et al F6 Lowe et al LT site, Katz et al HK site, Katz et al YG site, Katz et al 2010 Average Wakulla (medians) 17
18 Soil Nitrogen Attenuation Rate Typical Literature Values 10%-50% FDOH and FDEP recent Wekiva Basin studies: 40% Used by FDEP for NSILT analyses: 50% Estimates are based on the highest concentrations underneath a drainfield Measurements usually for at least 24 inches of water table separation Plume attenuation part of soil attenuation or part of groundwater attenuation 18
19 Soil Nitrogen Attenuation Rate County Percent OSTDS at 24 inches Water Table Separation >= 24 inches < 24" inches Alachua 85% 15% Hernando 91% 9% Marion 93% 7% Pasco 75% 25% Volusia 68% 32% 19
20 Groundwater Recharge Factor Additional nitrogen attenuation factors related to recharge rates were assigned as follows: 10 % in high recharge rate areas ( 10 in/yr) 50 % in medium recharge rate areas (3 to 10 in/yr) 90% in low recharge rate area (0 to 3 in/yr) Interpreted as diversion of water as it travels to the Upper Floridan Aquifer or as reactive losses along the travel path. Plume-scale attenuation included. 20
21 No Further Attenuation Once Nitrate Enters Upper Floridan Aquifer Heffernan et al (2012) estimate an average of 32% denitrification in the Upper Floridan Aquifer Varies between springs Historic variations in loading, are we seeing older, higher loading (net reduction from converting from ag to houses) 21
22 Summary 1. N: Number of OSTDS in a basin can be refined, but likely will not reduce the OSTDS loads significantly. 2. P: Number of people per household can be refined, but will not reduce the OSTDS loads. 3. I: Per capita loads estimated as the average of case studies; the statistical distribution of the loading values may be better due to large variation of hydraulic loads and nitrogen concentrations 4. D: Soil attenuation rate may be refined through distribution of water table separation based on permit data. 5. R: Recharging factor a sensitive parameter. 6. Transport of nitrogen once reaching the groundwater is a big unknown. 22
23 Contact Information Eberhard Roeder, PhD, PE Xueqing Gao, PhD (850) (850) Florida Department of Health Division of Disease Control and Health Protection Bureau of Environmental Health 23