Where Do We Get Our Water? 2015 Environmental and Occupational Health Technical Symposium
|
|
|
- Walter Daniels
- 5 years ago
- Views:
Transcription
1 Where Do We Get Our Water? The Role of Governance in Shaping Water Policy Drinking Water Policy in California 2015 Environmental and Occupational Health Technical Symposium
2 Whiskey is for drinking and Water is for fighting. Unknown
3 Water Is water free? How much is water? Where does it come from? Is it unlimited renewable?


4 CommodityCosts Costs per Gallon $8.00 $7.00 $6.00 $5.00 $4.00 $3.00 $2.00 $1.00 $0.00 LADWP Costco 7 Eleven Gas Milk

5


6 Life With and Without Water


7 Key Points Regarding g Water Supply ppy


8 Earth s Water 97.5% Sea Water 2.5% Fresh Water 30% Groundwater 1% Surface Water 69% Frozen Water
9


10 California s Primary Water Surface Water Supply Sources Groundwater Other*


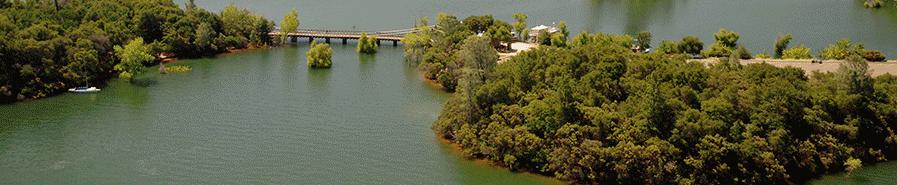

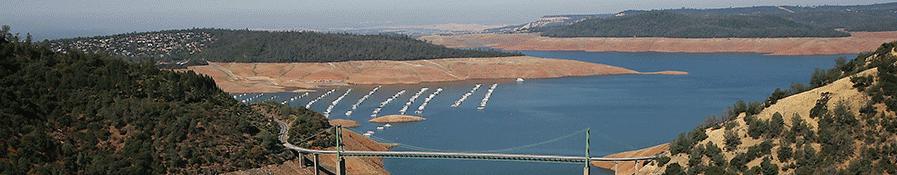
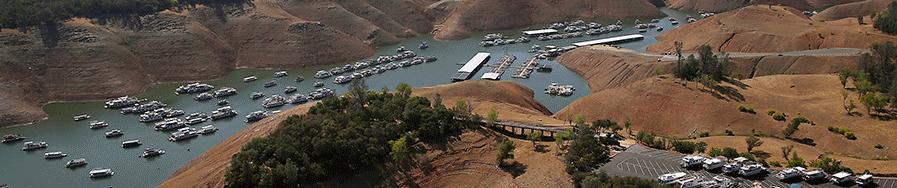
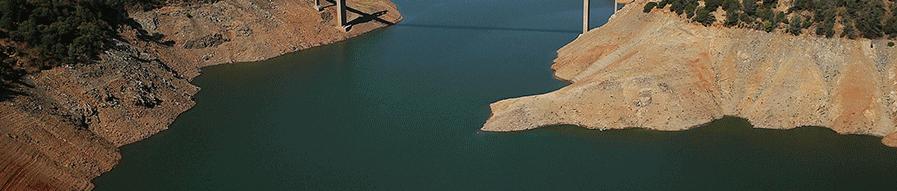
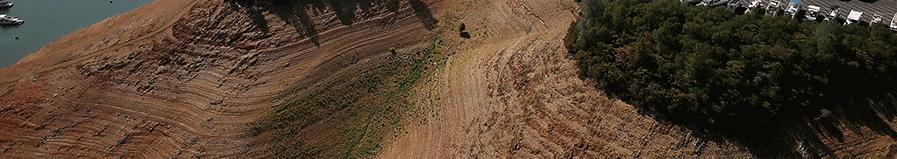

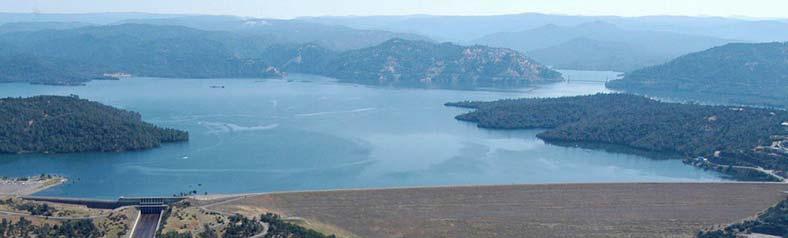
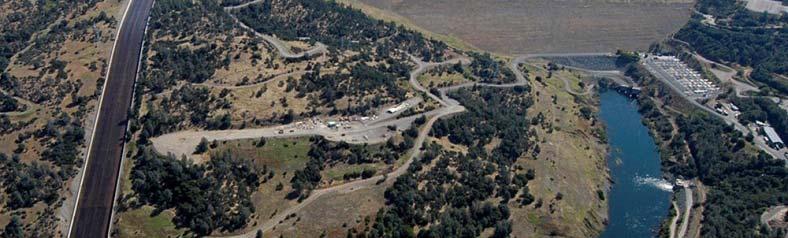
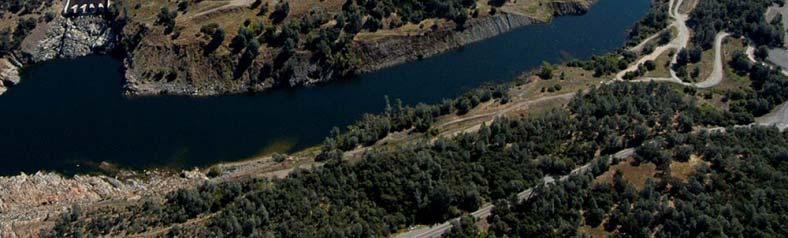
11 Lake Oroville 2011 vs. 2014
12 California Water Supply Statistics Surface Water 70% Normal/Wet Years 40% Dry Years Groundwater 30% Normal/Wet Years 60% Dry Years Recycled Water <1%


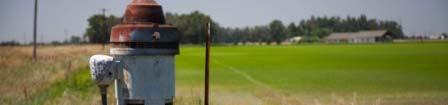
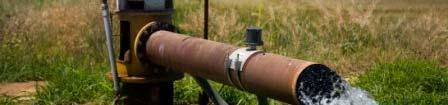
13 California Water Use Statistics Old DWR Method 80% Agriculture 20% Urban New DWR Method 40% Agriculture 10% Urban 50% Environment Somewhere in between?
14 Six Main California Surface Water Supplies Central Valley Project Colorado River Aqueduct Hetch Hetchy Aqueduct Los Angeles Aqueduct Mokelumne Aqueduct State Water Project


15 Central Valley Project Begins with Shasta Lake serving water to the Central Valley Operated by the U.S. Bureau of Reclamation


16 Hetch Hetchy & Mokelumne Aqueducts Hetch Hetchy Aqueduct Begins in the Yosemite National Park area serving customers in the Bay area Operated by SF Public Utilities Commision Mokelumne Aqueduct Begins in the Sierra Nevada Mountain foothills serving customers in the Bay area Operated by EBMUD


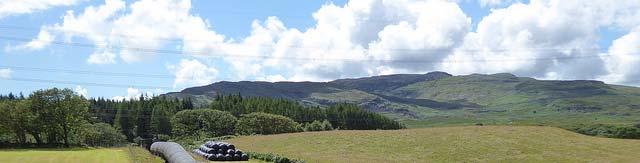
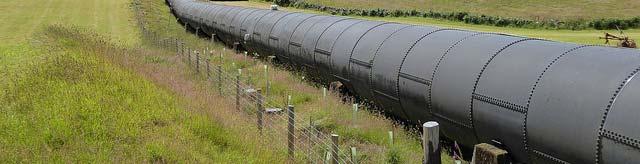
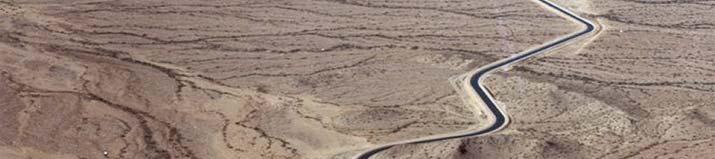
17 State Water Project Operated by CA Department of Water Resources Approximately 600 miles of canals, pipelines, storage structures, t & pumps Provides water to >2/3 of Californians Originates from tributaries feed Oroville Lake and carries water south to the San Diego area 29 Member Agencies

18 Colorado River Aqueduct Operated by MWD Begins at Lake Havasu, providing water to areas of Riverside, Coachella Valley, Los Angeles, and San Diego


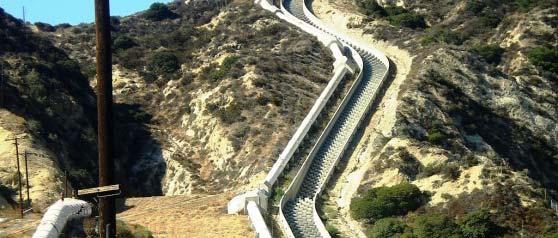
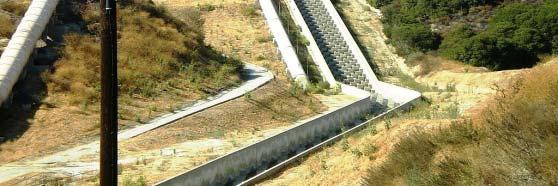
19 Los Angeles Aqueduct Operated by LADWP Brings water from Owen s Valley to residents of L.A. Water flows by gravity for approximately 420 feet Lawsuit in the 80s forced LADWP to return water flows to Mono Lake
20 Local Groundwater Supply Aquifers water-bearing deposits of unconsolidated and semi-consolidated marine and alluvial sediments identified by ygeologic g time Unconfined Aquifers Alluvium coarse-grained unsorted gravel and sand Confined Aquifers Saugus Formation poorly consolidated conglomerates, silts, sand, and clay
21 Unconfined vs. Confined Aquifer


22 Other Sources of Supply Groundwater Banking Water Transfers Recycled Water Groundwater Recharge Desalination


23 Ground Water Banking Recharging a localized aquifer for the purpose of establishing water accounts typically y for long-term insurance purposes.
24 Water Transfers Temporary, long-term term, or permanent transfer of the rights to use water in exchange for compensation. Helps address temporary drought conditions and helps to accommodate longer-term changes in patterns of demand.
25 Recycled Water Supply Tertiary treated wastewater used solely for irrigation. Identified d by purple piping i and/or labeling. In CA ~1/2 million AF is recycled annually
26 Groundwater Recharge Highly treated wastewater used to recharge groundwater aquifers Orange County Groundwater Replenishment System is the worlds largest advanced water purification system for potable reuse
27 Indirect vs. Direct vs. Incidental Indirect Reuse Pumping treated wastewater in to an area for groundwater recharge Direct Reuse Taking highly treated wastewater and sending it into a potable supply system Advisory Committee and Research Underway Incidental Recharge Discharge of treated wastewater into natural Discharge of treated wastewater into natural waterways leading to groundwater recharge


28 OC GW Replenishment System Funded by OC Water District, OC Sanitation District, Federal and State Grants Operational costs paid for by OCWD and MWD Subsidies Total cost for both phases $622.7m. Produces ~100 MGD for ~600,000 residents
29 Desalination Removal of dissolved salts from water Saudi Arabia operates the largest plant in the world Carlsbad Desalination Project will be the largest plant in the U.S. What about the salts?


30 Carlsbad Desalination Project 12 years of planning 6 years of permitting Scheduled d to deliver water to S.D. by MGD 10 mile pipeline
31 What are the costs of each source? Groundwater pumping and disinfection Surface Water aquiring, treatment and pumping Desalination treatment and pumping Groundwater Recharge treatment and pumping
32 Cost of Water State Water Project - $800 - $1000 / AF Groundwater - $100 / AF Groundwater Recharge - $478 - $887 / AF Desalination - $ $2500 / AF


33 Regulatory Framework MCLG CWA
34 Governance Regulations SDWA CWA Water Code Regulatory Agencies USEPA DWR SWRCB DDW RWQCB CPUC Supply Contractors Bureau of Reclamation EBMUD SF PUC LADWP MWD (& member agencies) Local Agencies Water Retailers City Departments County Departments Other Stakeholders Environmental Groups Business Community
35 Integrated Regional Water Management Collaborative effort managing all aspects of water resources in a region Includes multiple agencies, stakeholders, individuals, and groups Attempts t to identify mutually beneficial i solutions IRWM Grant Program


36