Federal Outer Continental Shelf Oil and Gas Overview From the Eastern Gulf of Mexico Perspective
|
|
|
- Laureen Robbins
- 5 years ago
- Views:
Transcription


1 Federal Outer Continental Shelf Oil and Gas Overview From the Eastern Gulf of Mexico Perspective John Rodi Deputy Regional Director U.S. Minerals Management Service (MMS) Gulf of Mexico Region Presented to: Tampa Bay Regional Planning Commission October 12, 2009
2 Presentation Agenda Overall U.S. Energy Situation Current Gulf of Mexico Oil and Gas Activity Potential Future Eastern Gulf of Mexico Oil and Gas Activity

3 NASA Image
4 U.S. Total Energy Production, Consumption, and Net Imports, (quadrillion Btu) 140 History Projections U.S. Consumption Net Imports 29% 80 30% 60 U.S. Production 40 Imports rise 0.8% per year Source: EIA Annual Energy Outlook 2008, Early Release (December 2007)
5 U.S. Primary Energy Consumption (quadrillion Btu) Total U.S. Energy Consumption Other Energy Coal Natural Gas Petroleum Source of Data: EIA, Annual Energy Outlook 2008, early release (December 2007)
6 World Consumption and U.S. Energy Production and Consumption (quadrillion Btu) History Projections World Consumption U.S. Consumption U.S. Production Sources : EIA International Energy Outlook 2007 (May 2007) and EIA Annual Energy Outlook 2008, Early Release (December 2007)
7 Reasonable Conclusions Based on both World and U.S. Energy Consumption Projections Petroleum and natural gas will continue to grow as a source of U.S. energy demand, even with expansion of alternative energy production. World energy consumption and demand for petroleum and natural gas supplies will grow at an even faster pace. Increased worldwide competition for petroleum and natural gas supplies will result in higher costs for U.S. imports in the future. Increased domestic energy production (of all kinds) will help to alleviate effect of higher cost imports as well as provide important economic benefits due to growth in U.S. energy sector investment and jobs. Some believe there are also national security issues associated with continued heavy reliance on imports.

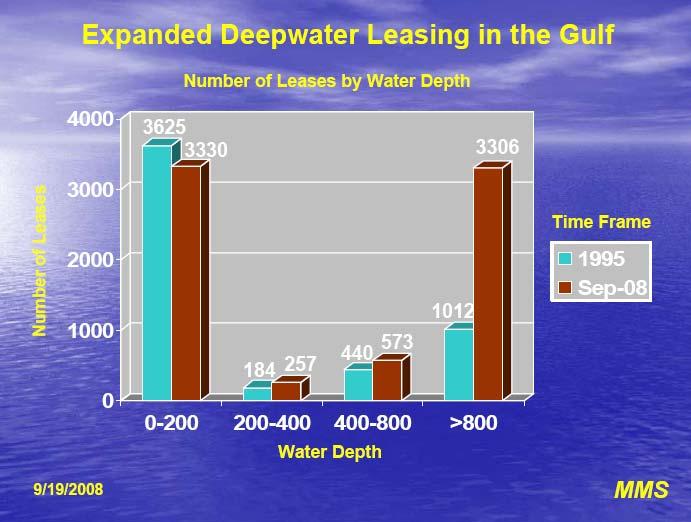
8 Active Leases by Water Depth
9 Gulf of Mexico Statistics by Water Depth As of July 6, 2009 Water Depth in Meters Active Leases Approved Applications to Drill Active Platforms ,674 33,429 3, , and Above 3,367 1,532 23
10

11 The Gulf of Mexico OCS Provides about 25% of U.S. Domestically Produced Oil 72% of the oil produced in the Gulf comes from deepwater. This is equivalent to 19% of the total US production.

12 The Gulf of Mexico OCS Provides about 15% of U.S. Domestically Produced Natural Gas 38% of the gas produced in the Gulf comes from deepwater. This is equivalent to 6% of the total US production.
13

14 Oil Production Forecast

15 Natural Gas Production Forecast


 Natural Gas")
 Alaska OCS Pacific")


16 OCS Hydrocarbon Potential 16 Bbo and 170 Tcf of gas produced since Significant potential remains as reserves (in known fields) or resources r in yet-to to-be discovered fields 12.0 Bbo 20 Tcf 58.8 Bbo Tcf 3.8 Bbo 37.0 Tcf 26.6 Bbo Tcf Resource Category* Oil - Billion Barrels (Bbo) Natural Gas -Trillion Cubic Feet (Tcf) Alaska OCS Pacific OCS Atlantic OCS Gulf of Mexico OCS Total OCS MMS National Assessment, 2006 * Undiscovered Technically Recoverable Resources Reserves and Reserves Appreciation Reserves Oil Gas Oil Resources Gas
17
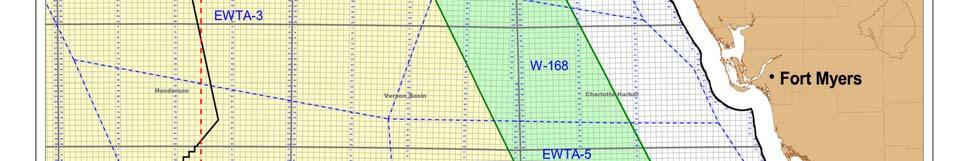
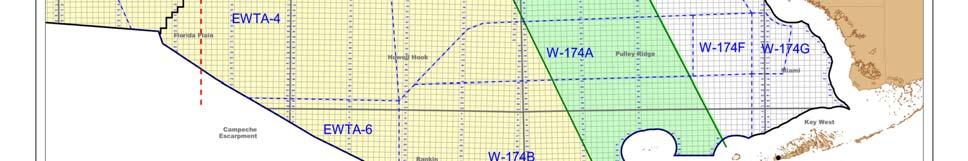
18 Past Eastern Gulf of Mexico Offshore Activity There have been notable leasing, exploration, and discovery activities in the EGOM (based on both prior and current definitions of EGOM area). 14 lease sales to date since leases issued. 65 wells drilled. 20 wells with commercially producible hydrocarbon discovery.

19 EGOM Discovery History To date 20 of the 65 wells drilled have had commercially producible hydrocarbon discovery.
20 Completed Environmental Studies in the EGOM 44 contract environmental studies specifically pertaining to EGOM resources have been completed to date: 18 Coastal and Marine Ecosystem Studies 15 Physical Oceanography Studies 11 Socioeconomic Studies

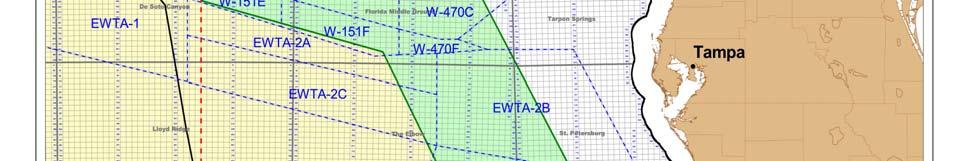
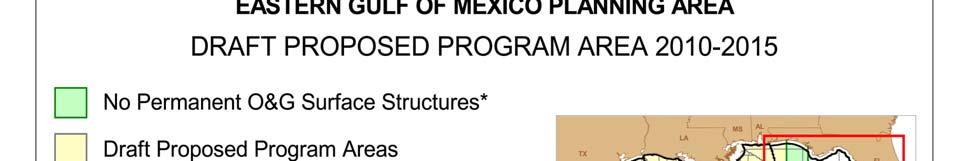
21 Active EGOM Leases
 FL objected to development in 1988 under CZMA Partners filed appeal in 1999 and then a Taking lawsuit against US in 2000")
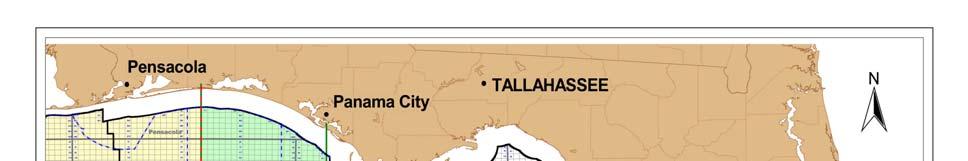
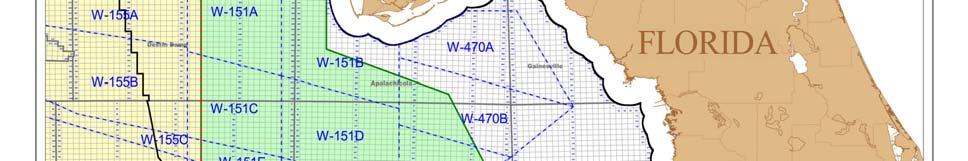
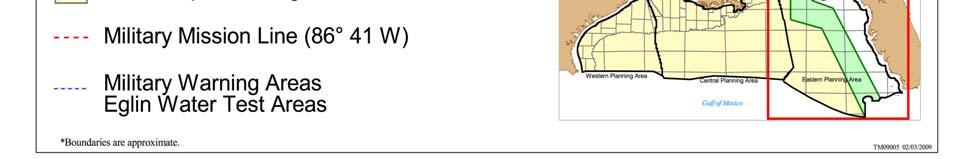
22 Destin Dome Blocks 56 and miles offshore Pensacola, FL West of the Military Mission Line Originally part of 11 block prospect leased in 1984, 1985 and 1988 Original partners were Chevron/Murphy/Conoco Commercial natural gas discovery in 1987 (600 + BCF) FL objected to development in 1988 under CZMA Partners filed appeal in 1999 and then a Taking lawsuit against US in 2000 Legal settlement in 2002 resulted in return of 9 leases to US and suspension of leases on Blocks 56 and 57 until 2012 Murphy is sole owner of remaining 2 leases and hopes to get permission from US and Florida to pursue development before 2012 based on reduced footprint and over the horizon development concept

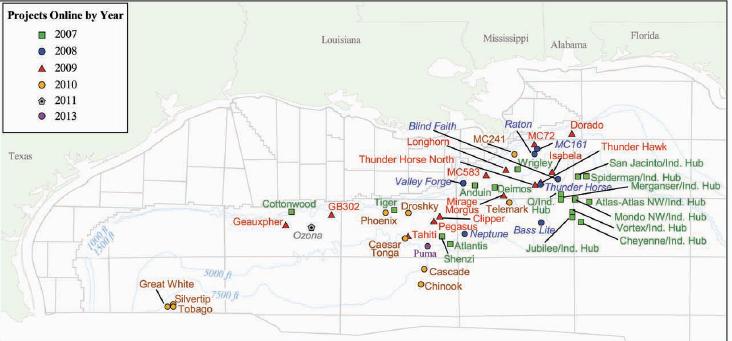
23 Hub Development Concept
")
24 Cascade-Chinook Chinook Floating Production Storage Offloading (FPSO) Facility

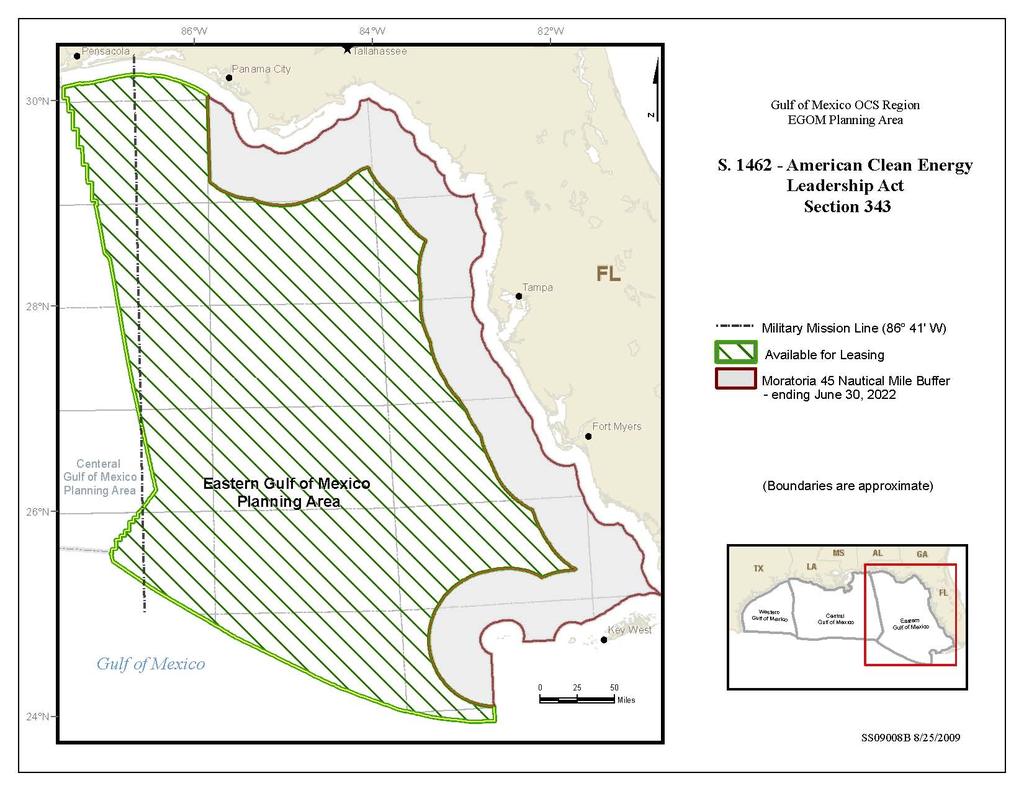
25 Gulf of Mexico Energy Security Act of 2006 (GOMESA)
26
27
28 Gulf of Mexico Pipelines Pipelines are the primary method used to transport liquid and gaseous products between OCS production sites and onshore facilities around the Gulf of Mexico. As of June 2006, there were more than 37,000 km (22,991 mi) of active OCS pipelines. Over the last 10 years, the average annual installation rate for OCS pipelines was 1,600 km (994 mi) and more than 250 pipelines and pipeline segments.
29 Gulf of Mexico Onshore Infrastructure Offshore development is supported by onshore infrastructure consisting of thousands of small and large contractors responsible for virtually every facet of the activity, including supply, maintenance, and crew bases. Contractors are hired by majors and independents alike to service production areas, provide material and manpower support, and to repair and maintain facilities along the coasts. Offshore support industry employs thousands of workers and is responsible for billions of dollars in economic activity in the analysis area. Virtually all of these support industries are found adjacent to ports.
30 Gulf of Mexico Refineries According the U.S. Energy Information Administration, U.S. refineries are currently operating at an 85% operable utilization rate. One-third of operable U.S. petroleum refineries are located in the Gulf States of Alabama, Louisiana, Mississippi, and Texas. In recent years, refining operations were consolidated, the capacity of existing facilities was expanded, and several refineries were closed. About 60% of refinery inputs are imports.
31 Gulf of Mexico Gas Processing Plants More than half of the current natural gas processing plant capacity in the U.S. is located convenient to Gulf of Mexico offshore, in Texas and Louisiana. Over the past 10 years, the number of gas processing plants in the U.S. has decreased from 727 in 1995 to 530 in However, average daily processing capacity has increased by 49 percent. In Alabama, Mississippi and the eastern portion of South Louisiana, new larger plants and expansions built to serve new offshore production increased the average plant capacity significantly. New gas processing plants might be built in Florida if there is an expansion of offshore gas activity in the Eastern Gulf of Mexico.
32 Gulf of Mexico Oil Spills The following is a summary of what is known about trends in U.S. oil spill risk as derived from USCG data from 1973 through 2004: The volume of reported spill incidents in U.S. waters has been on a steady downward trend since 1973 due to positive prevention and preparedness initiatives to protect U.S. coastal waters from oil pollution. The majority of reported spills since 1973 involved discharges between and 2.4 bbl (1 and 100 gallons). Spills by origin: Tank vessels (ships/barges) - 47% of volume spilled. Facilities and other non-vessels - 22% of volume spilled. Pipelines - 17% of volume spilled. Mystery sources - 8% of volume spilled. Non-tank vessels - 6% of volume spilled.
33 Hurricane-related related Gulf of Mexico Oil Spills from There were no accounts of environmental consequences resulting from spills from OCS facilities impacted by major hurricanes from 2002 through 2008: No oiling of marine mammals, birds, or other wildlife. No large volumes of oil on the ocean surface to be collected or cleaned up. No identified environmental impacts from any OCS spills from these hurricanes. There were 231 spills totaling about 25,600 bbl identified as having occurred during or soon after the storms: Of the 231 spills: 206 (89%) were MINOR (less than 238 barrels in size). 25 (11%) were MEDIUM ( 238 to 2,380 barrels in size). Platforms and rigs were the source of 111 (48%) of the spills. Pipelines were the source of 120 (52%) of the spills.
34 Hurricane-related related Gulf of Mexico Oil Spills from All OCS facilities in areas threatened by the storms were shut in prior to the hurricanes so that oil losses were mostly limited to the oil stored on the damaged platforms and rigs or contained in damaged pipeline sections between the check valves. The hydrocarbons lost during the hurricanes were thoroughly dispersed by the hostile sea conditions which eliminated the potential for oiling the shores. MMS has strengthened design and hurricane response criteria since those storms to further minimize the effect of hurricanes in the future on oil spill occurrences.
35 Oil Spill Risk Analysis Oil-Spill Risk Analysis (OSRA) model combines the probability of spill occurrence with a statistical description of hypothetical oil-spill movement on the ocean surface. Probability of Occurrence Probability of spill contacting Oil Spill Risk Analysis
36 Proposed Lease Sale 224 Area
37 Eastern Gulf of Mexico Lease Sale 224 Probabilities of Oil Spills ( 1,000 bbl) Occurring and Contacting State Waters or Beaches within 10 Days
38 After offshore federal leases are issued, there are several mandated opportunities for Federal/State coordination prior to commencement of offshore activity Post Lease Exploration and Development Process Exploration Plan Approval Exploration Plan Submitted Environmental and CZM Reviews Exploration Plan Approved Well permits granted Exploration drilling Starts First Exploration Well Completed Deliniation Drilling Development Plan Approval Develpment Plan Submitted Environmental and CZM Reviews Development Plan Approved Well completion, structure, and pipeline permits granted Construction Starts First oil and gas production
39 Thank You! INTERIOR OFFSHORE MINERALS MINERAL REVENUES U.S. DEPARTMENT OF THE MINERALS MANAGEMENT SERVICE STEWARDSHIP Questions?