Surface-Atmosphere Exchange over Inhomogeneous Terrain: Seeing the Forest for the Trees
|
|
|
- Mary Benson
- 5 years ago
- Views:
Transcription

 19\" x 24\", enamel on")
1 Surface-Atmosphere Exchange over Inhomogeneous Terrain: Seeing the Forest for the Trees HaPe Schmid, Institute for Meteorology and Climate Research, Research Centre Kalsruhe, Garmisch-Partenkirchen (Germany) Duluth, MN, neighborhood Morgan-Monroe State Forest, Indiana,USA Gibbs Roundsavall: "suburban sprawl" (detail) 19" x 24", enamel on aluminium, 2005


2 Pattern: Spatial Scales The atmosphere sometimes organizes into patterns and distinct spatial scales Homogeneous heating Heating gradient Roration (from: Album of Fluid Dynamics)

3 Landscape: Imposes Pattern and Scale

4 Landscape: Imposes Pattern and Scale

5 Landscape: Imposes Pattern and Scale


6 Measured Variability depends on Resolution: the Scale of Measurement Homogeneous Field Mexico City (source: Google)


7 Plant-Environment Interaction: CO 2 Scale of Approach Macroscopic Approach Microscopic Approach 0.1 mm CO 2 ecosystem exchange transport m hourly multi-year intercellular exchange transformation, chemical pathways m seconds hourly everything in between
8 Micrometeorological Flux Measurements: at what scale? Sensor CO 2 Flux Footprint Source Schmid 2002 (Agric. For. Meteorol. 113, )
9 The Flux Footprint: What Part of the Ecosystem does the Flux Sensor see? Is that Part Representative of the Ecosystem? (answer varies over time) If yes: use data; if not: reject data CO 2 e.g.: Schmid (2002, Ag. For. Met., 113, )
 sensor Schmid 1994 (Boundary-Layer Meteorol., 67, 293-318) Inputs: z m z 0 h u * σ w σ v")
10 Flux Footprint = spatial filter, field of view F d Q x x f x x x f Q s s (convolution of the source distribution, Q S, with the footprint, f ) sensor Schmid 1994 (Boundary-Layer Meteorol., 67, ) Inputs: z m z 0 h u * σ w σ v


11 Does the Footprint Concept Actually Work? Vancouver, B.C., Canada: Summer 1986 Schmid et al., BLM 1991
12 "Field of View" / Footprint Varies with Time Turns with wind direction Small in unstable conditions Larger in neutral/stable conditions (after Schmid et al. 1991)
 Vancouver")
 as \"seen\" by a flux sensor at 30 m")


13 Is the Vancouver Suburban Study Area Homogeneous? (regarding a turbulent flux sensor at 30 m) Vancouver Temperature Distribution at full resolution (from airborne IR scanner) as "seen" by a flux sensor at 30 m in unstable conditions as "seen" by a flux sensor at 30 m in near-neutral conditions variability reduced to 18% variability reduced to 4% in unstable conditions: expect spatial variability in near-neutral/stable conditions: expect homogeneity
14 Measured Spatial Variability of Sensible Heat Flux (Q H ) in Residential Vancouver Area (1986) Q H variations within ~ 1 km instrument uncertainty Q H variations decrease with increasing source area (= effective spatial averaging) Inter -Site Period Calibration Period Size of 0.5-level Source Area (m 2 ) spatial representativeness Schmid, 1988; Schmid et al., BLM 1991; Schmid, AgForMet 1997

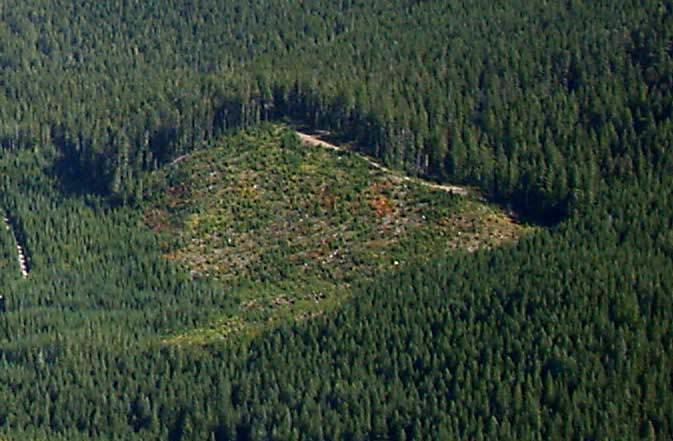
15 Morgan-Monroe State Forest (Indiana)

16 Morgan-Monroe State Forest (Indiana) 39º 53 N, 86º 25 W South central Indiana 275 m Red Oak, White Oak, Tulip Poplar, Sugar Maple year stand age m canopy height 4.9 maximum Leaf Area Index kg m -2 mean aboveground biomass 236 ~ 261 g C m -2 y -1 NEP (1998/99)


17 Location and shape of the footprint m 500 m

 500 m Is the tower optimally")
18 Location and shape of the footprint m... is variable (wind direction, stability) 500 m Is the tower optimally located? What kind of location bias can we expect?

19 Original NDVI: NDVI Variance: (= 100 %)
 Filtered NDVI: Unstable FSAM filter Remaining")
20 Original NDVI: NDVI Variance: (= 100 %) Filtered NDVI: Unstable FSAM filter Remaining Variance: 28 % FSAM Filter Size:
 Filtered NDVI:")

21 Original NDVI: NDVI Variance: (= 100 %) Filtered NDVI: Unstable FSAM filter Remaining Variance: 28 % Histogram Comparison:

22 Hourly Footprints 2001: YD 217- YD 225 Aug 5 Aug 13


23 8-Day Flux Footprint Composite Hourly Footprints 2001: YD 217YD 225 Aug 5 Aug 13
")
24 Lynn Basa: "Sprawl", acrylic on canvas, 12" x 12", 2007 Conclusions Surface patterns impose atmospheric scales Averaging over at least a pattern-unit provides a "scale of homoeneity" Measurements at scales of homogneity are basis for generalisation and linking with models (e.g., at the micro-, stand-, or ecosystem-scale)

; Canadian National Science and Engineering Research Council")
25 Thanks to... Urban Meteorology, UBC Vancouver, Canada Forest Meteorology, Indiana University, Canada with financial support from the US Dept. of Energy (TCP/Office of Science; NIGEC/NICCR); Canadian National Science and Engineering Research Council (NSERC); University of British Columbia (UBC); Indiana University; Research Centre Karlsruhe; German Federal Ministry of Education and Research (BMBF) through the Helmholtz Association