Identifying Nature s Benefits, Deficits, and Opportunities for Equitable Distribution In Populated Places
|
|
|
- Daisy Daniels
- 5 years ago
- Views:
Transcription

1 Identifying Nature s Benefits, Deficits, and Opportunities for Equitable Distribution In Populated Places A high-resolution component of EPA s EnviroAtlas Laura Jackson, Anne Neale, Andrew Pilant, and Timothy Wade Office of Research and Development Research Triangle Park, NC December 13, 2012
2 Community Component of EnviroAtlas High-resolution analysis of 50+ cities & towns along gradients of interest (e.g., location, pop. size, demographics, health & environmental ranking) Application of existing metric calculators Ambient air pollutants removed Water runoff reduction and filtration Ambient temperature reduction Carbon storage and dollar valuation Health benefits of urban air filtration Development of additional metrics and qualitative information Near-road tree buffers and adjacent residential population Vulnerability to heat stress and other localized climate-related hazards Physical and mental health benefits of access to natural amenities Livability metrics of the built environment Community distance to agriculture and potential food production capability Spatially-explicit maps and summary maps by Census block-group Capability to query demographic sub-populations of concern

3 Loss of Ecosystem Services is an Environmental Justice Issue: Is disproportionate in low-income neighborhoods Contributes to cumulative community burdens Is aligned with the public-health concept of social stressors in weakening resiliency, increasing vulnerabilities Crime Noise Dilapidated housing Crumbling infrastructure Loss of social capital Airborne dust Invasive pest species No buffers from pollution Disconnection from Nature EnviroAtlas is part of EPA s PLAN EJ 2014


4 First Pilot Community: Greater Durham, NC Fine-Scale Data Available for Metric Development Landcover Classified to 1m Resolution from USDA NAIP ( ) 5 Additional Pilot Communities: Portland, ME; Tampa; Phoenix; Milwaukee; Portland, OR Metrics Aggregated to 2010 Census Block-Groups


5 Percent impervious surface w/in 1km of every 1m pixel
6

7 BenMAP: EPA s Model for Estimating the Human-Health Benefits of Criteria Air-Pollutant Rules BenMAP works by following three basic steps: 1. Using data from air quality models, it estimates the change in population exposure to certain ambient air pollutants 2. It then estimates changes in the incidence of a variety of health outcomes 3. Finally, it places a dollar value on changes in the incidence of health outcomes 7
8
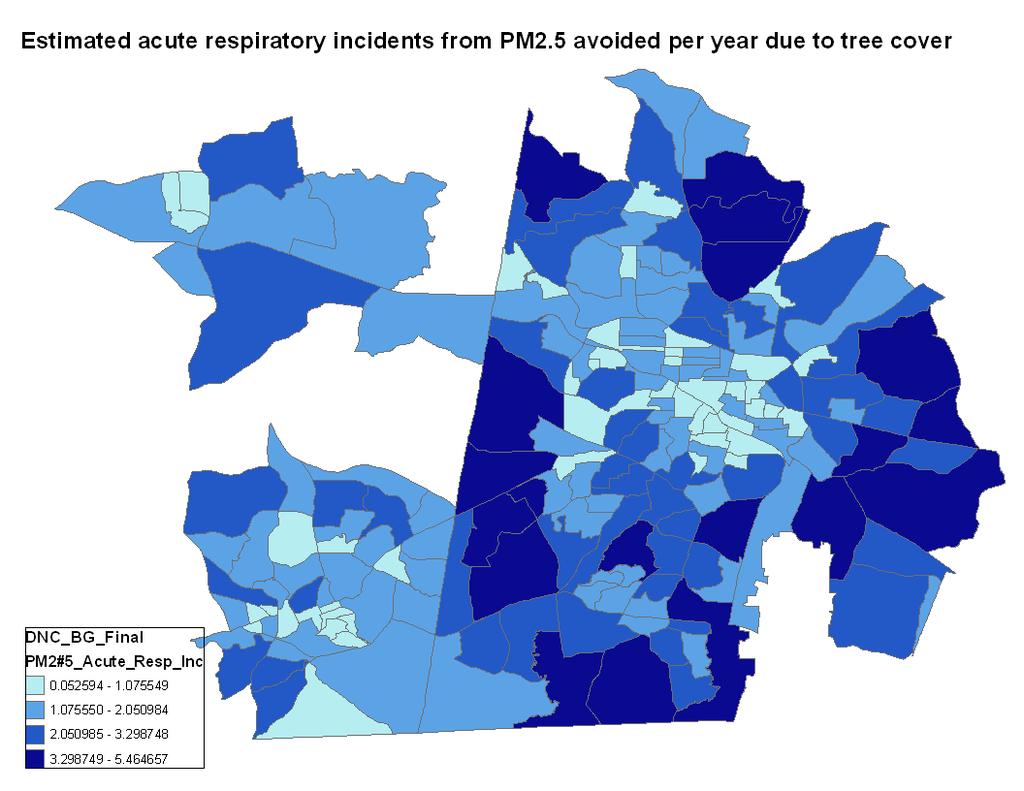
9 Additional i-tree and BenMAP map layers at the Census block-group level depicting: Runoff (m3/year) Median conc. of total suspended solids (kg/year) Mean conc. of total suspended solids (kg/year) Median conc. of biochemical oxygen demand (kg/year) Mean conc. of biochemical oxygen demand (kg/year) Median conc. of chemical oxygen demands (kg/year) Mean conc. of chemical oxygen demands (kg/year) Median conc. of total phosphorus (kg/year) Mean conc. of total phosphorus (kg/year) Median con. of soluble phosphorus (kg/year) Mean con. of soluble phosphorus (kg/year) Median conc. of total Kjeldhal nitrogen (kg/year) Mean conc. of total Kjeldhal nitrogen (kg/year) Median conc. of nitrite and nitrate (kg/year) Mean conc. of nitrite and nitrate (kg/year) Median conc. of copper (kg/year) Mean conc. of copper (kg/year) Kilograms of carbon stored Kilograms of carbon sequestered per year Dollar value of carbon stored Dollar value of carbon sequestered per year Average night time temperature reduction Annual carbon monoxide removal (kg/year) Annual health value of CO removal (dollars/year) Annual nitrogen dioxide removal (kg/year) Annual health value of NO2 removal (dollars/year) Reduced hospital admissions, emergency-room visits, & acute respiratory incidents annually from NO2 removal Annual PM 2.5 removal (kg/year) Annual health value of PM 2.5 removal (dollars/year) Reduced asthma exacerbation, acute & chronic bronchitis, acute myocardial infarction, emergency-room visits, hospital admissions: respiratory & cardiovascular, upper & lower respiratory symptoms, mortality, & work loss days, annually from PM 2.5 removal Annual PM 10 removal (kg/year) Annual health value of PM 10 removal (dollars/year) Annual sulphur dioxide removal (kg/year) Annual health value of SO2 removal (dollars/year) Reduced hospital admissions, emergency-room visits, acute respiratory incidents, & asthma exacerbation, annually from SO2 removal Annual health value of O3 removal (dollars/year) Reduced hospital admissions, emergency-room visits, mortality, & school loss days, annually from O3 removal
10

11 2010 Census Data Attributed to 30m Pixels Dasymetric Mapping: Distributed Census data based on land suitability
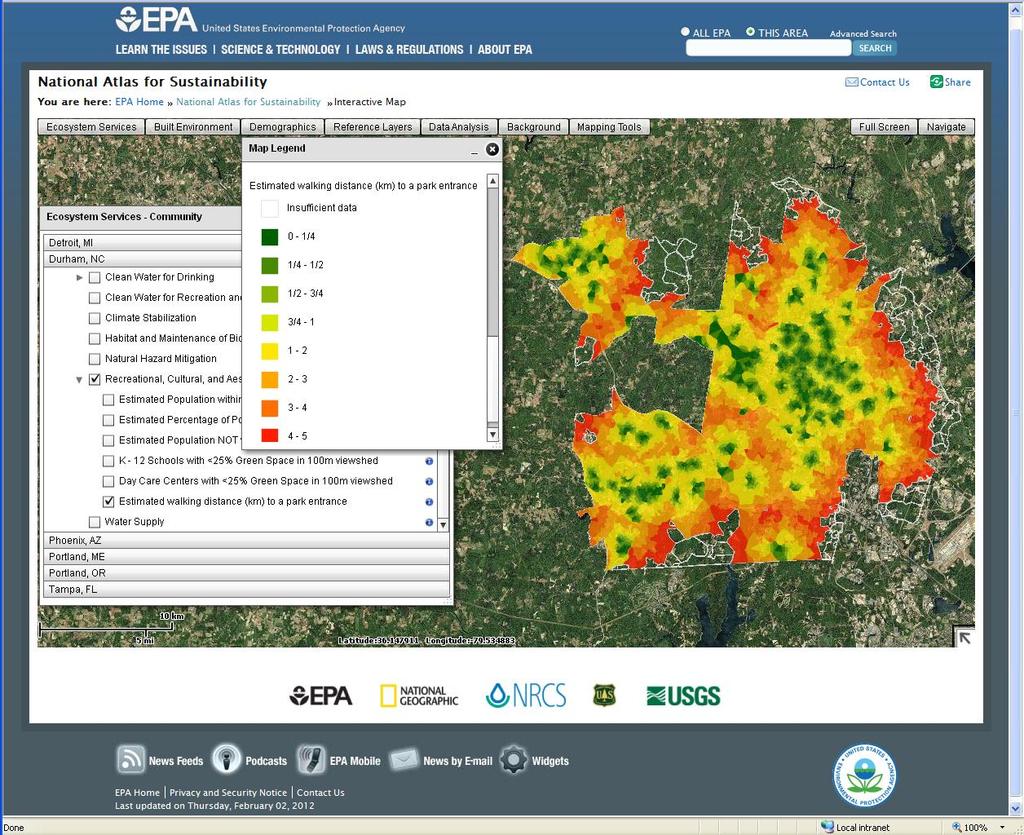
12 EnviroAtlas
13 Near-Road Air Pollution and Health Effects Living, working, or going to school near major roadways has been associated with numerous adverse health issues: Respiratory effects (e.g., asthma, bronchitis) Cardiovascular effects Adverse birth outcomes/developmental effects Premature mortality Cancer A significant portion of U.S. pop. lives near large roads: 2007 American Housing Survey estimates >45 million people Additional portion of population works or goes to school near large roads These residences and schools are disproportionately lower income Elevated pollutant concentrations have been measured near roads: Carbon monoxide Nitrogen oxides (NO/NO2/NOx) Particulate Matter Mass (PM10, PM2.5) and constituents Benzene Metals Courtesy of Richard Baldauf, U.S. EPA

 TKE, no barrier 0.03 2 0 0.025 0 5 10 15 20 25 30 35 40 45 50 1 0.035 X/H 0.02 0.")
 TKE, height 3H wall = 6 0.07 0.")

14 Z/H Z/H Z/H Z/H Z/H Z/H SUSTAINABLE & HEALTHY COMMUNITIES RESEARCH PROGRAM Quantifying Pollutant Filtration by Near-Road Vegetative Buffers (a) Stationary and mobile monitoring in Detroit, Las Vegas, and Research Triangle 6 Park 4 Ambient concentrations of PM, CO, and black carbon downwind of roadside vegetation 2 X/H Computational fluid dynamics modeling to simulate pollutant flow through vegetation Wind-tunnel modeling to simulate diverse meteorological conditions (a) TKE, no barrier X/H Chi, wall height = 3H 0 (c) X/H 4 (b) TKE, wall height = 1H X/H > Chi X/H (c) TKE, height 3H wall = Chi, no barrier (b) Chi, wall height = 1H X/H Ecosystem service will be valued in ambient pollutant concentrations reduced. Ultimate goal: estimate health benefits, incl. total days of life extended, for near-road pop. scenarios
15 Results from North Carolina Field Pilot Coniferous barrier Deciduous barrier Small number of data points due to uncooperative wind conditions Shallow barrier depth only Results depend on wind speed and direction, seasonality, road grade Hagler et al Science of the Total Environment.

 Design for Moving-Window")
16 Potential for Tree Cover to Buffer Busy Roadways (estimated threshold is > 25% cover within 26m of road edge) Design for Moving-Window Analysis


17 Percent of road km, in each direction, with < 25% tree cover w/in 26m of road edge. Estimated population that is w/in 300m of a road without sufficient tree buffer.

18 Potentially correlated health issues: - Healing - Cognitive function - Underweight births - Domestic violence - Social ties Potential mechanisms - Reduced stress - Increased social contact Additional potentially correlated health issues: - Body weight - ADHD symptoms - Longevity in elderly Additional potential mechanism - Physical activity
19 Total Green Space per Person (m2) SUSTAINABLE & HEALTHY COMMUNITIES RESEARCH PROGRAM Example Analytical Capabilities 14,000 Total Green Space per Person vs Percent African-American 2406 Focal Block-Group Comparison 12,000 10, ,000 6,000 Series1 Pop > 70 yrs Series2 Green space/pop Series3 Impervious/pop 4, , Percent African-Americans per Block-Group 1 2 Block Group

20 Pop-up window with slider bar
21 Target Outcomes of EnviroAtlas Increase Community Empowerment public access to environmental data and analytical tools post and integrate community data with national data layers contrast and learn from conditions in other communities and neighborhoods Increase Environmental Intelligence uses and benefits of green infrastructure systems thinking to reveal co-benefits and unintended consequences Improve Public Health and Well-Being identify underserved and vulnerable populations for management action evaluate potential consequences of actions or inaction under alt. scenarios advance state of the science on the role of urban ecology in public health