Fine Grit Removal. Increasing Efficiency Reduces Costs. Paul Barter Hydro International 30 th April 2015 Wakefield
|
|
|
- Clifton Harper
- 5 years ago
- Views:
Transcription

1 Fine Grit Removal Increasing Efficiency Reduces Costs Paul Barter Hydro International 30 th April 2015 Wakefield
2 Contents Grit Removal Specification Grit Characteristics Results The Cost of Grit Cost Benefit Analysis Advanced Grit Systems
3 Grit Removal Specification What is the current grit removal specification? 200 micron 2.65 specific gravity 95% removal How is this tested? Is this correct?
4 Grit Distributions at WwTW 100 Compiled Particle Size Distribution from Treatment Plants Percent Finer Than (%) Particle Size (micron) Chicago (10/27/2004) Chicago (10/28/2004) Chicago (10/29/2004) Florida (Ormand Beach) Florida (Iron Bridge WRF) Florida (Eastern WRF) Florida (Largo WWTP) Florida (St. Petersberg SW) Florida (Three Oaks WWTP) New England (Hartford, CT) Various (Atlanta) Various (Baltimore) Calumet City WRP (7/15/2003) Calumet City WRP (7/18/2003) Clearw ater, FL (Northeast Plant) Clearw ater, FL (Marshall St. Plant) Clearw ater, FL (East Plant) Green Bay, WI Tampa, FL
5 Grit Distributions at WwTW 100 Compiled Particle Size Distribution from Treatment Plants Percent Finer Than (%) Particle Size (micron) Chicago (10/27/2004) Chicago (10/28/2004) Chicago (10/29/2004) Florida (Ormand Beach) Florida (Iron Bridge WRF) Florida (Eastern WRF) Florida (Largo WWTP) Florida (St. Petersberg SW) Florida (Three Oaks WWTP) New England (Hartford, CT) Various (Atlanta) Various (Baltimore) Calumet City WRP (7/15/2003) Calumet City WRP (7/18/2003) Clearw ater, FL (Northeast Plant) Clearw ater, FL (Marshall St. Plant) Clearw ater, FL (East Plant) Green Bay, WI Tampa, FL
6 Grit Distributions at WwTW 100 Compiled Particle Size Distribution from Treatment Plants Percent Finer Than (%) Particle Size (micron) Chicago (10/27/2004) Chicago (10/28/2004) Chicago (10/29/2004) Florida (Ormand Beach) Florida (Iron Bridge WRF) Florida (Eastern WRF) Florida (Largo WWTP) Florida (St. Petersberg SW) Florida (Three Oaks WWTP) New England (Hartford, CT) Various (Atlanta) Various (Baltimore) Calumet City WRP (7/15/2003) Calumet City WRP (7/18/2003) Clearw ater, FL (Northeast Plant) Clearw ater, FL (Marshall St. Plant) Clearw ater, FL (East Plant) Green Bay, WI Tampa, FL

7 Grit Composition Varies Catchment characteristics Sewer condition Frequency of street gritting Soil type Weather conditions
8 Sample Results Percentage Removal Dry Day Wet Day Grit Capture (total) 43% 13% Grit Capture (design particle) Corrected Grit Capture (design particle) 61% 29% 49% 29%

9 Analysis Dry Day 43 % of Grit captured Particle Size Equivalent 134 micron The grit system is capturing most of the grit it is able to, but not a great deal of all that is there.


10 Analysis Wet Day 13 % of Grit captured Particle Size Equivalent 200 micron The grit system is capturing half the grit it is able to.
11 Wet and Dry Weather Studies have shown that only 30% of the grit arrives at a works during dry weather days, most of the grit arrives during wet weather when flows are higher. Applying this to the efficiencies established earlier, means that of all the grit entering the works during a year, you would have a situation where only 22% is captured. Given this works removes 2000 t/y of grit, at 22% efficiency a total of 9090 t/y of grit enter the works with 7090 t/y escaping into downstream processes. By targeting an appropriate smaller sized particle in the first place it is possible to capture in the region of 90% or more of the total grit load, i.e t/y or an additional 6181 t/y.


12 The Cost of Grit
13 The Cost of Grit Increased wear and maintenance on mechanical equipment Pumps, Scrapers, Thickeners, Screens, Centrifuges, Driers - Wear potentially reduced by a factor of over seven - Plant sees 909 t/y instead of 7090 t/y Blocking channels and pipes and vessels - Increased intervals of clearing out digesters / aeration tanks - Currently every 5 to 10 years, could be increased to 20 years or more. Taking up room in process vessels reducing process efficiency Aeration Tanks, Anaerobic Digesters - Improved efficiency of operation - More efficient gas production Extra power costs to keep grit moving Pumps, Aeration, Mixing - Improved efficiency of operation - Less power required (1% of grit increased power consumption by 0.2%) Down-time for process vessels for cleaning Settlement, Aeration, Digestion - Minimising disruption to the plant
14 Guideline Figures from Various Sources Item Mechanical equipment wear and tear Anaerobic Digester cleaning Clearing out channels and tanks Potential cost per 1000m3 of wastewater Range to to to 2.5 Increase power costs to 0.2 Down-time Costs 0.5 * 0 to 1.0 Anaerobic Digester reduced gas yield?? *Big variability based on spare capacity and the availability of alternative treatment streams
15 Potential Savings If we take the sum of the costs, grit is costing 5.76 per 1000 m3 of treated wastewater, using grit technologies capturing just 20 to 50% of the grit load. Therefore if we improve the capture rate to the 90% mark then we are dealing with one fifth to one eighth of the load, therefore the cost is just 0.72 to 1.15 per 1000 m3. Saving 4.61 to 5.04 per 1000m3
16 Cost Benefit Analysis Assumptions: 5 saving 1000 m3 Average 200 l per person per day flow FFTT is 3DWF 4,000,000 3,500,000 3,000,000 2,500,000 Potential Costs Saving with a High Efficiency Grit System 2,000,000 1,500,000 1,000, ,000 0 Population Equivalent High Efficiency Grit System Cost ( ) 20 years Cost Savings ( )

17 Years Cost Benefit Analysis - Payback 8 High Efficiency Grit System Payback Time Population Equivalent
18 Summary Current grit specification inadequate in most cases Typical existing tested systems are showing efficiencies of 10 to 60% Improving grit capture can save a great deal of money Specifications need to change, and testing need to improve in order for the best possible solution to be utilised.
19 Advanced Grit Systems
20 System Efficiency The sand and grit systems overall efficiency is the product of its parts Bulk Removal (µ R ) Washing (µ W ) Dewatering (µ D ) Overall Efficiency µ Overall = µ R * µ W * µ D Hydro Other Bulk Removal 95% 58% Washing 96% 40% Dewatering 96% 42% Overall 88% 10% Fox Lake, IL

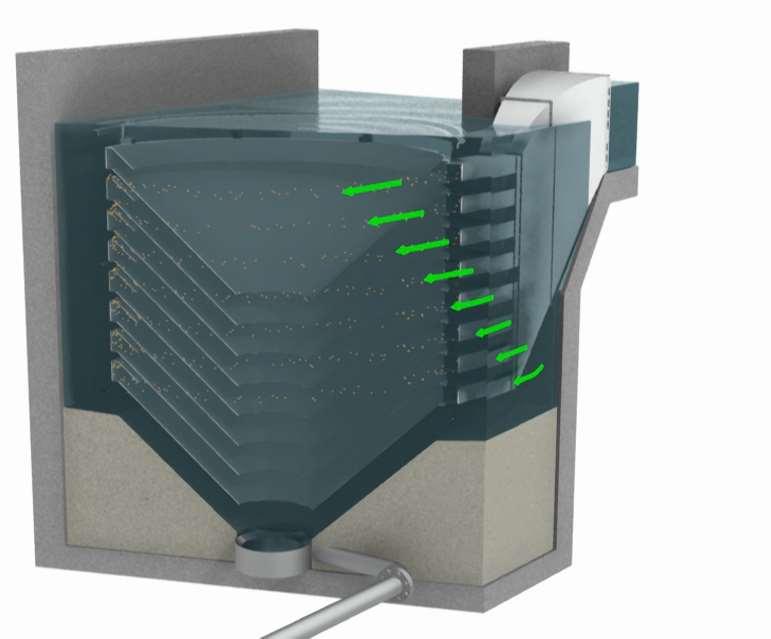
21 HeadCell Grit Removal HeadCell


22 GritCup TM Grit Washing GritCup

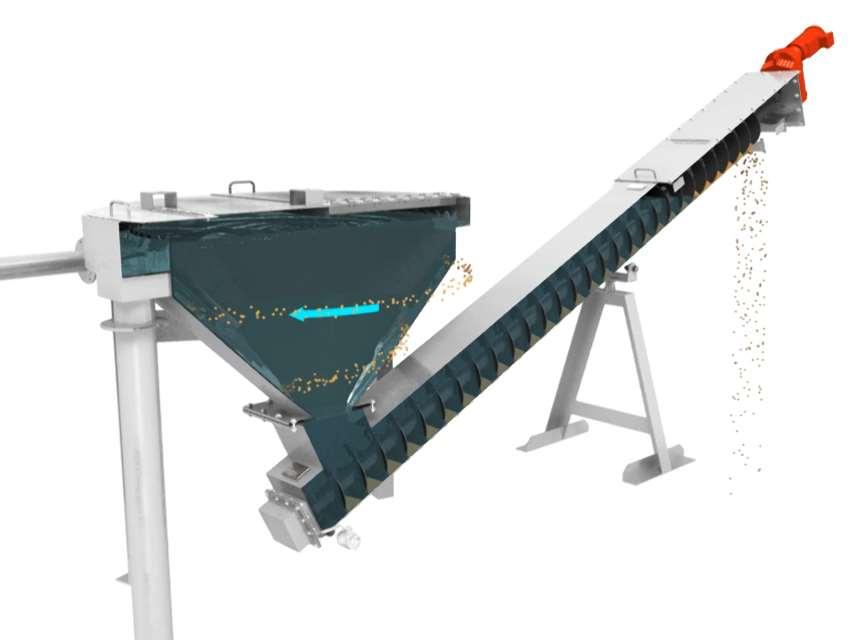
23 SpiraSnail Grit De-watering SpiraSnail


24 Headcell Pilot Plant Hydro International have invested in a pilot Headcell plant, consisting of four 1.2 m diameter trays capable of treating flows of 21.5 to 74 l/s.
25 % FINER Headcell Pilot Plant Results % 90.00% HEADCELL PILOT GRADING ANALYSIS OF SAMPLE NO 1 FROM THETFORD DOWNSTREAM OF DETRITOR Ashed sample 80.00% 70.00% 60.00% 50.00% 40.00% 30.00% 20.00% 10.00% 0.00% SIEVE PORE SIZE (MICRONS)
26 Fine Grit Removal Questions?
27 Thank You