Sustainable Bioenergy in Southeast Asia An FAO perspective
|
|
|
- Elwin McKinney
- 5 years ago
- Views:
Transcription
1 Sustainable Bioenergy in Southeast Asia An FAO perspective Beau Damen Bioenergy Officer FAO Regional Office for Asia and the Pacific
2 Overview Energy & Bioenergy in Southeast Asia Sustainability challenges in Southeast Asia Trade-offs Strategies for sustainable bioenergy FAO Resources Presentation contents
3 Bioenergy in Southeast Asia FAO Regional Office for Asia and the Pacific
4 Energy in ASEAN + 3 TPES in ASEAN + 3 by source (ktoe), 2009 Source: IEA, 2011 Total TPES = 3,506,771ktoe
5 Energy in ASEAN TPES in ASEAN by source (ktoe), 2009 Source: IEA, 2011 Total TPES = 536,335ktoe
6 Bioenergy in ASEAN + 3 Final Bioenergy Consumption by Sector, 2009-Primary Solid Biofuels (TJ) Source: IEA, 2011
7 Energy in ASEAN + 3 TPES and Bioenergy Share in ASEAN + 3, 2009 Country TPES (Ktoe) Bioenergypercentage of TPES Brunei % Cambodia % Indonesia % Lao PDR n/a n/a Malaysia % Myanmar % Philippines % Singapore % Thailand % Vietnam % China % Japan % Republic of Korea % Source: IEA, 2012
8 Energy in ASEAN + 3 TPES, Bioenergy Share and Poverty Rate in ASEAN + 3, 2010 Country TPES (Ktoe) Bioenergypercentage of TPES Ratio of population living on less than $2 per day Year of poverty count Brunei % n/a n/a Cambodia % 53.3% 2008 Indonesia % 46.1% 2010 Lao PDR n/a n/a 66.0% 2008 Malaysia % 2.3% 2009 Myanmar % n/a n/a Philippines % 41.5% 2009 Singapore % n/a n/a Thailand % 4.6% 2009 Vietnam % 43.4% 2008 Source: IEA, 2012, World Bank China % 29.8% 2008 Japan % n/a n/a Republic of Korea % n/a n/a
 bioenrgy routes")

9 Modern bioenergy Schematic view of commercial (modern) bioenrgy routes Source: IPCC, 2011, based on IEA Bioenergy, 2009 The focus of my presentation
10 Modern Bioenergy Outlook - Asia Actual and Projected Bioenergy Demand in Non-OECD Asia, Source: IEA
11 China 362 GW RE (incl. biomass) by billion litres of biofuel by 2020 Lao PDR 450 million litresof biofuelby 2025 Thailand 20% RE (incl. biomass) by billion litresof biofuelby 2022 Malaysia 1065 MW biomass by 2020 B5 mandate Vietnam 5% RE (incl. biomass) by million litres of biofuel by 2020 Indonesia 5% RE by % biofuels by 2025 Philippines 267 MW biomass by % ethanol by 2011 Bioenergy development driven by government
12 Sustianability Challenges in Southeast Asia and bioenergy FAO Regional Office for Asia and the Pacific
13 Energy Security Net Energy Imports of Selected Countries in ASEAN + 3, 2009 Country Net energy imports Net energy imports as a share of TPES Brunei % Cambodia % Indonesia % Lao PDR n/a n/a Malaysia % Myanmar % Philippines % Singapore % Thailand % Vietnam % China % Japan % Republic of Korea % Source: IEA, 2012
14 Energy Projections ASEAN Primary Energy Demand by Fuel Type, Reference Scenario (MToE), Source: IEA, 2009 Energy demand set to grow significantly
15 Tackling emissions Projected CO² Emissions in Non-OECD Asia (MT) MT CO² Thousands Source: IEA
16 Southeast Asia (millions of people) People without access to electricity in ASEAN Source: IEA


 Source:")

17 Food security in Southeast Asia Undernourishment in and by region (millions) Source: FAO, 2010 Leading developing world toward food security


18 Progress toward food security Hunger trends by region Source: FAO, 2012 MDG target in reach

19 Food prices FAO food price indices in real terms: Thailand Source: FAO Rising and increasingly volatile
20 Trade-offs and bioenergy development FAO Regional Office for Asia and the Pacific
21 Need for coordinated approach Trade Rural Development Finance & planning Agriculture Energy Poverty Forestry Environment Bioenergy intersects with a range of policy issues
22 Opportunities of bioenergy Energy Security Reduced emissions Job creation & enterprise development Improved energy access Investment in agriculture Are many
23 Risks of bioenergy development Land-use Change Soil and water impacts Competition for resources Displacement or marginalized small-holders The trade-offs can be significant
24 Different systems Some bioenergy systems imply different levels of resource competition and final impact: High Competition First generation biofuelsfrom coops & residues CHP from dedicated plantations Second generation biofuels from woody biomass Low Competition Biogas Power generation from municipal waste have different impacts
25 Strategies for sustainable bioenergy in Southeast Asia FAO Regional Office for Asia and the Pacific
26 Ensure policies are based on a detailed assessment of the tradeoffs involved
27 Key questions What are the current needs and challenges facing the energy and agriculture sectors? FAO BEFS Analytical Framework Diagnostic Analysis: trends in domestic agricultural markets and food security What are the natural resources available for bioenergy production? Natural Resource Analysis: land, water and residues Which bioenergy feedstock and technologies are feasible/cost effective? What is the environmental impact of different bioenergy production chains? Techno-economic and Environmental Analysis: viable technologies, productions costs, smallholder inclusion, GHG balance How will changes in food prices affect households? What is the impact of bioenergy development on the national economy? Socio-economic Analysis: economy-wide and household effects
28 BEFS in Thailand - Findings Production of key biofuel feedstock will need to grow substantially - sugar cane molasses and palm oil is anticipated to double by 2018, while cassava production is expected to grow by 50 percent Improved yields and some land use and crop change will be required Potential yield improvements for key biofuel feedstock crops are feasible Biofuels production in Thailand is economically competitive compared to imported fossil transport fuels and biofuels.
29 BEFS in Thailand - Findings The profitability of biofuels production is highly sensitive to feedstock costs Biofuels can offer measurable greenhouse gas mitigation advantages over fossil fuels, but the impact of crop change and land-use change on the final emissions profile of biofuels is considerable Biofuels using certain feedstock may not meet the emissions requirements of some markets such as the EU Improving the productivity of feedstock producers would not only stabilize feedstock costs and but also reduce greenhouse gas emissions per unit of biofuel produced.
30 FAO s BEFS Approach A multidisciplinary and integrated set of tools and guidance that support: Establishment of an institutionalized dialogue among relevant national stakeholders Assessment of the sustainable bioenergy potential Risk prevention and management Investment Screening and Appraisal Impact monitoring, evaluation and response Capacity building at technical and policy level
31 BEFS work to date Country level activities Regional level activities APT Peru Sierra Leone Tanzania South Asia ASEAN Thailand SADC
32 BEFS in ASEAN Cha-am Hua Hin Statement on ASEAN Plus Three Cooperation on Food Security and Bio-Energy Development Develop a comprehensive strategy on sustainable and integrated food and biofuels production and consumption Promote bio-energy trade and technology innovation to ensure longterm viability of bioenergy Enhance the partnership with regional and international organizations Foundations
33 TCP/RAS/3204 Development Impact Project Outcome Sustainable, food secure, climatefriendly bioenergy contributes to economic development in AMS Bioenergy provides more effective energy services in AMS with minimal or no impact on food security and the environment. Desired impact
34 BEFS in ASEAN - TCP/RAS/3204 FAO support: National capacity building Regional cooperation Regional technical capacity for ASEAN Secretariat (Ag Industies & NR Division) Formation/reinvigoration of national bioenergy policy bodies directed by SOM AMAF & SOME National and regional BEFS mainstreaming strategies where requested Targeted technical assessments natural resources, technologies and trade & economic Two year, $0.5 million program


35 Wide range of support materials available
36 Avoid harmful environmental impacts
37 Biofuel Feedstock Inputs Bioenergy Feedstock Requirements in East Asia and Pacific ( ) Commodity Wheat & maize Production in 2005 (million MT) Amount required for bioenergy (million MT) Increase Average yield in 2005 (MT/ha) Additional area in 2030 at 2005 yield (million ha) Cassava Sweet sorghum Sugar cane Rapeseed Oil palm Jatropha n.a Total n.a Source: FAOSTAT

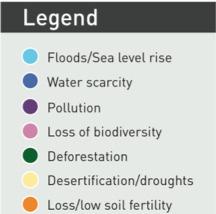
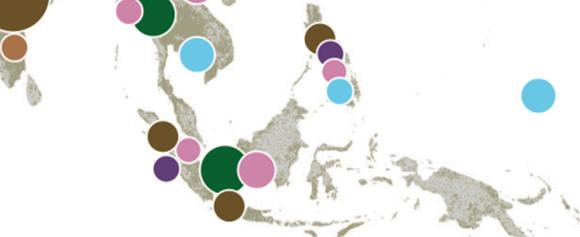
38 Environmental challenges Source: FAO, 2012 Risks associated with agriculture systems
39 Water scarcity Source: FAO,
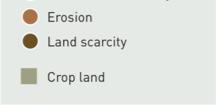
40 Land degradation Source: UNEP & TERI from IWMI 2010 Land resources have already deteriorated
41 FAO Tools for land planning A global assessment tool to support strategy, management, planning, rational use and sustainable development addressing food security facilitating access to data, information and knowledge
42 FAO Tools for water planning Water and crop yields Information system on water and agriculture Irrigation modernization and planning
43 Invest in lifting agricultural productivity
44 Production of plant food calories per hectare of cultivated land (kcal/ha/day) Source: B Dorin (cf. Agribiom), Graph by Agrimonde (2009) Yields have stagnated
 Aid for agriculture has")
45 Share of ODA for agriculture (percentage) Aid for agriculture has declined
46 Ensure small-holders & rural communities will benefit


47 Agriculture, growth & food security Source: FAO, 2012 Benefits need to reach the poorest groups

48 Agriculture, growth & food security Source: FAO, 2012 Agricultural growth can reduce hunger


49 Smallholders in global bioenergy value chains and certification: 3 case studies
50 Rural bioenergy technologies Household biogas Improved cook stoves Biomass gasification Biochar Community biofuel Wide range of innovative systems


51 Integrated Food & Energy Systems FAO IFES Website: Full description of IFES systems Report on IFES systems in China and Vietnam Information on future FAO IFES activities
52 Develop regionally agreed sustainability indicators
53 GBEP Indicators Legitimate Agreed by 45 countries & 22 international organizations including China, Cambodia, Lao PDR, Thailand, Vietnam, ADB & FAO Relevant Applicable to all sources of bioenergy Practical Data availability and the ability to collect the data Scientific Methodical approach to proving the link between the values or changes in values over time and bioenergy production and use
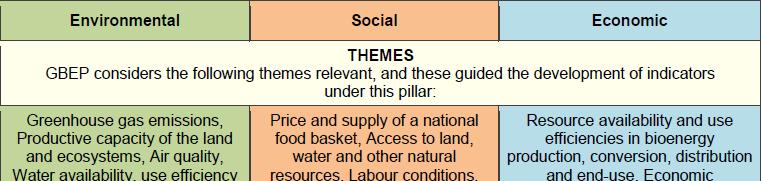
54 GBEP Sustainability Indicators
55 FAO Resources FAO Regional Office for Asia and the Pacific
56 Sustainable bioenergy in Asia Topics include: Challenges in replicating small scale bioenergy projects Opportunities for biochar Bioslurry Wood briquettes industry Challenges to financing bioenergy in Lao PDR & Vietnam


57 FAO Bioenergy Website Find... FAO view and role on bioenergy Details of FAO global bioenergy initiatives Links to Global Bioenergy Partnership Secretariat (GBEP) Electronic FAO Bioenergy publication warehouse
58 BEFS Website Find... Full technical and policy reports for each BEFS country Full description of BEFS Analytical Framework Description of activities in each country Information on each BEFS Partner Organization Links to BEFS reports and materials
59 Contacts: FAO & BEFS Asia and the Pacific Beau Damen Climate, Energy and Tenure Division (FAO HQ) Heiner Thofern Irini Maltsoglou Andrea Rossi
60 Thank you FAO Regional Office for Asia and the Pacific