3.1 Desalination Cost Trends
|
|
|
- Bernice Horton
- 5 years ago
- Views:
Transcription


1 Cost Estimating of SWRO Desalination Plants Day 3: Desalination Project Costs Trends, Examples and Interactive Session June 27, :00-10: Desalination Cost Trends Water Water Globe Globe Nikolay Voutchkov, PE, BCEE
2 Desalination Cost Trends Outline Overview of Recent Projects and Their Cost Breakdown High-end Cost Projects Key Factors Contributing to Their High Costs Low-end Cost Projects Key Factors Resulting in Their Low Costs Impact of Project Delivery on Costs Design-Bid-Build (DBB) Projects Design-Build-Operate (DBO) Projects Build-Own-Operate-Transfer (BOOT)

3 Water Production Costs of Recent SWRO Desalination Projects
4 Key Factors Affecting Costs Source Water Quality - TDS, Temperature, Solids, Silt and Organics Content. Product Water Quality TDS, Boron, Bromides, Disinfection Compatibility. Concentrate Disposal Method; Power Supply & Unit Power Costs; Project Risk Profile; Project Delivery Method & Financing; Other Factors: Intake and Discharge System Type; Pretreatment & RO System Design; Plant Capacity Availability Target.
5 Common Features of LowCost Desalination Projects Low Cost HDPE Open Intakes or Beach Wells; Near-Shore/On-Shore Discharges w/o Diffuser Systems or Co-discharge w/ Power Plant of WWTP Outfalls; Point of Product Water Delivery within 5 Miles of Desalination Plant Site; RO System Design w/ Feed of Multiple Trains by Common High Pressure Pumps and Energy Recovery Systems; Turnkey (BOOT, BOO) Method of Project Delivery.
6 Key Reasons for Cost Disparity Between High-End & Low-end Cost Projects Desalination Site Location (NIMBI vs. Science Driven) Costly Plants Have Overly Long Product Water Delivery Pipelines 120 MGD Melbourne Plant Cost of Plant/Delivery + Power Supply Systems = US$1.7 BB/1.1 BB (50 miles) 66 MGD Sydney SWRO Plant Cost of Plant/Delivery System = US$560 MM/US$490 MM (10 miles of underground tunnel under Botany Bay). Environmental Considerations Phasing Strategy Complex Intakes & Diffuser Systems Intake and Discharge System Capacity; Pretreatment & RO System Design; Labor Market Pressures Method of Project Delivery & Risk Allocation
7 Project Delivery Alternatives Design-Bid-Build (DBB): Key Benefit - Utility Owns All Assets; Key Disadvantages Utility Takes All Risks and Reduces Borrowing Capacity. Design-Build-Operate (DBO)/ Alliance : Key Benefit Utility Owns All Assets; Key Disadvantages Utility Shares Some Construction & Operations Risks and Reduces Borrowing Capacity. Build-Own-Operate-Transfer (BOOT): Key Benefit Utility Transfers Most Risks to Private Sector and Only Pays for Water it Receives; Key Disadvantages Utility Does Not Own the Assets.
8 Risk Allocation Profiles for BOOT & Alliance (DBO) Project Delivery Type of Project Risk BOOT Alliance/DBO Permitting Private Public Source Water Private Shared Technology Private Shared Operations Private Shared Water Demand Public (Take or Pay Private Equity at Risk) Public Power Supply Private Public Construction Private Shared Financial Private Public
9 Worldwide the Lowest Cost of Desalinated Seawater Has Been Delivered Under BOO/BOOT Contracts!

10 Magtaa Project Bid Structure
11 Recent Lowest Cost SWRO Project Bids Worldwide Cost of Water (US$/m³) Power Use (kwh/m³) & TDS Sorek, Israel 411 ML/d BOO (startup 2014) (40 ppt) Mactaa, Algeria 500 ML/d BOOT (startup 2013) (40 ppt) Hadera, Israel 330 ML/d BOO/co-located (startup 2009) (40 ppt) Cap Djinet, Algeria 100 ML/d BOO (startup 2010) (38 ppt) Carlsbad, USA 189 ML/d BOO co-located (startup 2012) (33.5 ppt) SWRO Plant
12 What All Recent BOOT Projects Have in Common? All Yielded the Lowest Costs and Power Use of Desalinated Water in Their Respective Markets; Plant Performance & Permitting Risks Reside with the Private Sector; Debt Repayment is Private Sector Obligation; Private Sector Only Gets Paid for Delivering Product Desalinated Water; Public Utility Can Buy Out (Transfer) Project Ownership Once Plant Has Proven Its Long-term Performance.

13 Ashkelon Lowest Cost of Water Worldwide How Did They Do It?
14 Ashkelon Cost of Water Breakdown Source: Dreizin, 2004
15 Ashkelon How Did They Do It? Low Cost Conventional Pretreatment Single Stage Dual Media Filters; Large Size (20-micron) Cartridge Filters; Three-Center RO Design w/ Pressure Exchangers: Low Cost Post-Treatment Calcite Filters & Blending; Self-Power Generation 80 MW Gas Generators and Purchase of Rights to Gas Field Use; Discharge Collocation with Power Plant in Well Mixed Tidally Influenced Zone No Need for Outfall.
16 Perth & Sydney SWRO Plants Cost Breakdowns Perth Sydney Capacity (ML/d) Distance from intake (km) Distance to delivery (miles) Total Capital Cost ($M) Total Capital Cost Desal Plant ($M) Total Capital Cost - Delivery ($M) Annualized Capital Cost ($M/yr) Total Annual O&M Costs ($M/yr) Annual O&M Cost Desal Plant ($M/yr) Annual O&M Cost Delivery ($M/yr) Cost of Water Capital Component ($/m3) Cost of Water O&M Component ($/m3) Cost of Water Delivery Component ($/m3) Total Water Cost, $/m3 125 < $325 $281 $44 $25 $ $1,539 $982 $557 $120 $46 $16 $42 $1 $4 $0.70 $1.65 $0.44 $0.58 $0.02 $0.06 $1.16 $2.29 adapted from Waterlines:NWC Australia
17 Be Careful When Comparing Costs! Projects Differ By: Source Water Salinity and Temperature; Product Water Quality; Unit Cost of Construction, Labor and Permitting; Cost of Capital; Unit Cost of Power; Source of Equipment Supply; Project Completion Schedule. Projects Have to Be Normalized for These and Other Factors for Accurate Comparison.

18 Water Production Costs of Desalination vs. Indirect Potable Reuse
19 Comparison of Huntington Beach Desalination & OC Ground Water Replenishment Projects Key Project Parameters Orange County GWR Huntington Beach Indirect Potable Reuse Seawater Desalination Project Project Water Production Capacity 206 ML/d 189 ML/d Source Water WWTP Effluent Discharge Seawater - Power Plant Cooling Water Location Orange County, California Orange County, California MF+BWRO+UV+ Peroxidation+ Lime Conditioning Granular Medial Filtration+SWRO+ Calcite Conditioning Groundwater Recharge Wells Regional Water Distribution System Source Water Treatment Product Water Delivery
20 Comparison of Costs for Drinking Water Production by Indirect Potable Reuse & Seawater Desalination Orange County GWR Huntington Beach Key Cost Parameters Indirect Potable Reuse Project Seawater Desalination Project Capital Costs (US$) $486.9 ML/d $335 ML/d US$0.126/kWh U$12.4 MM/yr (1.31 kwh/m³) US24.3 MM/yr (2.8 kwh/m³) Chemicals US$4.6 MM/yr US$2.3 MM/yr Maintenance US$1.4 MM/yr US$2.5 MM/yr Membrane Replacement US$2.4 MM/yr US$0.9 MM/yr UV Lamp Replacement US$0.3 MM/yr Not Applicable Labor US$3.6 MM/yr US$2.4 MM/yr Other O&M Costs US$4.7 MM/yr US$2.3 MM/yr Total Annual O&M Costs US$29.4 MM/yr US$34.7 MM/yr Amortized Capital Costs US$27.8 MM/yr US$19.1 MM/yr Cost of Water Production US$57.2 MM/yr US$0.76/m³ US$53.8 MM/yr US$0.78/m³ Cost of Extraction/Delivery US$0.12/m³ US$0.07/m³ Total Cost of Water US$0.88/m³ US$0.85/m³

21 Where Future Cost Savings Will Come From?
22 Main Areas Expected to Yield Cost Savings in the Next 5 Years (20 % Cost Reduction Target) Improvements in Membrane Element Productivity: - Polymetric Membranes (Incorporation of Nano-particles Into Membrane Polymer Matrix) CSIRO & UCLA; - Larger Membrane RO Elements (16 Diameter or Higher). Increased Membrane Useful Life and Reduced Fouling: - Smoother Membrane Surface Carbon Nanotube Membranes CSRO & University of Texas (Austin). - Increased Membrane Material Longevity; - Use of Systems for Continuous RO Membrane Cleaning; - UF/MF Membrane Pretreatment. Commercial Forward Osmosis Systems; Co-Location With Power Plants; Regional Desalination and Concentrate Disposal; Larger RO Trains and Equipment; Full Automation of All Treatment Processes.
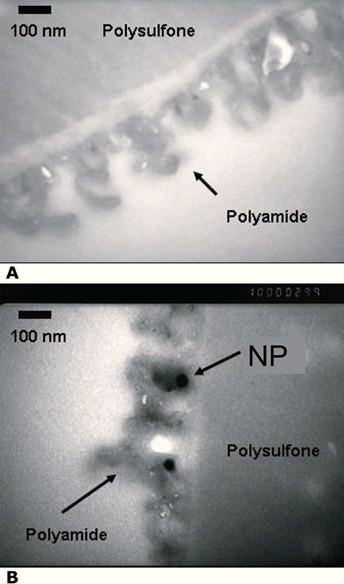
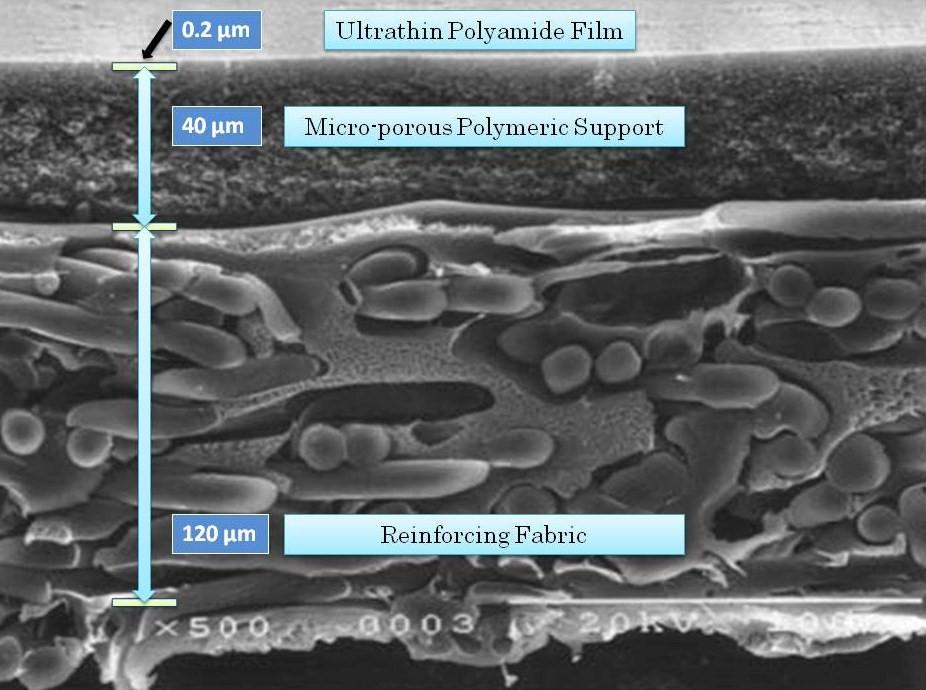
23 Nano-Structured SWRO Membranes

24 Potential to Reduce 60 to 80 % of Energy Costs & 15 to 25 % of Cost of Water OASYS
25 Research Directions to Meet the Long-Term 80 % Cost Reduction Goal Improve Membrane Useful Life and Productivity; Develop Corrosion Resistant Non-Metallic Materials to Replace High-Quality/High Cost Stainless Steel RO Piping; Reduce Pretreatment Costs; Develop New-Generation Energy Recovery Systems; Introduce Low-Cost Technologies for Beneficial Concentrate Use and Disposal; Explore New Technologies for Seawater Desalination Different from RO and Thermal Evaporation.
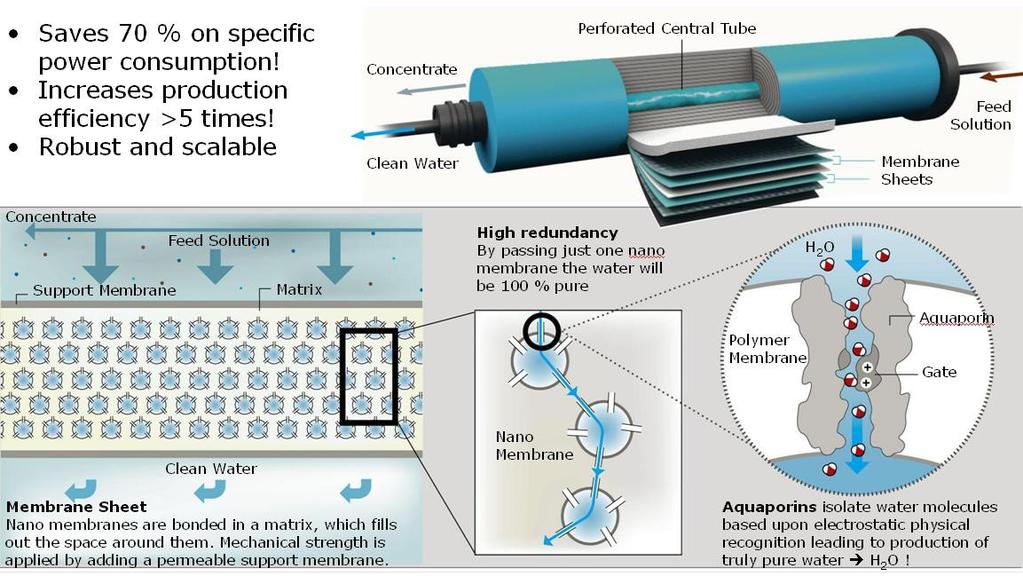
26 Aquaporine-Based Desalination
27 The Best of Seawater Desalination Present Status & Future Forecasts Parameter Today Within 5 Years Within 20 Years Cost of Water (US$/m³) US$ US$ US$ Construction Cost (Million US$/ML) Power Use (kwh/m³) ,000-12,000 8,000-15,000 20,000-40,000 Membrane Useful Life (years) Plant Recovery Ratio (%) Membrane Productivity (gallons/day/membrane)
28 Concluding Remarks The Ocean Will Become One of the Key Sources of Reliable and Draught-Proof Coastal Water Supply in the Next 10 to 20 Years; Large-scale Seawater Desalination is Economical Today and Will Become Even More Cost-Competitive in the Future; The Future of Seawater Desalination Is Bright 20% Cost of Water Reduction in the Next 5 Years; Long-term Investment In Research and Development Has the Potential to Reduce the Cost of Desalinated Water by 80 % In the Next 20 Years.

29 Desalination Cost Trends Question s?

30 Coffee Break