Lecture 7 Global Warming/Climate Change (Observations and Attribution of Cause) METR/ENVS 113 Spring Semester 2011 May 3, 2011
|
|
|
- Dale Griffith
- 5 years ago
- Views:
Transcription
 METR/ENVS 113 Spring Semester 2011 May")
1 Lecture 7 Global Warming/Climate Change (Observations and Attribution of Cause) METR/ENVS 113 Spring Semester 2011 May 3, 2011
2 Reading Henson Rough Guide Chapter 1 Pages ; 215; Other pages (scan through, it s a short book) Ahrens Chapter 14
3 Some background Weather vs. Climate Trends vs. Fluctuations
4 What is weather vs. climate? Weather: The state of the atmosphere at some time and place. For example, the maximum temperature in San Jose on Wednesday August 25, 2010 was 100 F. Climate: The average state of the atmosphere over many daily or seasonal weather events over a long time period (generally many years). Local & Regional Climate: Average of weather events just in a particular place or region (e.g. San Jose or SF Bay Area) Global Climate: Average of weather events over entire globe. For example, the average ( normal ) maximum temperature in San Jose on August 25 is 82 F.
5 Question Are the following statements about weather or climate? It was rainy in Southern Europe last week. Weather The gulf-stream ocean current causes the U.S. east coast to be warm during the summer. Climate Tornados are frequent in the U.S. Midwest. Climate Next year is expected to be a La Nina year. Weather
6 Question Are the following statements about weather or climate? It was rainy in Southern Europe last week. Weather The gulf-stream ocean current causes the U.S. east coast to be warm during the summer. Climate Tornados are frequent in the U.S. Midwest. Climate Next year is expected to be a La Nina year. Weather
7 Climate is the average of weather Given the following data, calculate the average maximum temperature on August 25 in San Jose, California Year Tmax Year Tmax Year Tmax AVERAGE (10 YEAR) AVERAGE (30 YEAR) 81.8 ~ 82 F
8 Fluctuations Trends vs. Fluctuations Short-term Also called noise Sometimes explainable, sometimes not ( random ) No discernable long term trend in fluctuations (they cancel out ) Trend Long-term rise or fall over period of interest Also called signal Explainable (through hypothesis or theory) Climate scientists attempt to explain trends in climate, not fluctuations.
9 Fig. 1. A linear trend. 5 4 Temperature Anomaly Year
10 Weak vs. Strong Trend Fig. 7. Weak and strong signals Temperature Anomalies 6 4 strong 2 weak Year
11 Fig. 2. Random fluctations. 3 2 Temperature Year
12 Fig. 3. Rising trend with random fluctuations. 6 4 Temperature Anomaly Year
13 Weak Fig. 9. Trend Weak signal w/ Strong with noise. Fluctuations 2 Temperature Anomaly Year
14 Fig. Strong 10. Trend Strong with signal Weak with Fluctuations noise Temperature Anomaly Year
15 Signal Signal-to-Noise Ratio Trend over a given time Noise Average size of fluctuations High Signal to Noise ratio More signal than noise Trend is evident In this case, trend usually has high statistical significance Low Signal to Noise ratio More noise than signal Trend is not very evident In this case, trend usually has low statistical significance
16 Length of Record If trend persists, signal-to-noise ratio increases with time eventually, trend will be detected Example follows
17 Fig. 11. Signal + Noise After 20 Years. 3 Temperature Anomaly Practically no signal, all noise Year
18 Fig. 12. Signal + Noise After 40 Years. 3 Temperature Anomaly Signal starts to appear, but more noise Year
19 Fig. 13. Signal + Noise After 60 Years. 3 Temperature Anomaly Signal very apparent, still some noise Year
20 Fig. 14. Signal + Noise After 80 Years. 3 Temperataure Anomaly Strong signal w/ noise Year
21 Fig. 15. Signal + Noise After 100 Years. 3 Temperature Anomaly Very strong signal w/ noise Year
22 Main Point Earth climate record is generally noisy. i.e., there are seemingly random fluctuations Not all of these fluctuations can be explained Any trend takes time to become apparent. Generally need to look at evolution over several decades to see climate trends.
23 Observations of Warming (Global Temperature the Last 100+ Years)
24

25 Global Historical Climate Network monthly/index.php
 http://www.ipcc.ch/publications_and_data/ar4/wg1/en/faq-3-1.")
26 Spatial Pattern: Rate of Surface Temperature Change (over period 1979 to 2005)
27 Summary: Surface Temperature Record (Industrial Era, last 100+ years) Increase of around 1ºC over last century in global average temperature Higher increase in Northern Hemisphere More land area in NH (land has lower heat capacity than water) Snow melt, lower albedo, more sunlight Uncertainties in surface temperature network Changes in location & method of measurement at a station over time Sparse station data in certain locations (oceans & southern hemisphere) Error bars on graphs indicate range of uncertainty, appears modest and decreases with time.
 Previous IPCC assessment http://www.ipcc.ch/publications_and_data/ar4/wg1/en/ch3s3-2-2-3.")
28 Sea Surface Temperatures Sea-surface temps (10-year means, red bars annual values) Marine air temps (10-year means) Previous IPCC assessment
29 Temperature Change Above Surface: (Troposphere & Stratosphere) Balloons o Also called rawinsondes o Since 1960s Microwave Satellites o Since 1980s o Advantage: Uniform global coverage
 http://www.ipcc.")
30 Spatial Pattern: Rate of Tropospheric Temp. Change (1979 to 2005, determined from balloons and satellites)
31 Other Signs of Warming
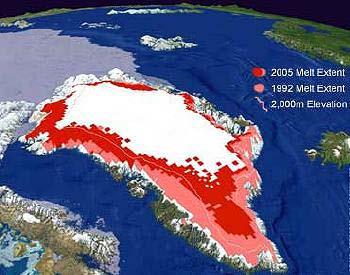
32 Ice and Snow Shrinking of mountain glaciers Reduced area and volume of arctic sea ice Increased melting of Greenland ice sheet Rapid melting on Antarctic Peninsula

33 Athabasca Glacier Recent Photo

34 Previous Positions

35 1890 Position
36
37 pages/glaciers.html


38 An Alaskan Glacier

39 Mt. Kilamanjaro

40 Mt. Kilamanjaro
41 Worldwide
42 Global Loss of Ice: Mountain Glaciers

43 Increased Summer Melting of Greenland Ice Sheet
44 Update

45 Moulin Schematic

46 A Moulin A tunnel through which melt water flows to the bottom Provides lubrication between ice sheet and bedrock, facilitating movement into sea. More surface melting, more lubrication, easier movement offshore.
47 Rising Sea Level Two main reasons Reason 1: Thermal expansion of sea water as seasurface temperature rises Reason 2: Melting/Break-up of land ice (snow, ice sheets & glaciers) and resulting flow to sea. Note: Melting of sea ice or ice shelves does not cause sea-level rise since these are already in the sea
 http://www.gloss-sealevel.")
48 Global Sea-Level Observing System (GLOSS)

49 t_sea_level_rise

50 Arctic Sea Ice: Last 50 years

51
52 Summary Widespread indications of global warming last 100+ years o Warming Land surface temperatures o Warming Sea Surface Temperatures o Melting Land Ice (Ice Sheets, glaciers) o Rising Sea Level o Melting Sea Ice
53 Attributing Cause of Warming ( Attribution )
54 A Key Point from Previous Slides... Global Warming is Global It is a global phenomenon, as opposed to local or regional Because it is global, there must be a radiative imbalance between the IR + solar radiation entering vs. IR radiation leaving the surface/troposphere system. i.e. there must be a positive radiative forcing
55 Zero Radiative Forcing Upward IR Solar + Downward IR stratosphere Tropopause troposphere Surface Upward IR balances Solar + Downward IR No change in globally-averaged temperature This is the natural state of affairs, observed over short geologic time scales (over several decades/centuries)
56 Positive Radiative Forcing Upward IR Solar + Downward IR Tropopause Surface Surface Upward IR less than Solar + Downward IR Increase in globally-averaged temperature in this case This is what has been observed last 100+ years i.e. total radiative forcing last 100+ years has been positive (> 0)
57 Negative Radiative Forcing Upward IR Solar + Downward IR Tropopause Surface Surface Upward IR greater than Solar + Downward IR Decrease in globally-averaged temperature in this case May result, for example, from additional aerosols in atmosphere reflecting more solar radiation back to space.
58 How is Concept of Radiative Forcing Used to Attribute Cause for Temperature Rise? Determine amount RF due to various changes that have taken place since beginning of industrial era (circa 1750) Increased GHG concentrations Increased particle concentrations (sulfates, black carbon, others) Changes in ozone levels (tropospheric and stratospheric) Land use changes Solar intensity changes Others.
59 Changes since 1750: 1. Increased GHG gases
60 Changing GH gas concentration
61 Radiative Forcing due to increase in GHG concentrations Increased GHG concentration in atmosphere Increased greenhouse effect Positive Radiative Forcing (+) See previous lectures for further explanation
62 Changes since 1750: 2. Increased aerosol concentration
63 Sulfates in Ice Cores Clear increase over industrial era Purple, Red: Sulfate concentration measurements in ice (ppb) Black: Emissions (Tg Sulfur per year)

64 Black Carbon
65 Mechanism: Aerosol Direct Forcing Increased aerosol concentration in atmosphere Increased aerosol radiative effects Reflection of sunlight: Negative Radiative Forcing (direct*, sulfates) Absorption of sunlight: Positive Radiative Forcing (direct, black carbon) *There are also indirect forcings due to aerosol effects on clouds. These will not be discussed
66 Changes since 1750: 3. Changes in ozone concentration
67 Mechanism: Ozone forcing (troposphere) Increased concentration of ozone in troposphere Increased greenhouse effect (ozone is minor, yet not negligible, GH gas) Positive Radiative Forcing (+)
68 Mechanism: Ozone forcing (stratosphere) Decreased concentration of ozone in stratosphere Less downward IR emitted from ozone from stratosphere to surface Decreased absorption of uv light from sun Cooler stratosphere Negative Radiative Forcing
69 Changes since 1750: 4. Land Use Changes

70
71
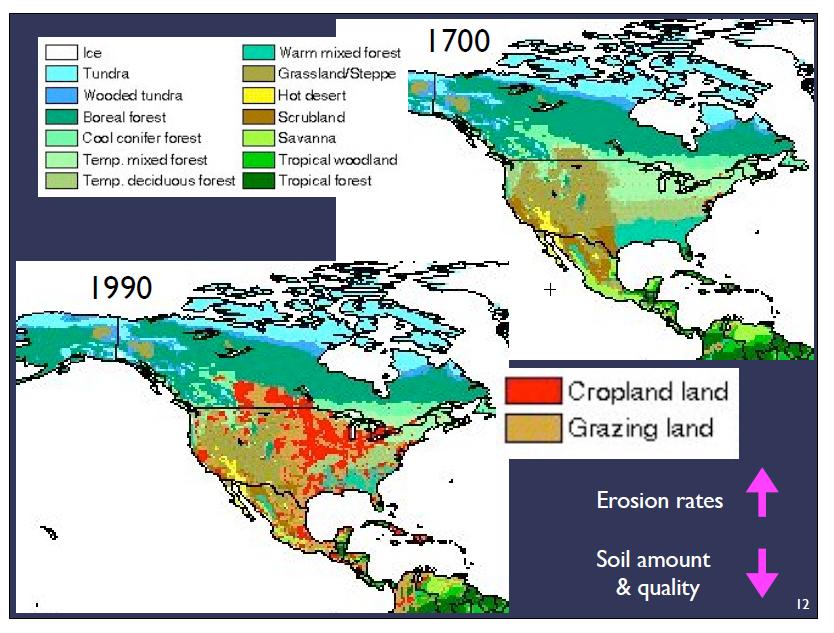
72 Mechanism: Land Use Change forcing Change of wooded land to cultivated land Increased surface albedo Negative Radiative Forcing
73 Changes since 1750: 5. Other Things Changes in Solar Intensity (Sunlight) Water Vapor increases in stratosphere Black Carbon on Snow Contrails Various other things of lesser importance
74 Results: Radiative Forcing Comparison
75 GHG Forcing Ozone Forcing Land Use and BC on Snow Aerosol (Direct Effect) Aerosol (Indirect Effect/Clouds) Increases in Sunlight TOTAL NET FORCING IS POSITIVE (confirmed)
76 Summary RF calculations confirm total radiative forcing is positive. Best Estimate: +1.6 W/m2 This amount of radiative forcing is roughly in line with observed warming of 1 deg C over last 100+ years*. Greenhouse gas forcing (CO 2, methane, etc ) is by far the largest positive radiative forcing contributing to total radiative forcing. Therefore, GHG forcing is the only positive forcing identified to date that could explain warming over last century. In particular, GHG forcing much greater than solar forcing This is based on the fairly well scientifically confirmed fact that the earth s average temperature would rise around deg C for a radiative forcing equal to a doubling of CO2, or in other words that the earth s climate sensitivity is degrees C.
77 An interesting video Watch video First part gives a good history of climate change science, emphasizing how a consensus among climate scientists that global warming was mainly due to anthropogenic greenhouse gas forcing has been around for a long time. Second part is very interesting, discussing origin of efforts by interested parties to not acknowledge this consensus, and thereby exaggerate (invent?) scientific uncertainty about global warming. Be prepared to answer a multiple choice question about history of global warming research as it pertains to attribution to increase GHG concentration. Also, be prepared to incorporate this and other general ideas of video as part of a broader short-answer question on attribution on final exam. First part of video emphasized.
78 Final Exam: Some Multiple Choice Questions
79 Which of the following best describes the global spatial pattern of global warming seen the last 100+ years? a) Increase in temperature over most of the globe, largest around the equator. b) Increase in temperature over the entire globe, with small variation from place to place. c) Increase in temperature over most of the globe, largest over the oceans d) Increase in temperature over most of the globe, largest in high latitudes of northern hemisphere.
80 Some anthropogenic activity occurs and as a result there is an increase in black carbon in the atmosphere as well as deposited on the surface. What would you expect to occur? a) Negative radiative forcing, thereby cooling the surface. b) Positive radiative forcing, thereby cooling the surface. c) Negative radiative forcing, thereby warming the surface. d) Positive radiative forcing, thereby warming the surface.
81 According to IPCC estimates, how do the sign and values for radiative forcing due to changes in solar radiation and land use compare to the radiative forcing due to increases in greenhouse gas (GHG) concentrations the last 100+ years? a) Signs of all three are positive; Value of GHG forcing is much greater than both solar and land use forcing b) Signs of all three are positive; Value of GHG forcing about the same as land use forcing and much greater than solar forcing. c) Signs of GHG and solar forcing are positive, sign of land use forcing is negative; Value of GHG forcing much greater than solar forcing. d) Signs of GHG and land use are positive, sign of solar forcing is negative; Value of GHG forcing much greater than land use forcing.