ICTP Workshop - BWR NPP & Simulator Overview
|
|
|
- Madlyn Lyons
- 5 years ago
- Views:
Transcription
1
2 ICTP Workshop - BWR NPP & Simulator Overview Wilson Lam (wilson@cti-simulation.com) CTI Simulation International Corp. Sponsored by IAEA
3 Advanced BWR Plant - generic features Direct Cycle - heat generated in reactor core is directly utilized for steam generation inside the reactor vessel. Steam develops as small bubbles (void) entrained in core coolant. It is separated in the coolant flow from Steam Separators, and dried in Steam Dryer arrangement - minimize water carry-over & more longlived radioactive products from the reactor water.

4 BWR- ABB
5 Reactor Core & Fuel Design BWR core consists of a number of fuel bundles (assemblies). Each fuel bundle (assembly) consists of a number of fuel rods arranged in n x n square lattice (slightly enriched uranium fuel - typical enrichment 2 % to 5 % U-235 by weight). Average core power density ~ 60 % PWR. Number of control rods enter the core from the bottom, through guide tubes in the fuel assemblies.

6
7 Reactor Core & Fuel Design BWR allows bulk boiling of water. Operating temperature ~ 288 C; steam pressure 7 MPa Reactor power control consists of control rods and recirculation flow control Control rods (neutron absorbing materials) maintain a constant desired power level by a adjusting their positions ~ 2 % per sec. Recirculation flow control also controls reactor power by altering the density of water used as moderator. The flow rate is adjusted by a variable speed pump. Power changes ~ 30 % per minute
8 Question #1 Why adjusting recirculation flow rate in BWR will control reactor power?
9 Question #2 Why Control Rods enter from the bottom of the core, as opposed to entering from the top of the core, like in PWR or PHWR?
10 Main Steam System Dried steam from Reactor Pressure Vessel (RPV) to the turbine plant through four steam lines connected to nozzles equipped with flow limiters. Limit the coolant blowdown rate from the RPV = or < 200 % rated steam flow at 7.07 MPa upstream pressure in the event of steam line break occurs anywhere downstream the nozzle. Isolation valves inside and outside of containment wall. Safety Relief Valves (~16) connected to the four steam lines to prevent RPV overpressure, with blow down pipe to Suppression Pool.

11
12 Turbine & Steam Bypass Systems Saturated steam from RPV main steam lines admitted to turbine HP cylinder via the governor valves. After HP section, steam passes through MSR to LP turbine cylinders. A special Steam Bypass line prior to the turbine governor valves, enables dumping the full nominal steam flow directy to condenser in the event of plant upset (e.g. turbine trip), in order to avoid severe pressure surges and corresponding power peaks in reactor.

13
14 BOP & Feedwater System Typical BOP systems - condenser; condensate pumps; deaerator; feedwater heaters; Reactor Feed Pumps (RFP); Reactor Level Control Valves.
15
16 Containment & ECC Reactor Building Stack Reactor Containment filter spray Upper Drywell ECC BWR SRV steam spray Lower Drywell Wetwell or Pressure Suppression Pool feedwater
17 Containment Containment - cylindrical prestressed concrete structure with embedded steel liner - encloses reactor, reactor coolant pressure boundary & important ancillary systems. Pressure-suppression type with drywell and wetwell. Wetwell separated from drywell by partition floor. The wetwell s lower portion is filled with water - condensation pool. Upper portion serves a gas compression chamber.
18 Containment (cont d) Drywell pressurization (LOCA) - drywell atmosphere & steam pushed into the wetwell via a passage through the partition wall. Steam condensed in suppression pool. Noncondensables collected in the gas compression chamber Pressure suppression further supported by water spray system to gas compression chamber and the upper drywell. Containment vessel can also be vented manually or via rupture disk, to the stack through filter system
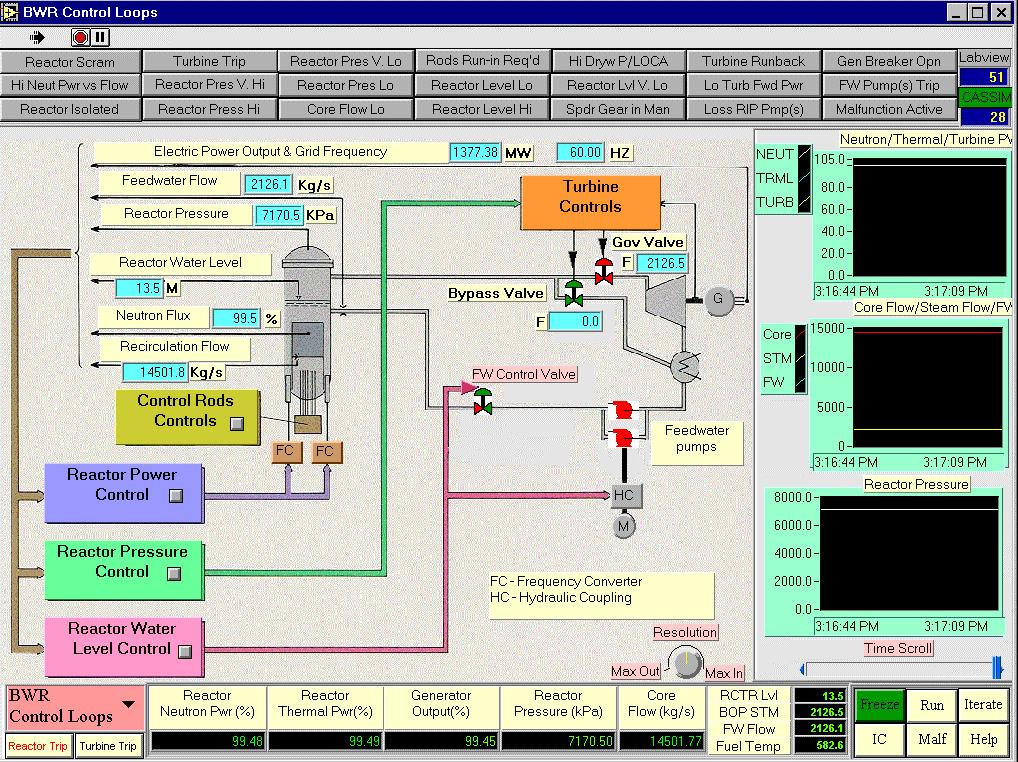
19 BWR Control Systems Reactor Power Control Reactor Pressure Control Reactor Water Level Control Turbine Control Turbine Steam Bypass Control

20
21 Reactor Power Control The reactor power output control system consists of control rods, rod drive system and recirculation flow control system. The control rods and their drive system maintain a constant desired power level by adjusting the position of the rods inside the core.
22 Rod Control System The Control Rod Drive System is composed of three major elements using fine position digital motor drive & hydraulic drive: (1) the fine motion control rod drive, FMCRD mechanisms; (2) the hydraulic control unit (HCU) assemblies; (3) the control rod drive hydraulic subsystem (CRDH).
23 Rod Control System (cont d) The FMCRDs together with the other components are designed to provide: electric-motor-driven positioning for normal insertion and withdrawal of the control rods; hydraulic-powered rapid control rod insertion (scram) in response to manual or automatic signals from the Reactor Protection System (RPS); electric-motor-driven "Run-Ins" of some or all of the control rods as a path to rod insertion for reducing the reactor power by a sizable amount.
24 Rod Control System - Simulator For the BWR Simulator, there are approximately 208 FMCRDs in total, they are positioned and calibrated with reactivity worth of -100 mk when all of them are 100% in core, and +70 mk when all of them are 100 % out of core; 0 mk when they are ~ 41 % in core. The rods are grouped in 8 banks, so each bank of rods have mk when fully out of core; and mk when fully in core. The FMCRDs will be fully inserted into the core in the event of a reactor scram. In such case, the fast insertion speed is typically 3 sec. for 100 % insertion.
25 Rod Control System - Simulator The full speed travel time for the rod movement during power maneuvering is typically 60 sec., or considering for the total FMCRDs in Auto mode, where all the rods move together, the reactivity change rate is ~ 2.8 mk per sec. Considering moving the banks of rods individually under Manual Mode, then the reactivity change rate for each bank under manual mode control is ~ 0.36 mk per sec.
26 Reactor Power Control
27 Reactor Pressure Control
28 Reactor Water Level Control The flow of feedwater is automatically controlled to maintain the specified water level by a "three elements" control scheme: steam flow, feedwater flow, water level. The valve opening of the feedwater control valve provided at the outlet of the feedwater pumps is regulated by the control signal as result of this "three-element" control scheme.
29 Turbine Control The turbine control employs an electrohydraulic control system (EHC) to control the turbine valves. Under normal operation, the Reactor Pressure Control (RPC) unit keeps the inlet pressure of the turbine constant, by adjusting the opening of the turbine speeder gear which controls the opening of the turbine governor valve opening. Should the generator speed increase due to sudden load rejection of the generator, the speed control unit of the EHC has a priority to close the turbine governor valve over the Reactor Pressure Control (RPC) unit.
30 Power/Flow Map The Power Flow Map is a representation of reactor power vs. Recirculation flow. The horizontal axis is the core flow in % of full power flow. The vertical axis is reactor neutron power in % full power. Any operation path that changes the power and the flow from one condition to another condition through control rod maneuver and/or recirculation flow change can be traced on this map.

31
32 Power/Flow Map Under normal plant start-up, load maneuvering, and shutdown, the operation path through REGION IV is recommended. In fact, the line which borders between Region I & IV, Region III & IV, the Blue region and Region IV is the maximum power-flow path to be followed for power increase and decreases and usually operation of the plant is below this maximum power-flow line.
33 Power /Flow Map Limits are imposed to prevent operation in certain areas of the Power - Flow Map to maintain core thermal limits and to avoid operation above licensed power level - there are three measures to prevent that: Control Rods Withdrawal Blocked (if > 105% ) ; Control Rods Run-in (if > 110%); Scram ( if > 113%).
34 Reactor Regulating System - Simulator Power Error = Actual Power - Demanded Power If current power < 65 %, control rods moves in (+ve error) or out (-ve error) until power error = 0. If current power > 65 %. The new incremental demanded power setpoint signal is sent to the flow rate scheduler (flow = f (power)) which will provide a flow rate setpoint to the flow controller. If the flow rate increase/decrease cannot provide enough reactivity change causing sufficient reactor power increase/decrease so that the power error is less than a pre-determined dead-band, the rods movement will become necessary at that time so that the power error is within limits.

35
36 Basic BWR Operation Plant Startup (cold start < 25 hours; hot start < 5 hours): Control Rods withdrawn to bring the reactor critical RPV heat-up & pressurization by further control rod withdrawals Initial power increase by continued rod withdrawals to a level where main turbine is synchronized Continued power increase using the control rod motion until the automatic flow control range is reached ~ 65 % FP. Reactor power is increased by increasing recirculation flow rate (65% % FP). Always operates in Turbine-Follow-Reactor Mode
37 Basic BWR Operation (cont d) Plant Shutdown: follow the reverse sequence of plant startup Reactor Shutdown Cooling - cool-down and decay heat removal is accomplished by bypassing steam to main condenser, and by the Residual Heat Removal System
38 BWR Load Following Capabilities Load Regulation - 65 % to 100 % FP by automatic flow control; below 65 % FP by control rods motion. Frequency control - 1 to 10 % power change by automatic flow control. Load Shedding - automatic opening of turbine bypass valves, automatic flow reduction and control rod insertion.
39 Automatic Responses to Design Basis Events Accidents Reactor Protection Containment Isolation ECCS actuation - detection of LOCA Suppression pool cooling and reactor scram on high pool temperature to mitigate inadvertent SRV opening event Other events - boron injection; feedwater flow runback, redundant actuation of scram; FMCRD run-in.
40 BWR Emergency Plant Operation RPV Control - protection against extreme conditions on reactor water level, pressure, and power. Primary Containment Control - drywell temperature, pressure, hydrogen concentration. Secondary Containment Control - wetwell water level; temperature and radioactivity. Radioactivity Release Control - offsite radioactivity release controls.
41 Answer #1 Because in BWR, boiling core has steam bubbles entrained in light water coolant, which is also a moderator. Void in coolant has negative reactivity feedback - more steam bubbles, more void, more negative reactivity. Hence at high power, increasing the recirculation flow rate will reduce void density, thus less negative reactivity.
42 Answer #2 Neutron flux distribution in BWR core is a function of void fractions in core. Since voids are abound in the upper part of the core, the moderating power is highest in the nonboiling section of the core (lower part). This causes the peak neutron flux (power density) for a boiling core to shift from the center position towards the bottom of the core. Control rods entering rom the bottom can partially correct the skewed axial flux distribution
43 Answer #2 Core Height Core Height Flux Shape Before Control Rods entry from bottom Flux Shape After Control Rods entry from bottom

44
45 ICTP Workshop - BWR Modeling - Steady State Wilson Lam (wilson@cti-simulation.com) CTI Simulation International Corp. Sponsored by IAEA
46 Boiling Reactor Mass & Heat Balance H <m i > <m i > h i Steam Separator CORE two phase mixture subcooled water saturated steam flow <m g > h g <m f > h f Recirculation water flow <m d > <m i > <m> = dm/dt = mass flow rate h = specific enthalpy feedwater flow h d Overall mass in reactor core: steam flow = feedwater flow <m g > = <m d > (1) subcooled water flow at reactor inlet = feedwater flow + recirculation flow <m i > = <m f > + <m d > or <m i > = <m f > + <m g >..(2)
47 Boiling Reactor Mass & Energy Balance The average exit quality by definition: X = <m g >/(<m g > + <m f >).(3) FW rate steam rate or X = <m d > / (<m d > + <m f >) = <m d > / <m i > = <m g > / <m i > recir water rate steam rate core flow rate Recirculation Ratio = recirculation water / steam vapor produced = <m f > / <m g > = (1 - X)/X.(5) <m i > = <m f > + <m g > = <m f > + (X /( 1 - X)) <m f > = <m f >/(1 - X).(6).(4)
48 Boiling Reactor Mass & Energy Balance Energy Balance at reactor inlet: <m i >. h i = <m f >.h f + <m d >. h d h i = (1 - X). h f + X. h d (7) or X = (h f -h i ) / (h f -h d ) Energy Balance at the core <m g >.h g + <m f >.h f = Q t + <m i >.h i Q t = <m i >. [(h f + X. h fg ) - h i ].. (8) where h fg = h g -h f or Q t = <m g > (h g -h d )..(9) Q t <m g >, h g <m f >, h f <m i >, h i
49 Exercises -BWR Modeling Derive Equation (8) & (9)
50 BWR Spreadsheet Model Given the following data: Technical Data for US version of ABWR (see BWR Simulator Manual) Technical Data for ABWR Power Flow Map (see Binder - Miscellaneous Section) Technical Data for Available Energy for condensing turbine (see BWR Simulator Manual)
51 BWR Spreadsheet Model Create an EXCEL spreadsheet (BWR) Column A s name is % FP - put in numbers 100%, 90%, 80%, 70%, 60%, 50%, 40%, 30%, 20%, 10%, 5%, 3%, 0% Column B s name is MW - first cell is MW(gross) at 100% FP (from AWBR Spec. sheet) = 1385 MW. Compute the rest of the cells in Column B using % numbers in Column A. Column C s name is KBTU/hr - to convert MW to KBTU/hr, multiply the cells in Column B by Compute all the cells in Column C using this energy conversion.
52 BWR Spreadsheet Column D s name is Steam Flow (Kg/s) - to compute steam flow for the BWR plant in column D cells - first find the available energy BTU per lb of steam from technical data chart for condensing turbine given. Note inlet steam pressure 6.8 Mpa = 1000 Psia; backpressure of Hg = 3 in backpressure; inlet steam temp 284 deg. C = 543 deg. F Multiply this number - BTU per lb of steam, by the efficiency of the turbine ~ assume 74 %, to get the actual BTU/lb for this turbine. Divide the C Column s number (KBTU/hr) by actual BTU/lb to get Klb /hr. Multiply this number by to convert Klb/hr to Kg/s To check your result, according to ABWR data spec., the 100 FP steam flow is 2122 Kg/s. You may have to adjust turb. eff.
53 BWR Spreadsheet Column E s name is Core Flow (Kg/s). Enter the first cell = (from ABWR Spec.) Column F s name is Core Flow (%) - enter the % numbers to match ABWR Power/Flow Map (given data), following the typical startup path - e.g. 100%FP % coreflow; 90 %FP - 80 % coreflow; 70 % FP - 65% coreflow,. etc. After all % numbers are entered for all cells in Column F, compute the coreflow (Kg/s) in all the remaining cells in Column E. Column G s name is Quality X - calculate X using other columns cells values. Column H s name is Recirculation Flow (Kg/s) - calculate recirculation flow using other columns cells values.
54 BWR Spreadsheet Plot a curve for the Quality X versus Power (%) Comment on the Quality values as power increases. If you are to design a reactor power control system, using Control Rods, and other means, how would you do it?
55 BWR Spreadsheet (cont d) Enter cell A23 name = Reactor Pressure; enter B23 value = 7.17 (as per ABWR spec.) Enter cell A24 name = Sat. Coolant Enthalpy hf (KJ/Kg) Enter cell B24 formula = *POWER(B23, )+415 Enter cell A25 name = Sat. Vapor Enthalpy hg (KJ/Kg) Enter cell B25 formula = *POWER((B23-9), 2) *(B23-9) Now, enter Column I s name as Reactor Thermal Power (MWt). Compute Reactor Thermal Power values in Column I, using values in cell B24 - hf; cell B25 - hg; and other column values. Use Feedwater Enthalpy at given temp = kj/kg Verify your calculation for 100 % reactor thermal power using data in the ABWR Spec.(3926 MW th )
56 Solutions: derivation of equation (8) & (9) <m g >.h g + <m f >.h f = Q t + <m i >.h i Qt = <m g >.h g + <m f >.h f -<m i >.h i = <m i >[(<m g >/<m i >).h g + (<m f >/<m i >).h f -h i ] = <m i >[X. h g + (1-X). h f -h i ] (using equation (4) & (6)) = <mi>[h f + X. (h g -h f ) - h i ], hence equation (8) Qt = <m g >.h g + <m f >.h f -<m i >.h i = <m g >.h g + <m f >. h f -<m f >.h f -<m d >. h d (using (7)) = <m g > (h g -h d ), hence equation (9)
 CTI Simulation International Corp. www.cti-simulation.")
57 ICTP Workshop - BWR Modeling - Dynamic Wilson Lam (wilson@cti-simulation.com) CTI Simulation International Corp. Sponsored by IAEA
58 Reactor Power Control Control Rod Position In core Other Reactivity Effects Coolant Temperature Reactivity Doppler Reactivity BWR Modeling Diagram Upper Core Plenum Pressure Dome Pressure Reactor Pressure Control Control Rod Reactivity Neutron Flux Fuel Rod Thermal Output Core Steam Flow Rate Turbine Generator Condenser Reactor Protection System Void Reactivity Void Volume Core Enthalpy & Quality Recirculation Flow Recirculation Flow Control Core Flow Core Inlet Enthalpy Downcomer Flow & Inlet Enthalpy Feedwater Flow & Enthalpy Feedwater Heaters Reactor Water Level Control
59 Reactor Power Control Control Rod Position In core Other Reactivity Effects Coolant Temperature Reactivity Doppler Reactivity BWR Modeling Diagram Upper Core Plenum Pressure Dome Pressure Reactor Pressure Control Control Rod Reactivity Neutron Flux Fuel Rod Thermal Output Core Steam Flow Rate Turbine Generator Condenser Reactor Protection System Void Reactivity Void Volume Core Enthalpy & Quality Recirculation Flow Recirculation Flow Control Core Flow Core Inlet Enthalpy Downcomer Flow & Inlet Enthalpy Feedwater Flow & Enthalpy Feedwater Heaters Reactor Water Level Control
60 Reactor Power Control Control Rod Position In core Other Reactivity Effects Coolant Temperature Reactivity Doppler Reactivity BWR Modeling Diagram Upper Core Plenum Pressure Dome Pressure Reactor Pressure Control Control Rod Reactivity Neutron Flux Fuel Rod Thermal Output Core Steam Flow Rate Turbine Generator Condenser Reactor Protection System Void Reactivity Void Volume Core Enthalpy & Quality Recirculation Flow Recirculation Flow Control Core Flow Core Inlet Enthalpy Downcomer Flow & Inlet Enthalpy Feedwater Flow & Enthalpy Feedwater Heaters Reactor Water Level Control
61 where Q, n C 1 Fuel heat Transfer Lumped Parameter Technique for heat transfer from UO2 fuel rods : C 2 dt dt dt dt, = Q n T T R 1 T π 2 T R = T R = nuclear heating of fuel rod (BTU/sec.ft) (1) (2) C 1 = thermal capacity for fuel pellet (BTU/deg. F.ft) = C 2 = thermal capacity of clad (BTU/deg. F.ft) = π R 1 = resistance of UO 2 and gap (sec ft deg. F/BTU) = k 1 is UO2 thermal conductivity; h g is gap conductance T T 1 = average pellet temp (deg. F) ; T 2 =average clad temp (deg. F) T c = bulk coolant temp (deg. F) 2 c T c 2 π r 1 c p 1 ρ1 ρ 2 r2( r) c p π k + r T T r π r h g 1 1
62 Heat Transfer to Coolant Boiling Heat Transfer Characteristics Heat Flux BTU/hr ft local or nucleate boiling non-boiling B C bulk boiling D E film boiling A Temp difference (deg. F) between wall & coolant
63 Heat Transferred to Coolant A-B: non-boiling; heat transfer by single phase convection. B-C: local or nucleate boiling; heated surface temp. exceeds sat. temp by few degrees; bubbles formed; large increase in heat flux due to mixing of liquid by bubbles. C-D: bulk boiling; heated surface blanketed by unstable, irregular film in violent motion. Heat transfer by conduction and radiation - hence heat flux decreases substantially. D-E: film boiling or burnt-out. At D, film becomes stable, and heat transfer improves as the surface gets hotter. However, very high temperature reached with high heat flux in this region, usually resulting in the destruction of the fuel or sheath - BURNT-OUT BWR operates in B-C nucleate boiling region, away from C.
64 Quiz The fuel element temperature in direct cycle BWR is (lower/higher) for the SAME steam conditions in indirect cycle (e.g. PWR) - why? The direct cycle BWR can be operated at a much (higher/lower) pressure than that required to prevent boiling in the indirect cycle NPP using water as a heat transport fluid. What implications?
65 Nucleate Boiling Heat Transfer Thom s nucleate boiling heat transfer at pressures from 750 to 2000 psia: ( T T ) = w sat P ( ) 8690 e q "..(3) where T w = fuel wall temperature (deg. C) T sat = saturation temperature (deg. C) q = heat flux (MW/m2) P = pressure (Kpa)
66 Average Fuel Energy Equation dt f ρ f V f C f = P UA ( T f Tc ) (6.4-2) dt where ρ f = volume average fuel density V f = fuel volume in one zone C f = average fuel specific heat capacity T f = average fuel temperature T c = average coolant temperature P = reactor power U = overall heat transfer coefficient (Thom s nucleate boiling) A = overall heat transfer area for fuel channel
67 Average Core Coolant Energy Equation The average core coolant energy equation is given by: dho ρ cvc = Wihi Woho + X. h fg + UA( T f Tc ) (6.4-3) dt where ρ c = volume average coolant density V c = coolant volume in one zone h i = average coolant specific enthalpy at inlet of the core h o = average coolant specific enthalpy at outlet of the core A = overall heat transfer area for fuel channel U = overall heat transfer coefficient. In the non-boiling region, the Dittus-Boetler correlation for forced convection is used, which is proportional to the (coolant flow) 0.8. In the boiling region, the heat transfer coefficient correlation is derived from Thom s nucleate boiling (equation 6.4-1). T f = average fuel temperature T c = average coolant temperature W i = coolant mass flow rate at fuel channel inlet W o = coolant mass flow rate at fuel channel outlet X = quality of coolant h fg = latent heat of vaporization = hg hf
68 Boiling Core Dynamics Sat. liq. enthalpy Sat. Steam enthalpy Latent heat of vap. Sat. liq. density 2 phase core exit enthalpy Quality Void Fraction H H f = f( P) g = f( P) H fg = H g H f ρ sat = f( P ) H X core = α = Heat Generated from the core: H = H + H core fg dc H f...(4) (5).(6).(7) Q W t dc P - Dome Pressure H dc - Enthalpy of fluid at downcomer W dc - Downcomer flow..(8).(9) 1 1 X where ψ = ρ g S, S = slip ratio 1 + ( ) ψ ρ f X (10) Q = W ( H + X. H H ).(11) t dc f fg dc
69 dv Mass balance at dome: dt w Dome water level: 1 = (( 1 X). Wr Wdc+ WRH+ WFW) ρ f L d (12) = f( V ) w (13) V w = fluid vol. in dome W r = core flow W dc = downcomer flow W RH = reheater drains flow W FW = feedwater flow dh dt d Energy balance at dome: 1 = [( 1 X). Wr.( Hf Hd ) + WRH( HRH Hd ) + WFW( HFW Hd )] ρ. V f w H d = fluid enthalpy at dome after mixing with feedwater H fw = feedwater enthalpy (14) W dc = downcomer flow W RH = reheater drains flow W FW = feedwater flow Calculation of sat. steam density: d ρ dt g = dv w X. Wr Ws + ρ g. dt V V + V + V. α P = f( ρ g) D w SM r (15) Calculation of Dome Pressure:.(16) ρ g = sat. steam enthalpy W s = steam flow from dome V D = volume of dome V SM =volume of steam main V r = liq. vol. of core α = void fraction in core
70 Driving Pressure in Boiling Core In steady state, P D P DC = P D + P ELdc -P LOSSdc (17) PLOSScore P LOSSdc P ELdc P D = P r -P LOSScore -P ELr + PH P ELr PH.(18) P r P DC re-writing (18), P r = P D + P LOSScore + P ELr - PH (19) Equating (17) & (19), (P ELdc -P ELr ) + PH = (P LOSSdc + P LOSScore )..(20) P EL Note: PEL = g. Z EL.( ρdc ρr).(21) ρ dc, ρ r = mean fluid density at downcomer & core where g = KPa/(Kg/m 2 ) - conversion constant from Kg/m 2 to Kpa; Z EL = elevation (m) of dome from bottom of reactor pressure vessel (RPV). Observation : if sum of pressure losses < pressure difference due to fluid densities in core & downcomer, natural circulation can be sustained, without circulation pump. Otherwise forced circulation is required with circulation pump.
71 Recirculation Flow & Pressure Losses Applying Navier Stokes Equations of motion for an incompressible fluid, dw dt g. A = ( PH + PEL PLOSSdc PLOSScore ) gz...(22) dc c dc EL where g c = gravitational constant, 9.81 m/s 2 A dc = cross-sectional area of downcomer section (m 2 ) Pressure Losses calculation - important for reactor design Sum of frictional pressure losses in core and downcomer all computed in the flow direction. Sum of acceleration pressure losses Sum of pressure losses due to area contractions and expansions Consider all single phase & two phase flow losses in the calculations Reference: Nuclear Heat Transport - El. Wakil, ISBN
72 Flow Network for Core Hydraulics (one phase & two Phase flow)
73 Boiling Boundary Applying the following notations: H o = non-boiling height ; H B = boiling height ; H = total active height of core The height ratio Ho/H is related to the ratio of sensible heat, q s added per unit mass of incoming coolant (KJ/Kg) to the total heat q t added in the channel per unit mass of coolant channel (KJ/Kg), assuming uniform heat addition: q s H o =.. (6.5-5) q H t The ratio q s /q t can be computed using enthalpies Where q q s t = ( h f h f h + X. h fg i ) h i.(6.5-6) h f = saturated coolant enthalpy, KJ/Kg h i = coolant enthalpy at inlet of channel KJ/Kg h fg = h g - h f = latent heat of vaporization KJ/Kg
74 Model Summary Divide core into number of lumped channels Each lumped channel divided vertically into nodes (or zones) - the nodalization fineness depends on application. Each coolant channel node is assumed to have its own coolant flow, its own lumped fuel element
75 Model Summary - continued Fuel heat transfer to coolant calculations start with lowest nodes, with nodes coolant inlet temperatures derived from the core lower plenum temperatures, and with coolant flows derived from hydraulic flow network at the lower plenum
76 Model Summary - continued After obtaining the lowest node coolant outlet temperatures and average fuel temperatures, the calculations proceed to the next higher nodes, and so forth... A program check is performed in each node to see if coolant outlet enthalpy exceeds saturated coolant enthalpy at the prevailing pressure. If so, 2 phase flow techniques will be used.

77 Model Summary - continued At the core exit upper plenum, the coolant temperatures from all lumped channels are mixed by the flow turbulence to determine the average coolant mixing temperatures at the upper plenum.
78 ICTP Workshop - BWR Simulator Exercises Wilson Lam (wilson@cti-simulation.com) CTI Simulation International Corp. Sponsored by IAEA
79 BWR Simulator Familiarization BWR Simulator Manual. Practice BWR Simulator Startup, Initialization. Review BWR screens. Note the hot buttons on the screens, which bring up control pop-ups for user s interactions.

80
81 Reactor Core SYSTEM SIMULATION SCOPE DISPLAY PAGES REACTOR CORE Neutron flux levels over a range of to 110% full power, 6 delayed neutron groups Decay heat (3 groups) Reactivity feedback effects - void, xenon, fuel temperature, moderator temperature 2 phase flow & heat transfer Reactivity control rods Essential control loops - Reactor Pressure Control; Core Recirculation Flow Control; Reactor Power Regulation; Reactor Water Level Control; Turbine Load/Frequency Control Plant Overview BWR Reactivity & Setpoints BWR Power /Flow Map & Controls OPERATOR CONTROLS Reactor power and rate of change (input to control computer) Manual control of control rods Reactor scram Manual Control Rods run-in Manual control of recirculation flow rate Manual adjustment reactor control setpoint MALFUNCTIONS Increasing and decreasing core flow due to Flow Control malfunctions Inadvertent withdrawal of one bank of control rods Inadvertent insertion of one core bank of control rods Inadvertent reactor isolation of Power loss to 3 water Reactor Internal level Pumps (RIPs) Reactor bottom break
82
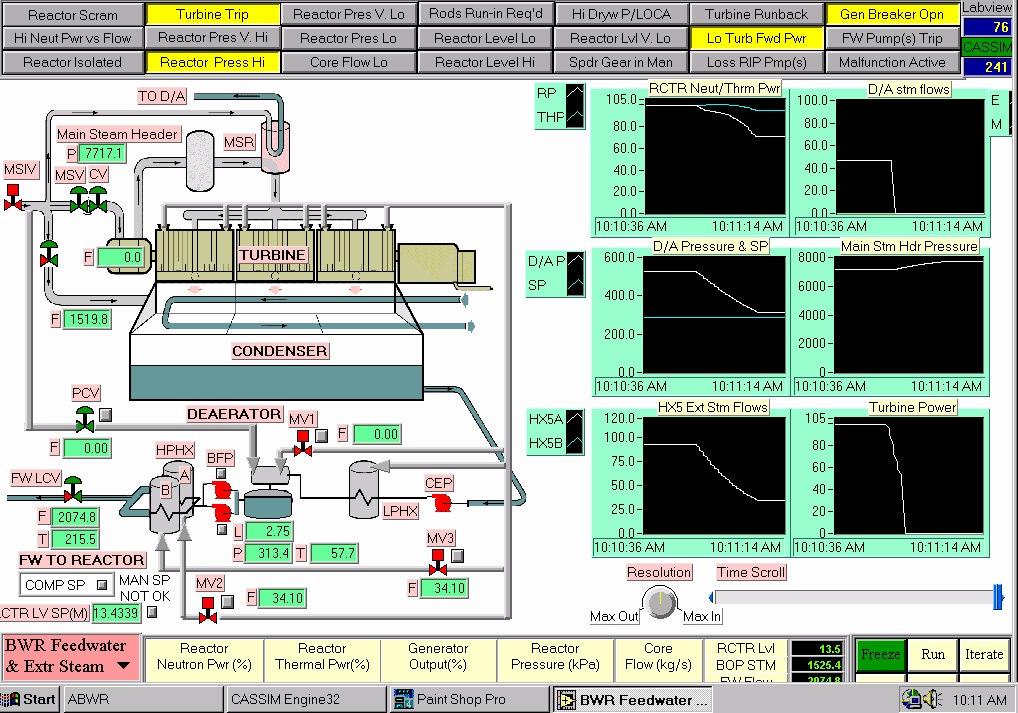
83 Steam & Feedwater SYSTEM SIMULATION SCOPE DISPLAY PAGES OPERATOR CONTROLS MALFUNCTIONS STEAM & FEED- WATER Steam supply to turbine and reheater Main Steam Isolation Valve Turbine Bypass to condenser Steam Relief Valves to Suppression Pool in containment Extraction steam to feed heating Feedwater system BWR Feedwater and Extraction Steam Reactor water level setpoint changes: computer or manual Reactor Extraction feedwater steam to feedwater heating isolating valves controls Deaerator main steam extraction pressure control Feedwater Feed pump on/off controls Loss of both feedwater pumps Loss of feedwater heating level control valve fails open Safety valves on one main steam line fail open Steam line break inside Drywell break Drywell line inside

84
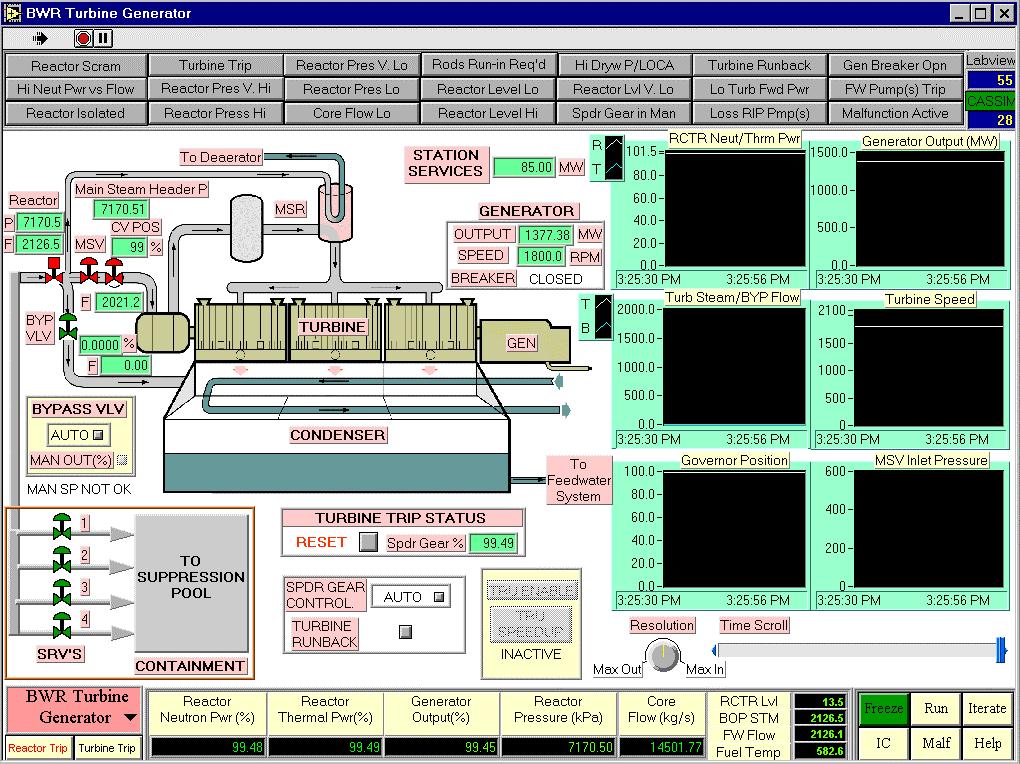
85 Turbine Generator SYSTEM SIMULATION SCOPE DISPLAY PAGES OPERATOR CONTROLS MALFUNCTIONS TURBINE- GENERAT OR Simple turbine model Mechanical power and BWR Turbinegenerator output are Generator proportional to steam flow Speeder gear and governor valve allow synchronized and nonsynchronized operation Turbine trip Turbine throttle Turbine runback pressure transmitter fails Turbine run-up low and Turbine trip with synchronization Bypass Valve Turbine failed closed Speeder Gear Increasing and control: manual decreasing steam or computer flow due to control Steam Bypass Pressure Control System failures Valve Computer or Manual Control
86
87 Overall Unit SYSTEM SIMULATION SCOPE DISPLAY PAGES OPERATOR CONTROLS MALFUNCTIONS OVERALL UNIT Fully dynamic interaction between all simulated systems Turbine-Following- Reactor maneuvering Unit annunciation Major control loops load BWR Plant Overview BWR Reactivity & Setpoints
88

89

90 Scram Causes
91 Resetting Scram
92 BWR Simulator Manual Exercise Power Reduction POWER MANEUVER: 10% Power Reduction and Return to Full Power. Record (1) Control Rods position (2) Recirculation Flow (3) Quality (4) Void reactivity feedbacks during this maneuver. Explain how reactor power is controlled during this maneuver.
93 ICTP Workshop - BWR Simulator Exercises Wilson Lam (wilson@cti-simulation.com) CTI Simulation International Corp. Sponsored by IAEA
94 BWR Simulator Manual Exercise 4.1.3, Turbine Trip Practice Turbine Trip & Recovery. Record Reactor Pressure during this transient. Does Reactor Pressure resume to the setpoint of 7170 Kpa after the transient settles down? If so, explain how reactor pressure is being controlled now. Re-initialize the Simulator. This time insert the malfunction Turbine Trip with Bypass Valves Failed Closed. Explain what happens. See 4.2.9
95 Malfunction Loss of FW Load 100 % FP IC. Open BWR Feedwater & Extraction Steam Screen Insert Malfunction Loss of FW - Both FW Pumps Trips Follow text on P.26, and answer questions.
96 Malfunction Decreasing Core Flow Follow Text on P. 29 to practice Malfunction Decreasing Core Flow due to Flow Control Failure As coolant flow decreases, core quality increases. Why? What happens to reactor power? Explain the responses of the Reactor Power Control System
97 Malfunction Exercise Decreasing Steam Flow Re-initialize the Simulator to 100% FP. Go to Power/Flow Map Screen. Insert the Malfunction Decreasing Steam Flow from Dome due to Pressure Control Function. (see P.30) What happens to Reactor Pressure? What happens to the Reactor Power? Can you explain the Reactor Power transient responses?
98 Malfunction Inadvertent Reactor Isolation Practice Malfunction Inadvertent Reactor Isolation. Follow Text on P.38 of BWR Simulator Manual. Record parameters. What happens to reactor power? What is the cause for reactor scram?
99 Malfunction Loss of FW Heating Practice Malfunction Loss of FW Heating. Follow Text on P.39 of BWR Simulator Manual. Record parameters. Explain the changes in reactor power and other BOP parameters.
100 Malfunction Steam Line Break Practice Malfunction Steam Line Break inside Drywell Follow Text on P. 42 of BWR Simulator Manual. Record parameters. Explain changes to reactor power and other BOP parameters. Explain the actions of ECC.
101 Malfunction Feedwater Line Break Practice Malfunction FW line Break inside Drywell Follow Text on P.43 of BWR Simulator Manual. Record parameters. Explain changes to reactor power and other BOP parameters. Explain the actions of ECC.