Vadose Zone Profiling to Better Understand Processes
|
|
|
- Jerome Bates
- 5 years ago
- Views:
Transcription


1 Vapor Intrusion 2010 Sept Chicago Vadose Zone Profiling to Better Understand Processes Related to Vapor Intrusion Daniel B. Carr, P.E., P.G., Laurent C. Levy, Ph.D., P.E., Allan H. Horneman, D.E.S.
2 Effect on Seasonal Variability Field Observations 100,000 More muted fluctuations near water table depth 10, Concentration n (µg/m 3 ) Soil Vapor , One half order of magnitude seasonal fluctuations in TCE concentrations in soil gas near foundation depth with highs during the summer Vapor Implant -Foundation Depth (7.5 ft bgs) Vapor Implant - Deep (32 ft bgs) Water Series2table ranges between 37 to 38 ft bgs 1 Jan-05 Jul-05 Jan-06 Jul-06 Jan-07 Jul-07 Jan-08 Jul-08 Jan-09 Jul-09 Jan-10 Jul-10

")


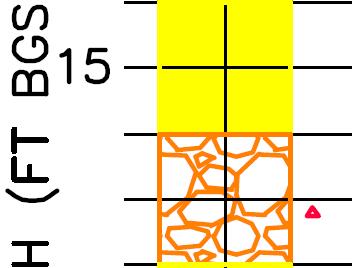
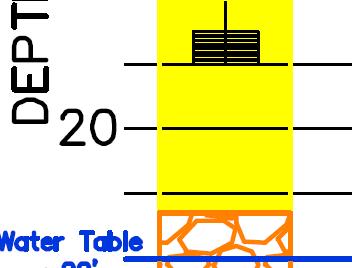
3 PCE and TCE in Soil (μg/kg) Example of Vadose Zone Profiling VOC mass sorbed onto soil as a result of historical vapor transport from groundwater Wet soils likely control the magnitude of diffusive flux of across this profile
4 Phase Partitioning in the Vadose Zone Assume 1 m 3 (1700 kg dry weight) of vadose zone soil with a TCE concentration of fc[ [µg/m 3 ]i in the vapor phase TCE Mass in Sorbed bd Phase ~ 0.64 C TCE Mass in Vapor [in μg] = 0.35 x (1 0.3) x C x 1m 3 ~ 0.25 C Moisture saturation of 30% TCE Mass in Aqueous Phase ~ 0.26 C TCE Mass in Sorbed Phase ~ 0.64 C Moisture saturation of 60% TCE Mass in Vapor ~ 0.14 C TCE Mass in Aqueous Phase ~ 0.53 C
5 Illustration of Vapor Transport in the Vadose Zone Using SESOIL SESOIL is a one dimensional model used to simulate vertical transport in the unsaturated soil zone SESOIL Combines: Vadose Zone (up to 4 x10 layers) Hydrologic Cycle precipitation, evapotranspiration, change in moisture storage Contaminant Fate Cycle advection, diffusion, sorption Precipitation Evapotranspiration Runoff Ground Surface Vapor-Phase Diffusion Moisture Infiltration Aqueous-Phase Advection Sorption/ Desorption Moisture Storage Groundwater Recharge Volatilization Water Table Groundwater Contamination
6 An Example of SESOIL Simulation Problem formulation: 1. Consider a vapor intrusion site with historical groundwater sourcing PCE Mass Sorbed from Vapor Transport 2. At t = 0, sourcing from groundwater is eliminated or substantially cleaned up Vapor Intrusion Potential 3. How long does it take for PCE mass in the vadose zone to go away? Clean(ed) GW Vapor Transport
7 Initial PCE Concentration (mg/kg) Climate Properties 15m m Upper Layer 1 Northeastern U.S m (37 in.) of precipitation per year Vadose Zone 5 m Thick 1.5 m 1.5 m 0.15 m 0.15 m Layer 2 Layer 3 De epth (m) Contaminant Prop. PCE H ~ 0.8 K oc ~ 100 L/kg D a ~ 7 x 10⁻⁶ m 2 /s Soil Properties n~ m 0.05 m Lower Layer 10 m 2 5 Equivalent to about 400 μg/l in groundwater f oc ~05% 0.5% 1 - Sand k ~ 10-8 cm Silt k ~ 10-9 cm 2
8 Model Predicted Soil Vapor Concentration Profile Sand 1.E 01 1.E+00 1.E+01 1.E+02 1.E+03 1.E+04 1.E+05 1.E+06 0 PCE Vapor Concentration (μg/m 3 ) Upward Diffusion and Volatilization Depth (m m) Year 1 Year 2 Year 3 PCE concentrations in vapor decrease by about 2 orders of magnitude every 5 years 4.5 Year 5 Year 10 Advection to GW 5
9 Model Predicted Soil Vapor Concentration Profile Sand vs. Silt 1.E 01 1.E+00 1.E+01 1.E+02 1.E+03 1.E+04 1.E+05 1.E+06 0 PCE Vapor Concentration (μg/m 3 ) Depth (m m) SAND SILT CLAY Year 1 Year 2 Year 3 Year 5 Year 10
10 PCE Concentration as a Function of Time Prediction for Sand n (μg/m 3 ) PCE Vapor Concentratio 1E 1.E+06 1.E+05 1.E+04 1.E+03 1.E+02 1.E+01 1.E+00 1E01 1.E 01 Hypothetical Soil Gas Screening Threshold for PCE Near Ground Surface (0 m) Near Foundation Depth (2.5 m) Near Water Table (5m) Year
11 PCE Concentration as a Function of Time Sand vs. Silt 1E 1.E+06 1.E+05 n (μg/m 3 ) 1.E+04 PCE Vapor Concentratio 1.E+03 1.E+02 1.E+01 SAND SAND Near Ground Surface (0 m) CLAY SILT 1.E+00 Near Foundation Depth (2.5 m) 1E01 1.E 01 Near Water Table (5 m) Year
12 It s not the concentration but the flux that matters 2 PCE Mas s Flux (μg/m /day) 1E 1.E+04 1.E+03 1.E+02 1.E+01 1.E+00 1.E 01 1.E to 1000 μg/m 2 /day Estimated range of diffusion flux that could drive PCE at indoor air concentrations observed in USEPA VI database (residential) Upward Diffusion Flux Near Foundation Depth (2.5 m) Downward Flux to Groundwater at Water Table (5 m) Moisture cycling effect 1.E Year
13 PCE Mass Flux Sand vs. Silt 1E 1.E+04 1.E+03 2 /day) 1.E+02 s Flux (μg/m PCE Mas 1.E+01 1.E+00 1.E 01 Initial PCE mass in SAND: 90% volatilized (upward diffusion) 10% infiltration to the water table (downward advection) SAND SILT In SILT the opposite Upward Diffusion Flux Near Foundation Depth (2.5 m) 1.E 02 1.E 03 Downward Flux to Groundwater at Water Table (5 m) Year
 VOC mass in soil moisture and sorbed onto the soil solids")

14 Recap Vapor transport and vapor concentrations in the vadose zone can be influenced by moisture cycling and mass transfer between phases (soil solids, moisture or air filled porosity) VOC mass in soil moisture and sorbed onto the soil solids can substantially contribute to vapor intrusion potential The common perception that VI potential is largely a function of contemporaneous groundwater quality is flawed Although we are often focused on concentration, it is the flux that matters.