Hydrologic Indicators
|
|
|
- Shauna Webster
- 5 years ago
- Views:
Transcription


1 Hydrologic Indicators Courtney M. Stevens Regulatory Specialist Coastal Branch December 8, 2011 US Army Corps of Engineers
2 HYDROLOGY
3 Some Factors that Influence the Wetness of a Site Climate Landscape / geomorphic setting Stratigraphy Soil texture and drainage Plant cover Normal rainfall


4 A2 High water table A1 Surface water Water table is 12 inches or less from the surface


5 A3 Saturation Wetland Hydrology Indicators Condition in which all pores between soil particles are temporarily or permanently filled with water. Indicated by water glistening on ped faces and interiors within 12 inches of the surface


6 B1 Water marks

7 B2 Sediment deposits Thin coatings of silt or organic material


8 B3 Drift deposits Rafted debris or litter

9 B4 Algal mat or crust


10 B5 Iron deposits Reduced iron emerges with groundwater and oxidizes on the surface

 B7 Inundation")
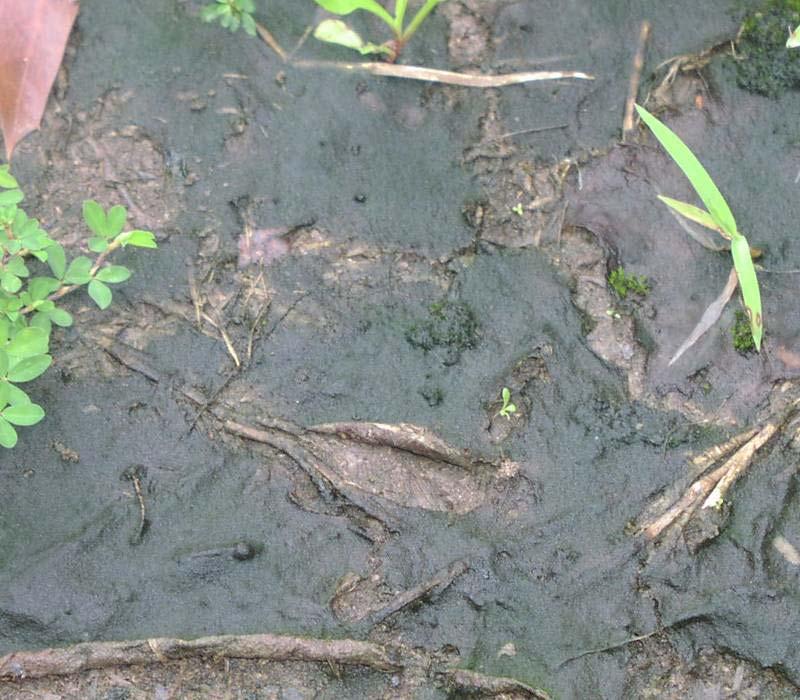
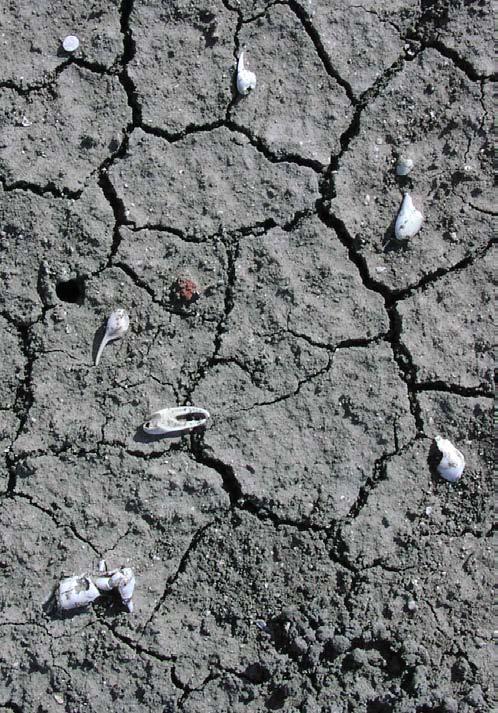
11 B6 Surface soil cracks Does not include deep cracks in clay soils (e.g., Vertisols) B7 Inundation visible on aerial imagery

12 B8 Sparsely vegetated concave surface <5% ground cover A woody overstory may or may not be present
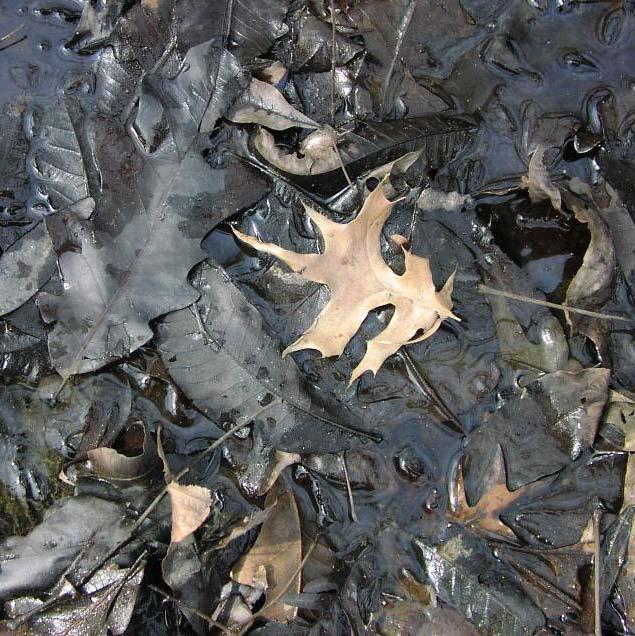
13 B9 Water-stained leaves


14 B10 Drainage patterns Wetland Hydrology Indicators

15 B13 Aquatic invertebrates (or fauna)


16 B15 Marl deposits B16 Moss trim lines


17 C1 Hydrogen sulfide odor Wetland Hydrology Indicators Rotten egg odor Observed within 12 inches of the surface Also indicates hydric soil

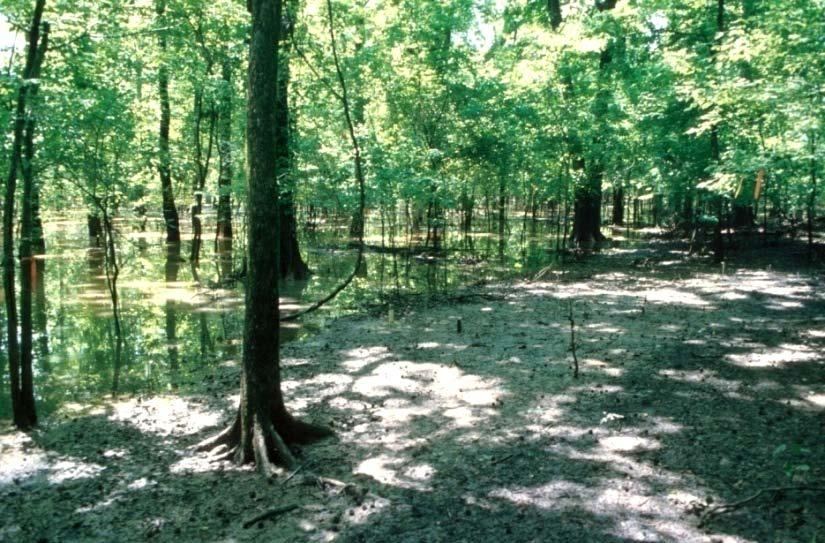
18 C2 Dry-season water table Water table is inches from the surface Observed during the dry season or in a dry year


19 C3 Oxidized rhizospheres along living roots Result of oxygen leakage in anoxic soils Within 12 inches of the surface Occupy 2% or more of the layer s volume

20 C4 Presence of reduced iron Ferrous iron test or color change upon exposure to air Within 12 inches of the surface


21 C6 Recent iron reduction in tilled soils C8 Crayfish burrows
22 C7- Thin Muck Surface

23 C9 Saturation visible on aerial imagery Signatures must correspond to field-verified hydric soils, depressions or drainage patterns, or other evidence of a seasonal high water table

24 D2 Geomorphic position Examples: Localized depression Drainageway Concave position on a floodplain Toe of slope Fringe of water body Discharge zone (seep)

25 D3 Shallow aquitard Capable of perching water within 12 inches of the surface Examples: Permafrost Dense glacial till Clay layer Bedrock

26 D5 FAC-neutral test (OBL + FACW) > (FACU + UPL) List the dominant species across all strata Drop any species that is FAC, FAC-, or FAC+ More than 50% of the remaining dominants must be OBL and/or FACW

27 D8- Sphagnum moss
28 The Problem Lack of an indicator does not necessarily mean that wetland hydrology is absent Additional information may be needed to determine if wetland hydrology is present when indicators appear to be absent Problem areas: Wetlands in which indicators of one or more parameters may periodically be lacking due to normal seasonal or annual variability.
29 DON T FORGET! - Use the remarks section! - Tell us about any recorded data (wells, photos, site visits, history) - Ditches
30 Evaluating Normal Rainfall
31 30 Year Range of Normal for area in question:
 http://www.georgiaweather.")
32 Georgia Rainfall Data (for use with WETS Tables)

33 Change the dates to look at the past 12 months of rainfall data. Total precipitation for the past 12 months: Our 30 year range of normal is: The sum for the past 12 months is: Therefore: = We are 4.19 below the range of normal for BUILDING the past STRONG 12 months.