Models Can Support Establishment of Phosphorus Loading Targets for Lake Erie
|
|
|
- Annice Floyd
- 5 years ago
- Views:
Transcription
1 Ohio Lake Erie Phosphorus Task Force January 9, 2013 Columbus, OH Models Can Support Establishment of Phosphorus Loading Targets for Lake Erie J.V. DePinto LimnoTech, Ann Arbor, MI Don Scavia University of Michigan
2 Contributors Don Scavia, University of Michigan Dan Rucinski, LimnoTech, University of Michigan Todd Redder, LimnoTech Ed Verhamme, LimnoTech Richard Stumpf, NOAA NOS Pete Richards, Heidelberg University Tom Bridgeman, University of Toledo Anna Michalak, Stanford University
3 Outline of Presentation Review some basic concepts Algal-available phosphorus and water column cycling Internal phosphorus loading (sediment feedback) Hypoxia modeling EcoFore SOD response to P load changes 1D Central Basin model results Cyanobacteria blooms in Western Basin comparison NOAA NOS relationship WLEEM LimnoTech process model

4 Algal-availability and water column recycling
5 Water Column Cycling of Phosphorus
6 Assessing Availability of Particulate Phosphorus in Great Lakes Tributaries
7 Algal Uptake in DCDA Corresponds to Decrease in NaOH-extractable P
8 R-NaOH-P is good surrogate for ultimately available particulate phosphorus in tributaries
9 Research Led to Modification of DiToro Lake Erie Model Must treat P release from tributary solids differently from P release from in-lake produced solids (i.e., algae)
10 Tested Three Versions of Lake Erie Model
11 Importance of P Release from Particulates in the Water Column
12 Halving SRP Load Gives Bigger Response than Halving EUP Load
13 Internal loading of phosphorus from sediments
14 Pathways of Internal Sediment Load Sediment resuspension of particulate phosphorus Driven by wind-wave bottom shear stress Amount of algal available phosphorus from this process depends on relative rate of release from resuspended sediments and rate of redeposition of resuspended sediments Significant in shallow areas of Western Basin Pore diffusive flux of dissolved phosphorus Rate governed by gradient of dissolved phosphorus in surface sediments and diagenetic processes controlling that gradient Significant in hypoxic areas of Central Basin
15 Understanding of Sediment-Water Phosphorus Diffusive Flux Processes Water Column Aerobic Layer Thickness Governs ability of DRP to diffuse from sediments Depends on Overlying Water DO Deposition of particulate organic P (POP) Deposition of particulate inorganic PO4 Flux of dissolved PO4 Aerobic Layer Anaerobic Layer Fe +3 Fe +2 SO 4-2 S -2 Particulate organic P Diagenesis Particulate PO4 Sorption / desorption Dissolved PO cm Sediment Bed
16 Overlying Water DO < 2 mg/l Causes Significant P Flux (DiToro, 2001)
17 Lake Erie Model Post-audit with updated sediment diagenesis model (Fitzpatrick, 2004


18 Sediment P Flux analysis (using 1D DO model) Computed from area with overlying water DO< 2 mg/l * number of days with DO< 2 mg/l * 5 mg P/m^2-d Sediment P flux (metric tonnes/year) Estimated Sediment PO4 Flux in Central Basin 3.5E E E E E E E E Year
19 EcoFore Hypoxia Modeling
20 Ecosystem Forecasting of Lake Erie Hypoxia NOAA-CSCOR funded project to assess the Causes, Consequences, and Potential Remedies of Lake Erie Hypoxia? Linked set of models to forecast: changes in nutrient loads to Lake Erie responses of central basin hypoxia to multiple stressors P loads, hydrometeorology, dreissenids potential ecological responses to changes in hypoxia Approach Build models capable of identifying non-point and/or point-source actions to achieve X load reduction Build models capable of identifying X load reduction required to achieve Y hypoxia characteristics Build models relating fishery goals to Y hypoxia characteristics, based on fishery manager input.

21 EcoFore Research Team Plus many grad students and postdocs. Plus many more that have come and gone!
22 Drivers of Hypoxia in Central Basin Thickness of Central Basin Bottom Layer Air temperature, winds, length of season Organic Matter Flux to the Bottom Algal production and settling Algal-available P supply Length of season Sediment Oxygen Demand - contributes an average of 60% of hypolimnetic oxygen demand
23 Simple 1D DO Model for Central Basin 1D Vertical Dynamic Model for Central Basin Hydrodynamic model is physically driven Air temp, wind speed, solar radiation Static Surface Level, varying thermocline depth 48 Vertical Layers of 0.5m thickness Simple Dissolved Oxygen Model linked to Hydrodynamic Model DO rate term (WCOD) is aggregate of production and consumption processes in the water column SOD in bottom layer Diffusion WCOD SOD Epilimnion Hypolimnion
24 Time-Series of Annual Calibrated WCOD Values
25 Suggested that P load is important for Central Basin oxygen depletion rate SRP Load O 2 depletion rate Rucinski et al 2010
26 Eutrophication Model Projects 1D models Level 1-1D hydrodynamics with specified DO consumption rates Vertical thermal and mixing profiles from hydrodynamic model Calibrate with DO loss from water column and sediment demand Level 2-1D hydrodynamics with simple process WQ model Replace DO loss, etc. with Standard eutrophication model 3D models Level 3-3D hydrodynamics with simple Level 2 WQ model Physics from full hydrodynamic model Level 4-3D hydrodynamics with complex WQ model Multi-class phyto-zoo, organic/inorganic nutrients, sediment digenesis, etc Dreissenid; Benthic algae
27 Eutrophication Model Atmosphere reaeration Unavailable Phosphorus mineralization respiration Dissolved Oxygen photosyn. Basin Loading Available Phosphorus uptake Phytoplankton grazing Zooplankton Detrital Carbon death death settling settling settling Sediment Oxygen Demand Sediments D. Rucinski
28 Borsuk et al. (2000) Ecological Modeling Borsuk et al. Calibrated Function SOD (go2/m2/d) Deposited Organic Carbon
29 SOD Response to TP Load Michaelis Menten function SOD (go2/m2/d) Annual TP Load
30 Dissolved Oxygen (mg/l) Hypolimnetic Dissolved Oxygen Model Calibration Dissolved Oxygen (mg/l) Rucinski et al.
31 Central Basin Hypoxic Days as function of TP Load y = x R² = Hypoxic Days Annual TP Load (MT) Hypoxic days = number of days with hypolimnetic DO < 2 mg/l

 45-60 30-45 15-30 0-15")
32 How do you get from 1D Oxygen Concentration to Hypoxia Area? Eastern Western Central Depth (m)

33 Geostatistical Conditional Realizations of Central Basin Hypoxic Area Zhou and Michalak.
34 Central Basin Hypoxic Area as function of TP Load 8000 Hypoxic Area (km 2 ) y = x R² = Annual TP Load (MT) Hypoxic area determined using the Zhou concentration-to-area conversion
35 Cyanobacteria Blooms in Western Basin contrast Load response Models
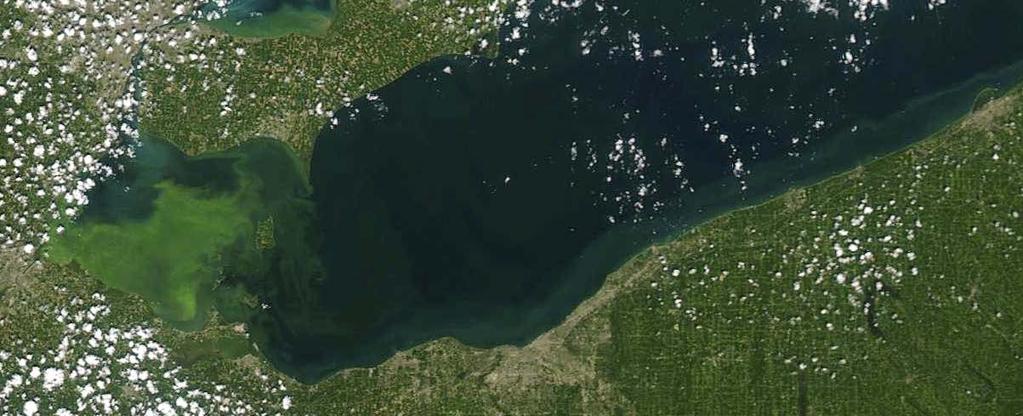


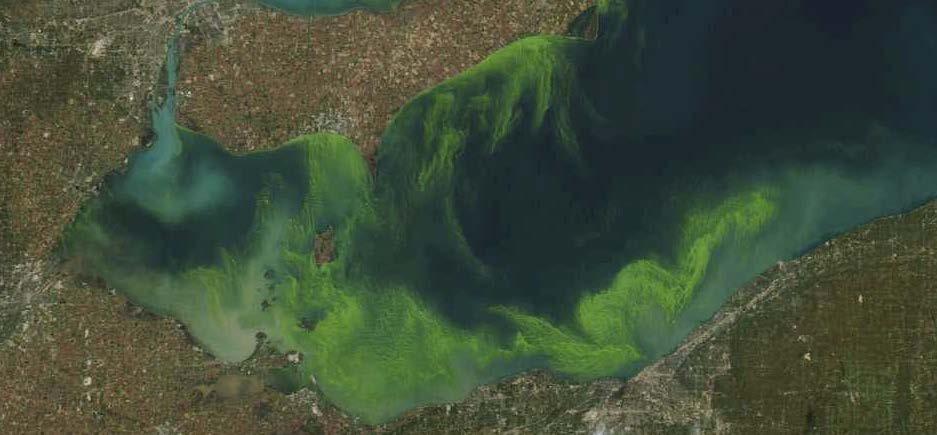
36 Microcystis Bloom of 2011 August 11, 2011 September 3, 2011 MODIS images October 7, 2011

37 Maumee phosphorus load fueled Several large events from March May, followed by very low flows for rest of the summer. Very little Detroit River dilution; main plume moved to Central Basin north of Pelee Island bloom Note apparent diluting effect of Detroit River Flow-weighted SRP concentration 85 ug/l
38 Maumee River Discharge 120 billion cu ft difference or 3.4 km 3 (Western Basin volume = 22 Km 3 ) Data obtain from USGS gage at Waterville, OH
39 Maumee River TP Load water year averages: annual load = 2437 mt/yr FWMC = 402 ug/l 2,000 MT difference (equivalent to ~30% of total TP load to entire WBLE for most years in this decade) Data obtain from Heidelberg College
40 Maumee River SRP Load water year averages: annual load = 566 mt/yr FWMC = 93 ug/l 400 MT difference equivalent to ~ 1 yr of Detroit WWTP effluent) Data obtain from Heidelberg College
41 March-June at Waterville Discharge Total Phosphorus Dissolved Reactive P Million Cubic Meters % Metric Tons % Metric Tons % From Richards, Heidelberg University data
")
")
42 08/30/2012 (DOY=243) 09/03/2011 (DOY=246)
43 Can We Set Load Targets for Microcystis blooms?
44 Cyanobacteria-bloom Intensity (CI) as a function of June TP load and Spring discharge wet Mar-May TP for June Spring Q dry Mar-May Stumpf et al., 2012 PLoSONE.
45 Spring (Mar-Jun) explains annual bloom intensity; a lag between P supply and the bloom Pre-MERIS bloom size inferred (either present at 2003 level or absent) Proposed model results Error : 0.37 CI (105 sq km) observed Modeled Model failure Ice free Stumpf et al., 2012PLoSONE. Ice free
 Proposed model results Error : 0.37 CI (105 sq km) observed Modeled Model failure 2012 prediction Ice free Stumpf et al., 2012PLoSONE.")
46 Spring (Mar-Jun) explains annual bloom intensity; a lag between P supply and the bloom Pre-MERIS bloom size inferred (either present at 2003 level or absent) Proposed model results Error : 0.37 CI (105 sq km) observed Modeled Model failure 2012 prediction Ice free Stumpf et al., 2012PLoSONE. Ice free
47 Bridgeman seeing similar relationship with his data Relationship of Microcystis biovolume to P loading Annual biovolume related to TP loadings during spring and early summer Biweekly biovolumes related to DRP loadings 4-8 weeks prior
 NSF (subcontract to University of Michigan) Great Lakes Protection Fund (sub")
48 Western Lake Erie Ecosystem Model (WLEEM) Development and Application Funded by: USACE-Buffalo District (3 projects) NSF (subcontract to University of Michigan) Great Lakes Protection Fund (sub to TNC)
 sources: Sediment sedimentation and turbidity Nutrients nuisance & harmful algal blooms Support Management and Research in WLEB: Link with Maumee watershed")

49 Western Lake Erie Ecosystem Model (WLEEM) Objectives Model ecological response of Western Basin of Lake Erie to external (Maumee Watershed) and internal (wind-driven resuspension) sources: Sediment sedimentation and turbidity Nutrients nuisance & harmful algal blooms Support Management and Research in WLEB: Link with Maumee watershed model to quantify response to current sediment and nutrient loads and to specific changes in watershed land use and management actions (e.g., BMPs) Simulate in-lake responses to climate change driven extreme event scenarios Support the quantification and analysis of GLRI metrics for sedimentation and harmful algal blooms in the Maumee River/Bay and Western Basin
 Water Quality Linkage Flows Suspended solids")
50 Western Lake Erie Ecosystem Model (WLEEM) Framework Simulating Waves Nearshore (SWAN) Wind-Wave Sub-Model Hydrodynamics Water level Current velocity Wind-Waves Significant height Direction Frequency EFDC Model Hydrodynamic Sub-Model Shear Stress Current velocity Sediment Transport Sub-Model Nutrient & Eutrophication Sub-Model (A2EM) Water Quality Linkage Flows Suspended solids Settling/resuspension rates


51 Phosphorus Cycling in WLEEM Solar Radiation External P Loads (SRP, PIP, POP) Decay and Mineralization - release of PO 4 Uptake of PO 4 Lyngbya, Other Benthic Algae Phytoplankton Phytoplankton Settling Release of PO 4 Grazing Filtering Release of PO 4 Zooplankton Fecal Pellet Settling Predation Detrital P Settling Upper Trophic Levels Resuspension Exchange with Offshore Diffusive Exchange Feces/Pseudofeces Deposition

52 Suspended Solids Animation (beginning 5/12/2004) Maumee Flow: 28,200 cfs Data provided by: Pete Richards and Dave Baker, Heidelberg University Tom Bridgeman, University of Toledo

53 TP and DRP Animations (comparison of 2011 and 2012)

54 Baseline (calibration) run of TP spatial distribution on July 12, 2004
55 Same model run with 40% reduction in Maumee River TP load (July 12, 2004)
56 Monthly Average TP and Chlorophyll- August % Reduction of Maumee River Baseline 40% Reduction of Detroit River River Bay Western Basin
57 Linked Watershed-WLEEM Allows Connection between actions in Maumee watershed and In-lake Response Combination BMP (cover crops + 3-meter filter strips)
58 Same scenarios related to spring P loading from Maumee Combination BMP (cover crops + 3-meter filter strips)

59