Water Supply Effects Modeling: San Joaquin Tributary Streamflow Requirements
|
|
|
- Lizbeth Sharp
- 5 years ago
- Views:
Transcription

1 Water Supply Effects Modeling: San Joaquin Tributary Streamflow Requirements Will Anderson State Water Resources Control Board Division of Water Rights April 12, 2016
2 Overview Regulatory background and setting Unimpaired flow concept System characterization (San Joaquin tribs) Irrigation District water balance CALSIM, Water Supply Effects Model Results HEC-5Q Temperature Model and Results
3 Delta Reform Act, 2009 Water Code (c) (1) For the purpose of informing planning decisions for the Delta Plan and the Bay Delta Conservation Plan, the board shall, pursuant to its public trust obligations, develop new flow criteria for the Delta ecosystem necessary to protect public trust resources... The flow criteria for the Delta ecosystem shall include the volume, quality, and timing of water necessary for the Delta ecosystem under different conditions.
4 Bay-Delta Planning Process Phase 1: San Joaquin River flow and southern Delta salinity Phase 2: Delta outflow and Sacramento River flows Phase 3: Water Rights implementation (of phases 1 and 2) Phase 4: Instream flows for other Delta tributaries Related Processes: Water Quality Certifications: FERC relicensing of Hydroelectric Projects on Merced and Tuolumne Rivers 4
5 San Joaquin Flow Proposal Intended to reasonably protect fish Specific numeric objectives Narrative standard to provide the flow conditions necessary to support the native fisheries in the Lower San Joaquin River and its salmon-bearing tributaries Minimum percentage of unimpaired flow is during the critical juvenile salmon out-migration period of February-June Provides flexibility to modify both timing and % 5
6 Why Percent of Unimpaired Flow? An index quantity, and fraction or share Allocate between public trust and other uses An environmental-use bank account that can be shaped to provide functionally-useful flows Current Vernalis objective is also based on unimpaired flow (for water year classification) but is stepwise and more complicated 6
7 Average Flow (cfs) Unimpaired Flow Concept San Joaquin River Near Vernalis Flow Water Year 2003 (Below Normal) 30,000 25,000 20,000 15,000 10,000 5,000 0 Oct Nov Dec Jan Feb Mar Apr May Jun Jul Aug Sep 7
8
9 New Melones Res. New Don Pedro Res. Lake McClure/ New Exchequer Dam
10

11
12 Existing Flow Requirements (Baseline) Vernalis (D-1641/VAMP) Goodwin (BiOp RPA) La Grange (FERC) Schaffer Bridge (FERC/Cowell/Davis-Grunsky)

13 Stanislaus Historical Streamflows

14 Tuolumne Historical Streamflows

15 Merced Historical Streamflows
16 Proposed Flow Requirements (Percent of Unimpaired Flow Feb-Jun) % % %
17 Irrigation District Characterization
18 South San Joaquin ID Oakdale ID Modesto ID Turlock ID Merced ID
19
20 AWMP Irrigated Acreage by District 140, ,000 Total Acres in Crops 100,000 80,000 60,000 40,000 20,000 0 SSJID OID MoID TID MeID
21 Irrigation District water budgets 21

22 Irrigation District Water Balance Deep Percolation AW Field Applied Water
23 How Do We Model System?
24 CALSIM SAN JOAQUIN RIVER SCHEMATIC Stanislaus I10 Tuolumne I81 Merced I20 River River River Lake New Melones New Don Pedro McClure 10 Reservoir 81 Reservoir 20 (New Exchequer) C10 C81 I76 C20 76 Tulloch 509 D520A1 I I520 C D520A D540A D540B 572 D572 Goodwin C540 D79_SEEP Crocker C561 D Woodward 75 D520B 78 D78_SEEP 79 Huffman C570 C75 D520C D78_M I GP A 570 D75_SEEP D78 D78A D GP530 78A D79 D562A 521 C530 D530_VAM P R550A R564A D570 D521 GP532 C C520 R532 D571 GP522 C532 I564 R564B 522 GP548 R573 C522 D531 R545B 533 R550B R528A R534B D I545 C548 Cressey C564 D523 GP534 R534A R545C 549 R526 R528B R528C R545A I566 D R636C D620C C A I A M odesto D545 D549 R566 GP Ripon D528 D528A R637A C534 D545A 574 GP C528 C545 R630J C550 C566 D574 R637C D535 R630L 551 R636B D630A D620A R620 I637 R637B R636A D551 I620 San Joaquin River Vernalis R630K Newman C637 C636 C630 C620 from Mud/Salt Slough C639 C614 M aze D630B D637 I636 D620B D639 R639 D620Accr R637D R630M C619 R630West Westside and Mendota Pool
25 Stockton East WD South San Joaquin ID Central San Joaquin WD % Oakdale ID Modesto ID % Turlock ID Cowell/Riparian % Merced ID
26 CALSIM II San Joaquin River Basin DWR and USBR Versions An operations mass-balance model 82 years of monthly record: Water years Inflow boundaries to each Reservoir Diversion demands, Allocations, Return Flows Local hydrology inflows +/-
27 SWRCB-CALSIM Baseline SWRCB application of CALSIM Baseline Includes Vernalis Adaptive Management Program (VAMP) criteria D-1641 Requirements at Vernalis (flow/salinity) FERC/RPA requirements at diversion dams Includes ~LOD 2005 demand estimates for IDs
28 WSE = Water Supply Effects Model Excel spreadsheet by Lucas Sharkey to evaluate %UF flow alternatives Borrows CALSIM mass-balance framework Allocates water based on demand and availability Growing season: March-September Availability: Inflows, Reservoir Storage Constraints: Carryover storage, minimum allocation, drought refill

29 WSE Model CALSIM Framework
30 Stockton East WD South San Joaquin ID Central San Joaquin WD Oakdale ID Modesto ID Turlock ID Cowell/Riparian Merced ID
31 Modeling Flow Chart Iterate Water Supply Effects (WSE) Core Model HEC-5Q Temperature Model CEQA Impacts Analysis Diversions 20%/40%/60% Carryover/Cold Pool Instream Flows Outputs to SWAP/Econ Outputs for Temp benefits To UC DAVIS SALSIM Fish benefits 31
32 How to apply streamflow target Tuolomne Don Pedro Local Inflow Release 540 = LaGrange Dam Diversion Return Flow 545 = Modesto Calculate Available Water from All Inflows (incl. Return and Local Inflows) Calculate Diversions Available Recalculate release to meet target TARGET %UF SJR 32
33 Water Supply Effects: Allocation Peripheral inputs of ID water balance (component fractions) Note CUAW Demand also used for GW effects, cost analysis CUAW Demand (~CALSIM) ID water balance fractions TOTAL DEMAND Water Supply Effects (WSE Model) INFLOWS Reservoir Storage AVAILABLE WATER ALLOCATION Storage rules Diversions Streamflow / UI%
34 Annual Allocation Similar to New Melones Index: = [End-of-Feb. Storage] + [Anticipated Inflow Mar-Sept.] Add reservoir carryover storage parameters (target guideline and % draw) Subtract streamflow requirements Mar-Sept If enough water, districts get demands met If not enough, districts are cut
35 Calculation of Annual Allocation 1. Determine Streamflow Requirement (Feb-Jun %UF, BiOp, Vernalis, etc.) 2. Determine Available Water from: -net inflows, -storage, -storage End-of-Sept. constraints 3. Determine Growing Season Demand (Total Surface Demand March-Sept.) 4. Growing Season Diversion = Minimum(Available, Demand, Max)


36 Tuolumne Supply and Demand Up to 3500 TAF

37 Baseline Results:
38 82-yr Diversion Calibration
39 82-yr Diversion Calibration
40 Percent Exceedance of Diversion Delivery
41 Exceedence Plots
42 Exceedence Plots
43
44 Alternatives Results
45 Alternatives Results

46 WSE Impacts Summary: Reductions in Available Diversions
47 Temperature Results
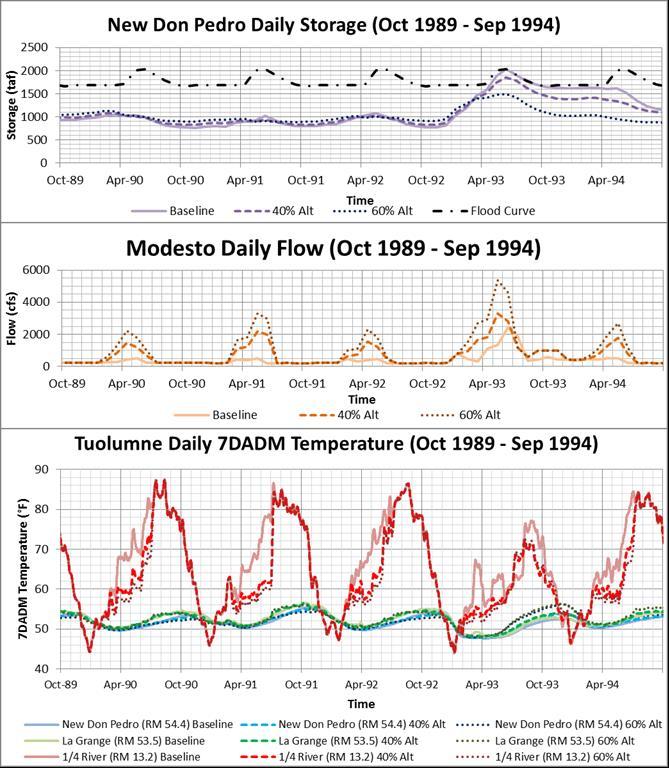
48

49 Tuolumne Avg. 7DADM April
50 Groundwater analysis Shortage is applied primarily to field demand (CUAW + Deep Percolation) for each district. To alleviate some of this affect additional groundwater pumping can be pumped up to a district maximum. Additional groundwater pumping is applied directly at the farm gate
51 Volume (TAF) Surface Water Agricultural Demand and Water Supply Stanislaus Baseline 600 Applied Groundwater and Surface Water for Agricultural Water Demand - Stanislaus River, Baseline Irrigation Year Min GW Pumping Applied SW Additional GW Ag Water Demand
52 Things to Remember SED describes CEQA Impacts Analysis Basin Plan Amendment is not self-implementing Board has not picked an alternative %UF may include adaptive implementation range Can optimize benefits / minimize impacts Requires Water Rights Proceedings/Due Process Aka Phase 3 of the Bay-Delta Plan Update 52