G T R P. Down sizing Down gauging Down weighting. Active & intelligent Packaging Nesting & Stacking Re use Recycling
|
|
|
- Maria Ellis
- 5 years ago
- Views:
Transcription
1 G T R P Down sizing Down gauging Down weighting Cost Reduction Active & intelligent Packaging Nesting & Stacking Re use Recycling
2 G T R S R P Continued growth of PET Bottles in Water, Carbonated Soft Drinks & Fruit Juices Emergence of Retortable PP Bottles for Aseptic Packaging of Milk Growth of PP shaped Jars for Health Powders Continued growth of Tetra packs for Aseptic Packaging of Milk & Fruit Juice Emergence of Gable Top Tetra packs with caps for 1 litre aseptic packaging of fruit juice and fruit juice blends Greater awareness of Food Safety after awareness creation by the newly formed FSSA Growth of Cold Forming Blister Packaging Emergence of New Generation Medical Device Packaging: Asthma Relief Inhaler and Diabetic Pen
3 G T M C P Overall Market Stagnant (USD 100 billion growing at 2%) Main End Uses: CSDs, Beer, Juices, Energy Drinks, Food Products, Deodorants (Aerosols), Paints, Polishes, Construction Chemicals, Agro Chemicals Main Growth Areas: CSDs,Beer,Paints Growth Due to: Emerging Markets, Localized Production Centers (China, Middle East, Eastern Europe) Main Trends: Right Sizing & Down Weighting of CSD Cans, Two Piece Cans, Choice between Steel & Aluminium, Faster Can Production & Filling, Stackability,Multipacks
4 P G T G Market Stagnant (USD 40 billion growing at under 2%) except for Beer Bottles Main Markets: China,USA,France, Italy Growth Markets: Russia, Eastern Europe, Middle East, India Beer Bottle viewed as cheaper optioncompared to Beer Can leading to shift to cans in the aspirational segment Cosmetics Glass Packaging viewed as premium with sparkle, frosting andshape styles Beer bottles becoming thin walled and down weighted with bottle weight reducing by 25% to 40% Reuse of glass bottles and high h filling speeds remain the major attractions Glass is wholly recyclable Global production highly concentrated
5 G T R P P Major Materials: PE,PET,PP,PS,EPS,PVC Other Materials:PA,PC,PEN,EVOH,PVDC,PU Foam, Bio plastics Market Size: USD 150 Billion, 22% of World Packaging Market Products: Bottles,Jars,Trays,Tubs,Pots,Pails,Thin Wall Containers, Rigid Plastic Tubes and Closures Technology Developments: Barrier Solutions through Single Layer Blends, Multilayer Co extrusions and Barrier Coatings, Hot Filling, Aseptic Cold Filling Growth Rate:6.5% CAGR Main growth focus: Pet Bottle (Single & Multilayer) Market Size: USD 35 billion A 500 ml Pet Water Bottle has been down weighted weighted from 24gm to 10gm 50% of Pet Bottles are recycled
6 P G T B P R PLA is derived from renewable resources such as corn starch in the US, tapioca roots and starch in Asia, and sugarcane in the rest of the world. PLA is biodegradable and compostable. PLA degrades within 60days in industrial composting and 180 days in home composting. Degradation can take up to two years in landfills. The rate of degradation depends on humidity,temperature and air flow. The main applications in packaging are for trays and cups. Under cold forming,pla can be competitive with PET. PLA is being used by TESCO & Sainsbury in UK,Carrefour in France and E Mart in Korea. Wal Mart is evaluating options. These are still initial days.
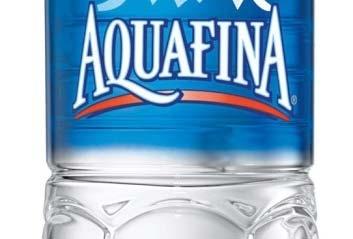
7 G T C S PET B The Pet Bottle has become the largest format of Beverage Packaging. Its end uses extend from Carbonated Soft Drinks to Waters to Fruit Juices, Teas and Tonics, and even Beer & Wine. The transformation of the Pet Bottle is a story of advances in bottle design, innovations in stretch blow moulding process, multilayer co extrusion, use of advanced materials, deeper understanding of end uses, bottling plant automation, newgeneration logistics, recycling, cost reduction.
8 G T PET B L S L L C PtP Pet Preforms: Multicavity for Higher Output High speed and High Pressure Injection for Thin Walling Multi layering with Co injection for high barrier properties Use of Regrind in Central Non Food Contact Layer for Cost Reduction Use of EVOH,MXD6,M9 Nylon Nano Composites & Oxygen Scavengers Pet/Regrind/Pet, Pet/MXD6/Regrind/MXD6/Pet Stretch Blow Moulding of Pet Preforms: Highly Accurate Control on Mould lddesign, Bottle Paneling Stretch t Ratios, Rti Temperature Profile and Crystallanity for Adequate Barrier and Strength. Very accurate control on Orientation and Crystallanity to prevent failure of Carbonated dsoft ftdi Drink kbottles under Gas Pressure. Lowering of Wall Thickness, Bottle Weight and Bottle Cost with higher levels of Control on Stretch Blow Moulding Process
9 MXD6 S PET B Processing temperature of MXD6 overlaps with PET making it suitable for co injection and co extrusion.
10 M P B I B MXD6 Shelf Life of Carbonated Drink
11 B M B C E Higher Carbon Dioxide Retention in Multilayer PET Bottle with lower weight % of MXD6

12 G T PET B H F F J PET is a unique material.it can assume an amorphous structure t or a crystalline structure depending on moulding and processing conditions. Pet crystals are generally either spherulitic or rod like. The spherulitic crystal is longer than the wavelength of light. Hence, it tends to reflect light. Pet Bottles with such crystals are opaque. Rod like crystals initially form under molecular strain or under biaxial orientation. They continue to grow under heat. Being small, rod like crystals allow transmission of light.hence,such heat set bottles are transparent. Processes can be controlled for heat set "rod like crystallanity A conventionally molded CSD Pet Bottle has 20% crystallanity. Higher performance heat set bottles have 28 32% crystallanity. Heat set clear Pet Bottles are highly cost effective for hot filled fruit juices. This is today the fastest tgrowing area for the Pet Ptbottle.

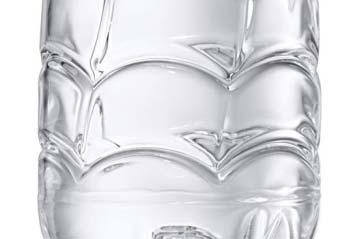
13 G T PET B V H F OptimizedPreforms with Reduced Bi orientation rate Higher Crystallanity in Side Walls for Higher Tg (Glass Transition Temperature) and Greater Thermal Resistance Thermal Distortion Load in Neck Area countered by either Neck Crystallization or Higher Neck Weight High Stretch Ratio in Upper Side Walls or Ribbed Design to Achieve Stiffness Vacuum Panels to withstand hydrostatic pressure during filling process and compensate for pressures due to partial vacuum during cooling Base Design ribbed because of high proportion of amorphous material. Ribs prevent distortion under hot fill or pasteurization. Petaloid or spherical base depending on stress levels, particularly during pasteurization of carbonated liquids.
14 G T P B W F C R The microbiological activity of a non alcoholic beverage is guided by extrinsic and intrinsic factors. Eti Extrinsic i Factors: Temperature & Oxygen Intrinsic Factors: Beverage Nutrient, Minerals, Preservatives, Sugar Content, Moisture Content, ph value,co2 (in case of carbonation),growth inhibitors. Depending on above factors, beverages are either filled hot ( Deg C) or warm (72 80 Deg C). Low Acid Beverages generally need hot filling. High Acid beverages mayneed only warm filling. Pet Bottle Design is simplified by warm filling as opposed to hot filling. Cost saving opportunity is realized.
15 H S P B G P L B S A L W Amcor is working on Panel Less Technology in hybrid combination with paneled designs through better material distribution. ib ti Amcor had launched its panel less bottles with Claude s eight varieties of sauces and marinades. Graham Packaging is launching its Active Transverse Panel bottle which will be lighter. Graham has also developed a proprietary technology that cuts the weight of hot fill bottles by 7 to 12%. Constar has developed a vertical compensation technology that allows the bottle to shrink to accommodate vacuum. Bottle has less weight & higher top load strength. Heat set Pet Bottles are becoming more & more competitive.


16 G T PET B W AA L F B S L Wrap Around Label Shrink Label
17 Market Size: USD 255 billion Growth Rate:4.2% CAGR G T P B P Material Distribution: Corrugated Packaging & Folding Carton Board:60%,Kraft Paper:30%,Wrapping Paper:10% Major Consumption Centers: Asia, North America, Europe High Growth Areas: Middle East, South & Central America, Eastern Europe, Africa & Asia High Growth Countries in Top 25 Consuming Countries :Turkey, India, Poland, Brazil, Indonesia, China, Taiwan China second largest consuming country after USA Indian consumption is USD 7 billion against China s USD 41 billion Indian consumption is growing gat 12% against China s 8.4%
18 G T F C P B P Food Contact Paper & Board Packaging is currently valued at USD 56 billion and is growing at 6% CAGR. Additional Demand Pattern in MMT till : 2017 Fresh Produce: 2.5, Dry Groceries :1.8, Liquid Foods & Beverages: 1., Others including high growth Chilled Foods, Takeaway Foods & Ready Meals :2.5 Total: 7.8 Additional Demand Pattern : Fresh Produce: 34%,Frozen Foods: 1%, Ready Meals :1%, Takeaway Foods & Vending: 10%,Dry DryGroceries: 25%,Bakery Products:10%,Non Liquid Dairy Products:2%, Liquid Foods & Beverages:13%,Others 4%
19 G T E F P B Forest Certification depending on programmes for Afforestation & Social lforestry Recycled Content in Paper Extent of Saving of Water in Paper Manufacture Energy saving from new generation pulping and drying processes Freedom from toxic waste discharge into the environment Chlorine free paper Food contact paper Plastic Free Barrier Board Automated Production of Corrugated Board Obtaining requisite bursting strength, top load strength and corner crush resistance at lower paper gsm Use of Sugarcane Bagasse in Paper Manufacture
20 W P M Material Global Share in CAGR Consumption Consumption % % Paper & Board USD 255 Billion Rigid Plastics USD 150 Billion Flexibles USD 85 Billion Mtl Metal USD 102 Billion Glass USD 37 Billion Others USD 39 Billion Total USD 668 Billion
21 I P M Material Consumption in Share in CAGR India Consumption % % Paper & Board Packaging USD 7.0 Billion Rigid Plastics USD 3.9 Billion Flexibles USD 2.4 Billion Metal Containers USD 3.6 Billion Glass Packaging USD 0.8 Billion Others USD 1.3 Billion Total USD 19.0 Billion
22 P F I P M Good availability of FMCG and packaging raw materials Largest milk producer, 2 nd largest vegetable producer and 3 rd largest fruit producer in the world Growth in Value Added Dairy Products Packaging & Branding of Fresh Produce Growth of Processed Foods from a low base Conversion from loose to packaged in grain and cereal products Huge cache of Marine Life(huge coastline) Large production of Salt and Spices Huge availability of LAB (used in detergents) Large producer of PET,PP and PE Spread of Modern Retail Lifestyle and Value Up gradation Rupee Devaluation leading to higher exports Rag pickers collecting PET Bottles & Metal Containers for Recycling
23 N F I P M De growth in Tobacco Products Widespread d spurious manufacture Government estimates 60% of milk in India is adulterated Large unorganized sector infmcgproducts Input raw material hike due to devaluation High cost of energy Huge wastage in supply chain Adverse climatic conditions Enormous plastic litter in all major urban centers
24 S P Success chooses those who are dedicated to the packaging discipline! Thank you!! Good Luck!!!