The seasonal variation in soil salinity under irrigation The effect of winter rainfall in leaching salt down the soil profile
|
|
|
- Aubrie Hutchinson
- 5 years ago
- Views:
Transcription
1 The seasonal variation in soil salinity under irrigation The effect of winter rainfall in leaching salt down the soil profile
2 Prepared by: Jock McFarlane Senior Consultant, Rural Solutions SA Office: (08) Fax No: (08) Rural Solutions SA 2011 This work is copyright. Unless permitted under the Copyright Act 1968 (Cwlth), no part may be reproduced by any process without prior written permission from Rural Solutions SA. Requests and inquiries concerning reproduction and rights should be addressed to insert name, Business Manager, Rural Solutions SA, GPO Box 1671, Adelaide SA Disclaimer Rural Solutions SA and its employees do not warrant or make any representation regarding the use, or results of the use, of the information contained herein as regards to its correctness, accuracy, reliability, currency or otherwise. Rural Solutions SA and its employees expressly disclaim all liability or responsibility to any person using the information or advice.
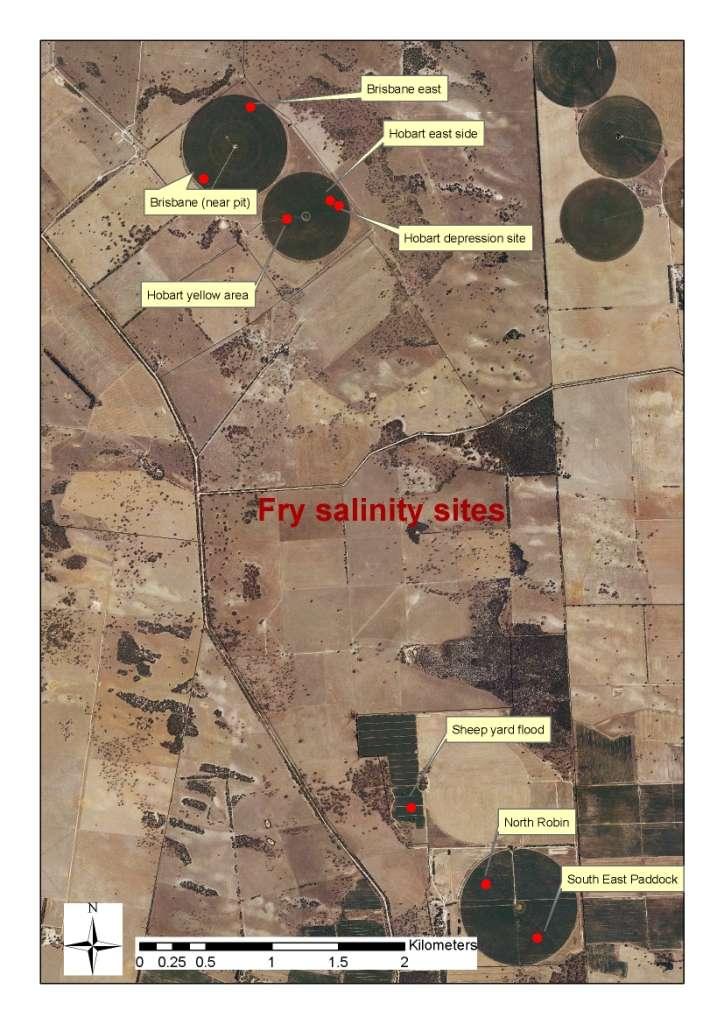
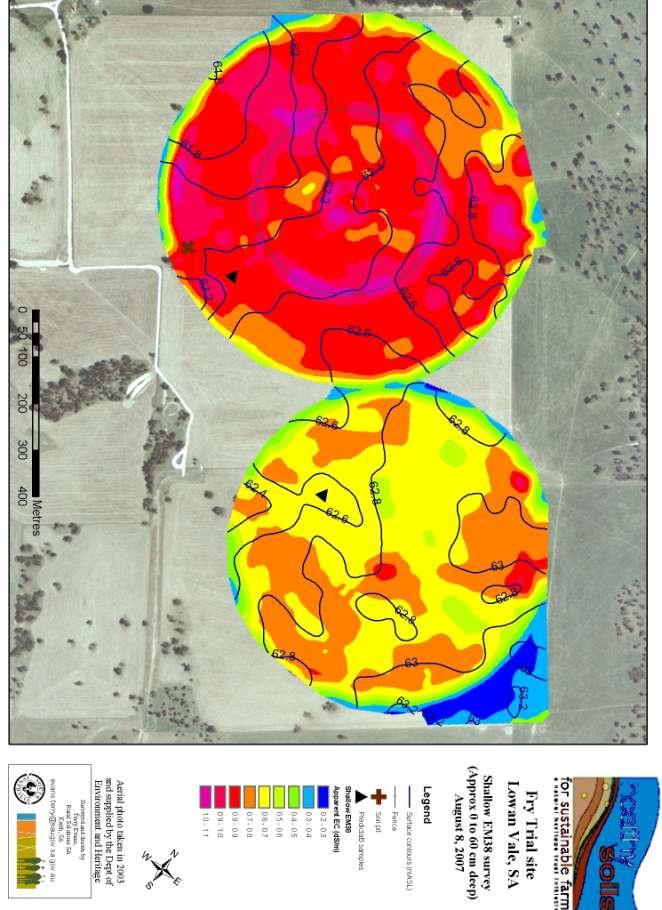
3 3 1 SOIL HEALTH ACTIVITIES, JOHN FRY, WIRREGA (VIA BORDERTOWN) Background The Keith Bordertown area has a long history of growing lucerne using surface irrigation. However due to water availability, irrigators are progressively converting from surface irrigation to more efficient systems such as centre pivots. Water at this site is sourced from groundwater which contains 3500ppm salts. There is concern over whether the salts are either accumulating within the plant root zone, or wether they leach out given either sufficient winter rainfall or sufficient irrigation water with an additional leaching fraction. Objectives The aim of this site is to provide longer term data to assess the sustainability of irrigation on this soil type when using saline groundwater. The objectives of the site is to monitor the salinity levels throughout the summer irrigation period and also through the winter to determine if there is sufficient leaching of the salts over the winter period. Location The site is located approximately 14km north of the Dukes Highway at Wirrega on the Wurlyana Road, and approximately 17kms east of Keith Current Paddock Demonstrations The South East Natural Resource Management Board supported an investigation into the use of two different irrigation applications (68mm and 50mm) to determine if a higher amount applied will leach the salts beneath the rootzone. The site is comprised of two centre pivot irrigators supplied by bore water containing 3500ppm salts to grow lucerne. The site has been mapped using electromagnetic mapping. The soils have been characterised with three soil pits, one under each pivot and one outside the irrigated area. Sampling using push tubes has been conducted on selected areas determined
4 4 from the EM mapping to support the soil pit descriptions and assess the degree of variation in the soils. The soil type has also been characterised for drained upper limit and crop lower limits for use in APSIM modelling and to refine irrigation practices. Management Practices Predominant land use is for a variety of dryland and irrigated farming systems. These include mixed livestock and cropping, to continuous cropping and irrigated lucerne. Dryland cropping is predominantly cereals, canola and legumes such as beans while the main irrigated crop is lucerne for seed production. Soil Profile Description The natural soil type across the two irrigated areas is relatively consistent and is classified as a brown Sodosol over calcrete. However, the thicknesses of the bleached sand layer and brown clay subsoil vary considerably both between the sites and also across each site. Both sites have been modified considerably by laser levelling and also delving to bring subsurface clay into the surface sands in order to overcome their non wetting nature. Soil Pit Outside the Irrigated Area Bleached Sand over Clay The soil comprises a neutral, dark brown clayey sand to a depth of 10cm, with a clear change to a brown sand layer which extends to a depth of 15 to 18cm. This has a clear change to a slightly acidic, bleached sand layer, varying in thickness to a depth of between 20 and 32cm, with a sharp, wavy boundary to a neutral, brownish yellow, medium heavy clay with coarse columnar structure to a depth of 70cm. There is a diffuse transition to strongly alkaline mottled brownish yellow medium clay with coarse prismatic structure and 50% soft carbonates, which extends to a depth of about 120cm, below which there is strongly alkaline, massive light clay. There are very low levels of salinity to a depth of 70cm, below which it is very slightly saline with ECe of 1.3 ds/cm. The clay subsoil and below is moderately sodic.

5 5 Brisbane Pivot Soil Pit. Shallow sand over Clay on Calcrete The soil is typically a strongly alkaline, dark grey brown clayey sand to a depth of 10 to 15cm, with a clear change to a pale brown bleached sand layer varying in thickness to a depth of 25 to 40cm. This has an abrupt, wavy boundary to an alkaline, strong brown light medium clay with subangular blocky structure, which varies in thickness to a depth of 38 to 55cm. Below this there is a sharp, wavy boundary, to a thick, strongly alkaline highly calcreted limestone layer, which varies from hard to relatively soft, depending upon degree of weathering, moisture content and depth. There is a diffuse change at 115cm to a massive light grey clay, containing up to 50% soft carbonate. Analysis shows that the surface horizon and bleached sand layer are saline (ECe is 4.57 ds/m and 3.59 s/m respectively) with moderate levels of chloride. They also have moderate levels of sodicity as a result of the delving. The brown clay subsoil is saline and sodic, with the ECe of 10 ds/m, chloride of 1395mg/kg and exchangeable sodium at 27.2%. Salinity increases to ECe of 14 ds/cm in the upper zone of the carbonate layer, where the chloride is 2528mg/kg and ESP is 24%. Below about 64cm, the salinity, chloride and ESP decrease. Note; where the profile has been delved, the ECe has increased to 7.4 ds/m, and the chloride to 839mg/kg and ESP to 23.3% in the bleached sand layer. SHALLOW SAND OVER CLAY ON CALCRETE General Description: Delved grey sand with a bleached subsurface over weakly structured brown clay subsoil, over calcreted lagoonal sediments. Landform: Level plain. Substrate: Calcreted limestone of the Padthaway Formation
 Hundred: Pendleton Easting: 459690 Section: 49 Northing: 6001255 Sampling date: 06/11/06 Annual rainfall: 460 mm Level plain, 0% slope.")
6 6 Vegetation: Type Site: Site No.: SE119 1:50,000 sheet: (Cannawigara) Hundred: Pendleton Easting: Section: 49 Northing: Sampling date: 06/11/06 Annual rainfall: 460 mm Level plain, 0% slope. Soft surface with minor calcrete stones. Paddock delved to 40 cm. Soil Description: Depth (cm) Description 0-15 Very dark grey brown single grain clayey sand with 10-20% small clay fragments and 2-10% calcrete fragments. Many roots. Clear to: Very pale brown (bleached) single grain sand. Few roots. Abrupt to: Strong brown friable weakly subangular blocky light medium clay. Roots common. Sharp to: White calcreted limestone. An occasional root present. Diffuse to: White calcreted limestone. An occasional root present. Diffuse to: Massive light grey medium clay with brownish yellow mottle. Interspersed with up to 50% soft carbonate. No roots.
7 7 Note: Clay delving has caused mixing of the first three, (and occasionally part of the fourth) layers where the delve tine has passed. Classification: Eutrophic, Petrocalcic, Brown Sodosol; medium, slightly gravelly, sandy / clayey, shallow Summary of Properties Drainage: Well drained. No part of the profile is likely to remain wet for more than a day or so. Fertility: Clay delving has improved the fertility of the soil surface, with cation data indicating moderate inherent fertility natural fertility of this soil is low. Fertility has also been improved in the second layer along the delve line. Phosphorus levels are low, but most other nutrients appear adequate for pasture growth. Surface levels of cobalt, molybdenum and nickel were 1007, 154 and 2118 parts per billion respectively. ph: Alkaline throughout surface alkalinity attributable to irrigation water Rooting depth: 64 cm in the sampling pit. Root zones of soils formed over limestone are usually variable due to the dissolution of the limestone. Deeper solution holes (up to 100 cm) evident during excavation. Very low root numbers in small clay filled holes in calcreted limestone. Barriers to root growth: Physical: The cemented platy pan of calcreted limestone restricts root penetration. Chemical: High ph and high carbonate of limestone prevents most roots from accessing these horizons. The soil is moderately saline, becoming highly saline below 25 cm. The soil is strongly sodic, particularly in the third layer. Water holding capacity: Total available water: Estimate mm
8 8 Readily available water (RAW): Estimate mm. The influence of the limestone layer on water availability is unknown. Seedling emergence: Good. The clay spread at the surface through the delving process has improved the surface condition and reduced water repellence. Workability: Good. Erosion Potential Water: Low. Wind: Moderate if surface vegetation cover is removed and the surface is allowed to dry out. Laboratory Data Depth ph ph CO 3 EC ECe Cl Org.C Avail. Avail. SO 4-S Boron React Trace Elements Sum Exchangeable Cations Est. cm H 2O CaC1 2 % 1:5 ds/m ds/m mg/kg % P mg/kg K mg/kg mg/kg mg/kg Fe mg/kg mg/kg (EDTA) cations cmol(+)/kg cmol Cu Fe Mn Zn Ca Mg Na K (+)/kg ESP * ** Note: Sum of cations, in a neutral to alkaline soil, approximates the CEC (cation exchange capacity), a measure of the soil's capacity to store and release major nutrient elements.
9 9 ESP (exchangeable sodium percentage) is derived by dividing the exchangeable sodium value by the CEC, in this case estimated by the sum of cations. * Clay lumps sampled from within the zone altered by delving. ** Sand sampled from within the zone altered by delving. Very low- may indicate deficiency and/or other limitations * High reading- may indicate toxicity and/or other limitations* *Note: Soil results are from a single point sample and are indicative only. They may not reflect the general condition of the rest of the paddock. Also, plant responses relating to nutrition measurements can vary between soil types and plant species, so values are indicative only. MANAGEMENT OF THIS SOIL TYPE Constraints: Prior to irrigation and delving the sandy texture of this soil would indicate low inherent fertility and possible moderate non wetting evident. The ph of the A horizon would have been acidic. The calcrete layer at 38 cm is a major barrier to root growth. With irrigation the ph of the soil has become alkaline throughout with high ph over 8.3 indicating an emerging salinity problem associated with saline irrigation water. Despite the improvement of the potential fertility with delving the extractable phosphorus levels indicate that there will be a continued response to phosphorus fertilizer applications. With increasing ph as a result of irrigation trace elements, particularly manganese, may become limiting. IMPLICATIONS Delving has improved the potential for building up the general nutrition of the soil. To increase productivity and so use irrigation water more efficiently the phosphorus inputs should be evaluated. Under the current irrigation regime there is an elevated salinity level which could normally (November) be a problem so early in the irrigation system. This is most likely due the lack of rain in the preceding winter that would normally leach the salt build up from the previous irrigation season. A heavier application of water may help leach salts if they become limiting in the crop being irrigated.
10 10
11 11
12 12 Management Considerations The key factor influencing the sustainable usage of this soil for irrigated lucerne is the increase in salinity of the soil within the plant root zone. Longer term monitoring is required to determine if there is sufficient winter rainfall or additional irrigation water can be applied to leach the salts below the plant rootzone. There is also some concern as to the fate of any leached salt, and the implications of drier than average winters reducing the leaching. The delving action has increased the clay content of the surface sands, overcoming their non wetting and reducing their susceptibility to wind erosion increased the levels of major nutrients, trace elements and cations in the bleached sand layer increased the water holding capacity of the surface and bleached sand layers raised the ph of the surface sands and bleached sand layer to levels that are likely reduce the availability of trace elements The highly alkaline calcareous layer is likely to be a major constraint to root development of many crops, either as a result of the high levels of carbonate or due to its hardness. It is unlikely that there is an economically feasible management action to overcome this. Results After the irrigation season when salt builds up with the application of saline groundwater the amount of winter rainfall is critical in leaching the salt so that salinity does not reach toxic levels in the root zone of the crops for the following irrigation season and therefore prolongs the sustainability of the irrigation area. Rainfall Jan Feb Mar Apr May Jun Jul Aug Sep Oct Nov Dec Total Winter and spring rainfall 2006 was 87 mm 2007 was 221 mm 2008 was 203 mm 2009 was 336 mm 2010 was 303 mm
13 ECe (ds/m) 13 As can be seen from the rainfall records from the Bureau of Meteorology data set for Wirrega, winter and spring rainfall varied over the 3 years of sampling and followed the drought of 2006 and a dry winter in Shallow sampling depths As expected the shallower sampling depths (0 40 cm) followed the seasonal trend of increasing in salinity after the irrigation season but with winter rainfall they declined and were refreshed following winter rainfall even after the relatively low winter rainfall of The exception to this was for the October 2010 sampling in the Hobart East paddock where soil from the cm sample increased in salinity as did the soil samples from deeper in the profile (50 60 and cm) when compared to the previous spring sampling. This can only be explained by sampling variability or laboratory error. The following tables summarise the salinity ECe values for 7 sites Brisbane near Pit Jan-08 May-08 Sept-08 Jan-09 Sep B
14 ECe (ds/m) ECe (ds/m) 14 Brisbane East Jan-08 May-08 Sept-08 Jan-09 Sep-09 Hobart East Paddock Jan-08 May-08 Sept-08 Jan-09 Sep-09 Oct-10
15 ECe (ds/m) ECe (ds/m) 15 Hobart Yellow Paddock May-08 Sept-08 Jan-09 Sep-09 Oct Sheep Yard Flood May-08 Sept-08 Jan-09 Sep-09 Oct-10
16 ECe (ds/m) ECe (ds/m) 16 North Robin Jan-08 May-08 Sept-08 Jan-09 Sep South-East Paddock Jan-08 May-08 Sept-08 Jan-09 Sep-09 Deeper sampling depths At the deeper sampling depths there was more salinity present but apart from the Hobart East paddock the trend after the wetter winters of 2009 and 2010 was down at the 2009 and 2010 spring samplings when compared to the 2008 spring sampling