2017 Environment Management System & Community Engagement Report
|
|
|
- Edward Barrett
- 5 years ago
- Views:
Transcription

1 2017 Environment Management System & Community Engagement Report March 30, 2018
2 Table of Contents Summary 1. Background 2. Communications and Community Engagement 3. Community Air Quality Monitoring 4. Emissions Reduction Initiatives 5. Environmental Community Concerns 6. Action Plan Updates 7. Contact Information 8. Appendix 8.1. SO2 Measurements 8.2. Nickel/Cobalt/TSP Measurements
3 Summary Nickel and sulphur dioxide (SO 2) Site Specific Standard Approvals were issued by the Ministry of Environment and Climate Change (MOECC) to Vale s Ontario Operations for its Copper Cliff Smelter Complex in the years between 2011 and The approvals included a request to implement communication and community engagement plans and to form an Environmental Monitoring Team (EMT). This sixth annual report documents 2017 community activities and environmental accomplishments. A number of events and meetings were held in 2017 in an effort to deliver information to the community about Vale s environmental activities and initiatives. These include the annual Open House, EMT meetings and Copper Cliff Liaison Committee (CCLC) meetings. Vale s corporate website, is also an excellent resource for information about the company s environmental performance and community involvement. Current and recent environmental monitoring results as well as real-time, recent and historical monitoring results are posted on the website. Details about monitoring programs, emission reductions, dust emissions controls and information on other environmental initiatives can also be found at: Concentrations of SO 2, total suspended particulate (TSP) and metals were measured at a number of monitoring stations in the community. In 2017, there were a total of eight exceedances of various air quality standards (3 SO 2, 3 TSP and 2 nickel) and one exceedance of a provincial guideline (cobalt), many of which occurred on the same day. Details are provided and discussed both in the report and in the Appendix. Vale continued to operate an Emission Reduction Program (ERP) to limit SO 2 emissions from the Smelter by curtailing production on days when dispersion/ weather conditions were such that ground level concentrations in the community were predicted to exceed provincial air quality limits. Vale received significantly less complaints from community members in 2017 compared to previous years. All complaints were documented, investigated and followed up. An analysis of these complaints and a summary of how Vale responded to them is detailed in the report that follows. SO 2 and Nickel Action Plan updates were submitted to the Ministry of Environment and Climate Change (MOECC) in March and September 2017 and were subsequently posted on the Vale website.
4 1.0 Background At the end of 2017, the following air quality related approvals from the Ministry of Environment and Climate Change (MOECC) were in effect at the Vale Copper Cliff Smelter: Amended Environmental Compliance Approval # BXPTC (issued January 2014) Nickel Site Specific Standard Approval (annual) # rv0 (issued December 2011) Sulphur Dioxide Site Specific Standard Approval (1-hr) # rv1 (revised April 10, 2017) Sulphur Dioxide Site Specific Standard Approval (24-hr) # rv1 (revised April 10, 2017) The site-specific standard approvals contain a requirement to form an Environmental Monitoring Team (EMT) with representation from the community, the MOECC and Vale. The purpose of the EMT is to serve as a forum for dissemination, consultation, review and exchange of information regarding the operation of the Smelter, environmental issues such as air monitoring, analysis of monitoring data, and to review any new or amended Ministry approvals, as required. The group was formed by inviting members of an existing community stakeholder group, the Copper Cliff Liaison Committee (CCLC), which includes representation from the MOECC, and two members of the Gatchell Community Action Network, to participate. Though the actual EMT requirements varied between the Approvals, the group decided that one EMT would be appropriate to address all community engagement requirements. This report documents the work of the EMT and the communications activities undertaken by Vale in Communications and Community Engagement The EMT followed the communication plan it developed in 2012, which is based on the premise of providing proactive, transparent and timely communications that update current performance and the progress of Vale s Action Plan to meet the requirements of its Site-Specific Standard (SSS) Approvals. Information was shared through the course of the year via: The environment section of The Annual Report to Community Vale s Annual Open House Meetings with community groups The EMT received updates of monitoring results, Action Plan progress, and communications initiatives at meetings held in March and November of Vale s website, includes information on a number of Vale initiatives and topics. The environment elements that fulfill the site-specific standard approval requirements can be found on the website at:
 Glossary of terms Details about the monitoring and")

5 The air quality documents posted on this site include: Most recent and historical metals and SO 2 monitoring results (reported quarterly) Glossary of terms Details about the monitoring and emission reduction programs, and Information about dust emission controls The website also includes information about Vale in the community as well as information about the company s water, reclamation and decommissioning management activities. Approximately 175 people attended Vale s 2017 annual Open House to learn about Vale s Sudbury Operations and environmental initiatives at Dynamic Earth on September 19, Free venue access was an attractive offer to local residents and their families. Dynamic Earth provides unique and interactive exhibits that Vale can utilize to help provide information and updates about its air monitoring networks, the Clean AER Project and its Action Plans for its site-specific standard approvals for SO 2 and nickel. Information on other environmental initiatives such as re-greening, community gardens, water management and dust control was also provided to the community for feedback. At the same time, visitors had an opportunity to learn about mining and minerals, Vale s operating facilities and its safety initiatives. Visitors also had the opportunity to go on an underground tour, compliments of Vale. Photos from the September Open House are provided below. Mayor Brian Bigger enjoys the Open House. Environmental displays were popular.

6 3.0 Community Air Quality Monitoring Sulphur Dioxide There are 18 fixed continuous SO 2 monitoring stations located in the community, owned by Vale and Sudbury Integrated Nickel Operations, a Glencore Company and operated and maintained by BESTECH Ltd. In addition, the network includes the operation of three meteorological towers and Vale s mobile SO 2 monitoring unit. The mobile unit is used to measure ground level concentrations of SO 2 in areas of the community not covered by the 18 fixed stations. A map indicating the location of the stations is provided below. In addition to the real time monitoring data, quarterly and annual reports of SO 2 concentrations measured at the fixed stations were compiled and reported by an independent consultant and submitted to the MOECC. The reports were then posted on the Vale website on a quarterly basis. Results from the monitoring network indicate that annual mean SO 2 concentrations in 2017 were lower at all stations than in previous years, with some stations reporting mean concentrations that were less than ½ the values measured in The highest annual average in 2017 at any of the Vale stations was measured at the Union Street station, at a value of just greater than.002 ppm. This shows an improvement over levels that were already low in previous years. The Appendix provides a graph showing the 2017, 2016 and 2015 mean annual SO 2 concentrations for all the stations.
.")
7 On a short-term basis, there were three exceedances of the 1-hour SO 2 standard in 2017 at the Vale stations; one at Rayside station in January and two at the Copper Cliff station (same event). The events and results are discussed and presented in further detail in the Appendix (Section 8). Nickel / Cobalt Vale s particulate sampling network operates on concurrent 3-day or 6-day sampling schedules, with 9 stations operating monitors that collect particulate matter on filters over a 24-hour period. The filters were sent to an independent lab/consultant for gravimetric and metals analyses and reporting in Quarterly reports are posted on the Vale website as they become available (several months lag time required for filter and data analysis). A map showing the location of the monitoring stations is provided below. The map shows 9 stations, including the newest station at Fielding Road, installed in the summer of In 2017, the following nickel standards were in effect: 24-hr Upper Risk Threshold (URT) of 2 ug/m 3 nickel Annual average standard of 0.04 ug/m 3 for Power Street and Fielding Road Annual average standard of 1.0 ug/m 3 for the remaining monitoring stations to reflect the site-specific standard in effect until December 2021
8 There were two nickel exceedances measured in 2017, one of the 24-hr URT and the other of the annual standard. The 24-hour total suspended particulate (TSP) standard was exceeded on three days, whereas the cobalt 24-hour guideline was also exceeded on one occasion (on the same day as one of the nickel and TSP incidents). Details and discussion about these events along with graphs showing all of the measured values are provided in the Appendix. 4.0 Emissions Reduction Initiatives Vale s Emissions Reduction Program (ERP) is a significant contributor to the company s positive emissions performance. This program limits SO 2 emissions to the atmosphere by curtailing production at the Smelter when dispersion conditions are such that unacceptable ground level concentrations of SO 2 are anticipated or experienced in the communities located around the Smelter property. ERP operators monitor Smelter operating conditions 24 hours per day, 7 days a week and control production accordingly. On January 1, 2017, the SO 2 air quality standard limit that applied at the monitoring (and mobile) stations dropped from ppm to ppm. Vale s Smelter Operations team responded accordingly with the ERP program. In fact, there were approximately 1200 hours in 2017 when ERP production cutbacks were implemented, compared to less than 1000 in Environmental Community Concerns The Smelter Environmental Compliance Approval and Nickel Site-Specific Standard Approvals require Vale to make a telephone number available to the public to register environmental complaints, and also require that all complaints be documented and followed up. Vale has had telephone numbers and a process to address community concerns for many years. For the Smelter, there is a telephone number, , that is answered by a Smelter employee 24 hours per day, 7 days per week to receive and address concerns. Vale also has a general community concerns line at VALE that is also answered 24 hours per day, 7 days a week by an answering service; Vale employees respond to the concerns received on this line within 48 hours. The Smelter Environmental Concerns Summaries for 2015, 2016 and 2017 are presented in the following graph. There were a total of 76 community concerns logged in 2017, compared to 171 in 2016, and 154 in The concerns have been sorted by type in the graph that follows.
9 It is important to note that the total number of concerns decreased by more than 50% in The main decrease was attributed to fewer calls about SO 2 Stack Emissions concerns, followed by fewer calls about Fall-out and the Unknown/Others concerns. The number of Fluid Bed Dryer Odour calls remained much the same as in previous years. A further Action Plan was developed and shared with the MOECC in December of 2017, in an effort to curb the number of calls, and is currently in the process of being implemented. The Plan involves dedicated community odour patrols on nights when easterly winds are predicted (were not dedicated previously) with cut-back of feed drying rates when any odour is detected. When community calls are received, they are routed to the appropriate department and the caller is contacted directly by the Vale representative. A complaint log form is filled out that records the date, time, name, address and phone number of the person, along with the wind direction at the time of the incident (available from Vale s meteorological records). Specific details about the complaint are also logged in the form. Within one week of receiving the complaint, the following information is entered into the log: Actions taken to investigate the cause of the complaint and result Recommendations for remedial measures Managerial/operational changes to avoid recurrence Feedback given to the caller The Smelter Environmental Compliance Approval (ECA) requires Vale to keep the complaint records on file for seven years, and also to submit quarterly reports to the MOECC summarizing the information about the complaints, including follow-up details. This information was submitted to the MOECC in Feedback on community concerns is also actively sought and logged at Vale s annual Open House and through its annual Report to the Community. The company invites the public to
10 express their concerns through a variety of methods (phone lines, , feedback forms and in person). 6.0 Action Plan Updates As part of its submission for site-specific standards for nickel and SO 2, Vale submitted Action Plans to the MOECC to reduce its overall emissions and ground level concentrations in the community. These Action Plans became conditions and were appended to the site-specific standard approvals. Vale prepares a report to update the status of its Action Plans semiannually, in March and September. The updates are posted on Vale s website at: Some main points are as follows: SO 2: The AER project continues toward target completion in Site-specific standards (SSS s) for SO 2 will expire June 30, 2018; numerous modelling analyses were conducted in latter part of 2017 to determine if the Smelter could meet the provincial air quality standards during the transition period from July 1, 2018 to AER completion. It was determined that the air quality standards could be met during that time period without a SSS. Numerous dispersion model runs were made to define specific conditions that needed to be maintained to ensure that the provincial air quality limits would be met. A modified Emission Reduction Program (ERP) was developed such that the ERP operator would continue to curtail production at the Smelter when it was determined (through modelling MOECC s chosen avenue of compliance) that adverse dispersion conditions could result in an exceedance of the SO 2 standards in the community. Program and modelling files were submitted to the MOECC at end of 2017; several working meetings were held with the MOECC and dialogue is ongoing. Nickel: Dust management practices at the Smelter continued as per requirements set out in the Dust Management Practices manual (updated annually and submitted to MOECC every spring). Changes in Vale s flowsheet and economic conditions in 2017 necessitated the cancellation of the construction of 2 new material handling buildings in the property at the back of the Smelter. These had been in the original AER scope. A number of alternative configurations are being considered by Vale management, including moving the handling activities to a different location. Multiple dispersion model runs have been undertaken, to ensure that alternatives meet the MOECC air quality standards. Monthly updates to the MOECC are provided. The Clean AER Project is approximately 98% complete to date. Engineering, procurement, fabrication and construction have continued as per the execution plan developed at the end of 2014, with detailed engineering and equipment fabrication 100% complete. Construction continued in the main areas as follows:
11 The Converter #10 performance testing was completed in November, and the installation met the design criteria. The Converter Wet Gas Cleaning Plant (WGCP) building and equipment installation is 95% complete and the facility will be turned over to commissioning in January Ramp up is scheduled for early April. The Primary and Secondary Flue system commissioning and ramp up plans are being developed to integrate the converters with the WGCP in order to send SO 2 gas to the acid plant. This integration is complex and requires Converter #10 to be dedicated to the Clean AER project for ramp up of the WGCP. The M floor conveyor belt installation is currently on a temporary suspension due to a redesign requirement of the drop chutes. #34 belt was completely installed and ramped up in Dec, which lead to the discovery of the design deficiency on the drop chute. Modifications are expected to be complete by the end of March, at which time work can begin on #33 belt. Ramp up of #33 belt is scheduled for July The Secondary Baghouse and Fan Building construction progress is at 60%. Construction continues to progress according to plan with completion forecast for Q Photos

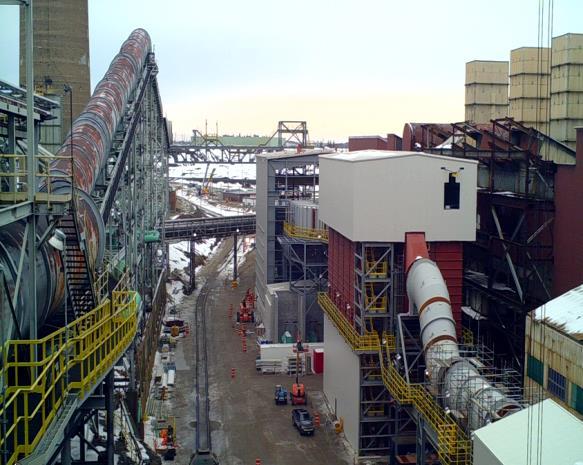
12 Converter Wet Gas Cleaning & Flue System Model Converter Wet Gas Cleaning Construction Site


13 Secondary Baghouse and Fan Building


14 7.0 Contact Info
15 For more information or to discuss this report, contact Lisa Lanteigne, Manager Environment, Ontario Operations, Vale Canada Limited at: , or Monika Greenfield, Superintendent Environment, Ontario Operations, Vale Canada Limited at:
16 8.0 APPENDIX 8.1 SO 2 Measurements Summary graphs of the SO 2 measurements taken at the 18 stations in 2017 are provided in this Appendix. Very low SO 2 concentrations were measured at all stations for the majority of the year; all stations were calculated to have annual arithmetic mean concentrations that were less than ppm in 2017, which is ½ of the upper level measured in 2016 (presented in the 1 st graph on the next page). The annual trend was noted at all stations within the network. On January 1, 2017, the 1-hr SO 2 (monitored) standard dropped from ppm to ppm, and it is likely that this is the reason for the decrease in the annual statistics. The Emission Reduction Program (ERP) operators reduce Smelter operations when they predict adverse air dispersion conditions that have the potential to cause an exceedance of the SO 2 standards in the community. The decrease of the standard on January 1 st resulted in more frequent cut-back hours in 2017 than in the previous year (~1200 hours in 2017 compared to just under 1000 hours in 2016). The maximum 1-hour values for each station (presented in the 2 nd graph on the next page) also exhibit the same trend, with significantly lower maximum 1-hr SO 2 concentrations than in previous years for most stations. The exceptions were at Copper Cliff and Rayside, where there were collectively three 1-hour exceedances measured in The Rayside exceedance (0.32 ppm) was not predicted by the models used by the ERP operators, and occurred in January as a result of unusual weather conditions and a low persistent mixing height that caused trapping of the Superstack plume. There were two 1-hour SO 2 exceedances measured at the Copper Cliff station in July (0.34 and 0.42 ppm), both resulting from the same incident fugitive emissions that escaped through a leak in the roof of the building during the transition of furnaces after the maintenance shut-down. The graphs on the following page provide a summary of the 2015, 2016 and 2017 hourly (clock) maximum and mean SO 2 values.
17
18 8.2 Nickel/Cobalt/TSP Measurements There were two exceedances of the nickel standards recorded on March 14 th, when the 24-hr URT of 2 ug/m 3 was exceeded at Venice St (5.2 ug/m 3 ), and the other was an exceedance of the annual average standard of 0.04 ug/m 3 at Power Street, representing the period of July 1, 2016 to June 30, 2017 (0.075 ug/m 3 ). March 14, 2017 was a windy spring day immediately after snow melt, when the dust management processes at the Smelter had not been started for the year because of freezing temperatures. On that day, the particulate standard of 120 ug/m 3 and the cobalt guideline of 0.1 ug/m 3 were also exceeded at Venice Street (values of 176 ug/m 3 and 0.12 ug/m 3, respectively), in addition to the nickel exceedance cited above. There were 2 additional particulate exceedances in 2017, measured on August 29 (173 ug/m 3 at Norite St) and December 21 (136 ug/m 3 at Power St) on particularly windy days. The metals in these samples were within the allowable standards. All of these events have been scrutinized and analyzed with management at the Smelter, with the aim of preventing future occurrences from these sources. Future emphasis will be on increased efforts to curb handling activities on windy days, controlling dust track-out of working areas, diligent road cleaning, and maintaining best operational practices for handling dusty materials. Nickel and cobalt monitoring data for 2015, 2016 and 2017 for the 9 air quality monitoring stations are presented in the two graphs that follow. The most recent and historical detailed monitoring results for these and other metals measured at these stations are posted on the Vale website.
19