An Overview of Portland Harbor. and Screening Level Results. Advisory Group. USEPA Region 10 April 8, 2009
|
|
|
- Dominick Alexander
- 5 years ago
- Views:
Transcription
1 An Overview of Portland Harbor Ecological Risk Assessment Process and Screening Level Results For the Portland Harbor Community Advisory Group USEPA Region 10 April 8, 2009

2 For the Portland Harbor Ecological Risk Assessment Process, EPA Follows: Published in 1997 Intended to make risk assessments sitespecific, defensible and appropriately scaled Established 8-step EcoRA process Specific to Superfund program and consistent with general EPA guidance


3
4 Key Characteristics of a Sound Ecological Risk Assessment Provides clear endpoints and rigorous technical analyses to support decisions Characterizes uncertainty in scientific information Facilitates a focused dialogue among scientists, decision makers, and the general public Maintains i separation between risk assessment (scientific evaluation of data and models) and risk management (making decisions concerning risk)
5 EPA Ecological Risk Assessment Guidance Describes a Process, not a Recipe Data, methods, and models are problem and site specific The objective is to provide timely, scientifically-based ca technical ca advice to decision makers and the public Risk assessment may be either qualitative or quantitative
6 Key terms: Assessment endpoint an explicit expression of the environmental value that is to be protected Measurement endpoint A measurable ecological characteristic that is related to the valued characteristic chosen as the assessment endpoint. Can include measures of effect and/or measures of exposure
7 National Goal of Superfund is to Select Remedies Protective of Human Health and the Environment Environment: As defined by section 101(8) of CERCLA, environment means (A) the navigable waters, the waters of the contiguous zone, and the ocean waters of which the natural resources are under the exclusive management authority of the United States under the Magnuson Fishery Conservation and Management Act (16 U.S.C et seq.); and (B) any other surface water, ground water, drinking water supply, land surface or subsurface strata, or ambient air within the United States or under the jurisdiction of the United States.
8 Screening Level Assessment and Measurement Endpoints Screening level assessment endpoints are any adverse ecological effects on ecological receptors (plant and animal populations, communities, habitats and sensitive environments) Often expressed in terms of survival, reproduction and growth Screening level measurement endpoints are comparisons of media concentrations (or ingested doses) to conservative screening level benchmarks. Often non- site or species specific.


9 Aquatic Plants Direct contact, root absorption
10 Aquatic Animals Direct contact or ingestion


11 Aquatic Dependent Wildlife Ingestion, inhalation, and dermal absorption Pop Quiz: Is this an example of ingestion or inhalation?
12 Step 1: Preliminary Ecological Effects Evaluation Toxicity profiles: brief explanation of adverse effects Screening ecotox values or benchmarks Screening = conservative NOAEL (preferable for screening EcoRA) vs LOAEL NOAEL s not available for many media-chemical combinations Screening values ARAR s
13 Step 2: Preliminary Exposure Estimate and Risk Calculation Exposure generally occurs in two ways: 1. Environmental concentration in soil, sediment, surface water, air, or bioaccumulated in tissues of receptor. 2. Concentration in food: measured or modeled
14 Screening Level Risk Calculation HQ = EDI or HQ = EEC NOAEL TB Where: HQ = hazard quotient t EDI = estimated daily intake EEC = estimated environmental concentration* NOAEL = no observed adverse effects level TB (toxicity benchmark) = effect measure in environmental media * For Portland Harbor SLERA, EEC is maximum detected concentration
15 Hazard Quotients If Then... HQ 1.0 Adverse effect likely, l contaminant of potential ecological concern, forwarded to BERA HQ < 1.0 Contaminant alone not likely to cause adverse effect, but interpret based on availability of information for other chemicals with the same mechanism of toxic action
16 Portland Harbor Screening Level Ecological Risk Assessment (SLERA) Process 2004 Programmatic Work Plan, basis for subsequent sampling and monitoring studies February 2007 Round 2 data report from LWG to EPA, contained initial screen based on samples collected from Rounds 1 and 2 December 2007 EPA prepared standalone SLERA, our review and summary of screen in the Round 2 report February 2008 EPA sent draft problem formulation and analysis plan for baseline ecological risk assessment to LWG Summer 2009 LWG to submit BERA to EPA for review
17 Conclusions of LWG s Round 2 Screen and EPA SLERA There are many ecological receptors potentially at risk from elevated contaminant levels. A result of multiple chemicals in sediment, surface water, transition zone water, aquatic biota tissues, and diets of aquatic biota and aquatic-dependent wildlife EPA and LWG in close agreement on list of chemicals potentially posing unacceptable risk and receptors at risk
18 SLERA Results Chemicals whose maximum detected concentration in sediment, surface and transition zone water, tissue had HQ 1 forwarded to baseline ecological risk assessment (BERA) Results presented here are maximum hazard quotients (i.e. the worst case) from the EPA SLERA
19 SLERA Conclusions - Sediment 66 sediment chemicals had measured HQ 1.0 Metals - 11 Polycyclic aromatic hydrocarbons (PAH) 19 Insecticides 12 PCBs Semivolatile organics 18 Volatile organics 2 Dioxins/furans
20 SLERA Conclusions Sediment Contaminants with Largest Hazard Quotients Total PAH maximum HQ = 38,775 Total DDX maximum HQ = 3063 Trichloroethylene maximum HQ = 905 Total PCBs maximum HQ = 803 bis(2 (2-ethylhexyl) l) phthalate t maximum HQ = 483
21 SLERA Conclusions Surface Water 10 chemicals exceeded screening level benchmarks Zinc (max. HQ = 1.2) Benzo(a)anthracene (max. HQ = 4.1) and benzo(a)pyrene (max. HQ = 11) 4-chloro-3-methylphenol (max. HQ = 1.1) Total PCB (max. HQ = 1.2) 4 individual DDX compounds (max. HQ = 20 for sum of all DDX compounds)
22 SLERA Conclusions Transition Zone Water 53 chemicals exceeded screening level benchmarks 8 metals (max. HQ range = 1.3 for Cu to 1100 for Ba) 16 PAHs (max. HQ range = 13 for dibenz(a,h)anthraceneanthracene to 2700 for benzo(a) (a)pyrene 3 SVOCs (max. HQ range = 2.2 for dibenzofuran to 46 for 1,2-dichlorobenzene 6 insecticides (various DDX compounds, max. HQ = 3050) 2 herbicides (Dalapon (max. HQ = 1.2), Silvex (max. HQ = 44) 4.4) 16 VOCs (max. HQ range 1.1 for vinyl chloride to 870 for carbon disulfide) Cyanide (max. HQ = 4423) Perchlorate (max. HQ = 9833)
23 SLERA Conclusions Aquatic-Dependent Wildlife Ingested dose risks more complex to estimate, much work being done in BERA Spotted sandpiper p may be at risk from more chemicals than any other wildlife receptor HQ > 100 for dioxins/furans to spotted sandpiper pp and mink, total PCBs for mink (max. HQ = 178) and river otter Lead, PAHs also possible risk drivers to sandpiper from beach sediments Maximum DDT HQ is 26 for hooded merganser Most metal,,p phthalate, remaining insecticide HQs <10 for all wildlife receptors
24 SLERA Conclusions Aquatic Biota Tissues 19 chemicals exceeded screening level benchmarks 8 metals (max. HQ range between een Cr HQ = 1.0 in largescale sucker and Cu HQ = 6.5 in Lumbriculus variegatus) Tributyltin (max. HQ = 34 in Lumbriculus) Total PCB (max. HQ = 6.9 in smallmouth bass) 4,4 -DDD (max. HQ = 20 in Lumbriculus) Total DDX (max. HQ = 11 in sculpins) 3 phthalates (max. HQ = 223 for bis(2-ethylhexyl) phthalate in smallmouth bass) Hexachlorobutadiene, β-hch and δ-hch all had max. HQ values 2.0 in sculpins
25 SLERA Conclusions Aquatic Biota Tissues None of the 19 chemicals posing unacceptable risks to aquatic biota found in all species analyzed None of the tested aquatic species contained all 19 chemicals at concentrations exceeding screening level benchmarks Risk evaluation of contaminants in aquatic species a major emphasis of the human health risk assessment, but a relatively new development in ecological risk assessment
26 Example of Fish Tissue TRV Derivation for BERA (not a Portland Harbor example) 100% 90% 80% 70% 60% Figure 1a. Cumulative distribution of final fish species LOERs for DDX. For BERA from BurrliOZ: 5 th %ile = 0.46 mg/kg, 10 th %ile = 0.68 mg/kg From SLERA: 5th %ile fish spp. LOAEL = 0.47 mg/kg From Dyer et al. (2000): Shephard 1998 TSC = mg/kg 5th %ile lit. TSC = 0.47 mg/kg bluegill coho salmon pond loach goldfish Atlantic cod brook trout fathead minnow Percentile 50% 40% 30% 20% green sunfish pumpkinseed rainbow trout sailfin molly Chinook salmon winter flounder cutthroat trout 10% 0% pinfish lake trout Whole Body DDX, mg/kg wet wt.
27 Sediment Toxicity Testing Measured sediment toxicity to two benthic invertebrate species using two different tests/species in 230+ sediment samples from Rounds 1 and 2 Chironomus decorus (formerly C. tentans) ) survival Chironomus decorus biomass Hyalella azteca survival Hyalella azteca biomass One way to handle toxicity of mixtures in the EcoRA, chemicals for which EcoRA tissue TRVs cannot be derived (e.g. PAHs), or where no specific chemical(s) stand out as risk drivers


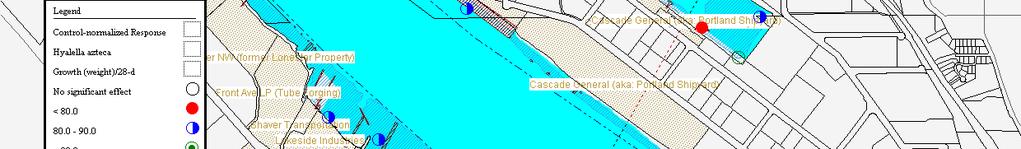

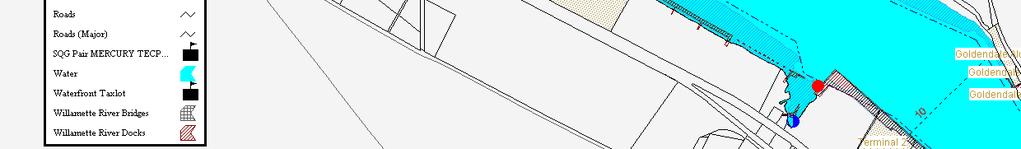
28 Example of Toxicity Test Results
29 Scientific Management Decision Point A point during the risk assessment process when the risk assessor communicates results of the assessment at that stage to a risk manager. At this point the risk manager determines whether the information is sufficient to arrive at a decision regarding risk management strategies and/or the need for additional information to characterize risk.
30 Possible Results of Screening Level Ecological Risk Assessment One can potentially eliminate from analysis in BERA Particular chemicals or classes of chemicals Particular media as sources of contaminant exposure Particular ecological receptors as credible assessment endpoints Ecological risks as basis for remedial action Decide to move forward with removal action Continue to Step 3 (i.e. perform a baseline ecological risk assessment)
31 What Gets Passed Through to the BERA? Chemicals in media that exceed screening level benchmarks (even if only one sample) Media / receptors without quantitative data, other data gaps that need to be filled Detected chemicals without toxicity benchmarks Detected chemicals whose detection limits exceed toxicity benchmarks
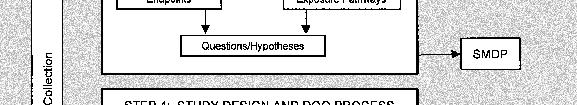
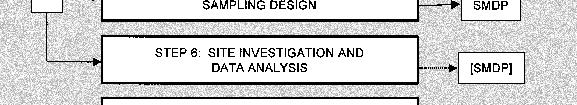
32 Portland Harbor EcoRA Process: Baseline Ecological Risk Assessment (BERA) 1.Screening site visit, problem formulation and screening toxicity evaluation 2.Screening exposure estimate and screening risk calculation 3. Problem Formulation 4. Study Design & DQOs 5. Sampling plan verification 6. Site investigation 7. Risk Characterization 8.Risk Management
33 Problem Formulation is: the first phase of ecological risk assessment and establishes the goals, breadth, and focus of the assessment (EPA 1992) Goals defined by statute, regulation, public scoping, or other policy considerations Breadth defined by the initial data review Focus defined by assessment endpoints An essential planning activity defines data collection needs and assessment approach A major cause of failure in risk assessments poor planning poor data poor decisions
34 After the Problem formulation step there is a decision point Agreement on four points: Assessment endpoints Exposure pathways Risk questions Conceptual site model Without agreement on the above between risk assessors, risk managers, and other parties, cannot select measurement endpoints
35 Portland Harbor BERA 13 Assessment Endpoints Survival, growth and reproduction of: 1. Aquatic plants 2. Benthic macroinvertebrates 3. Bivalves 4. Decapods 5. Invertivorous fish 6. Omnivorous fish 7. Piscivorous fish 8. Detritivorous fish 9. Amphibians 10. Piscivorous birds 11. Omnivorous birds 12. Invertivorous birds 13. Aquatic-dependent mammals
36 Criteria that any measurement endpoint should meet Ecological relevance Unambiguous operational definition Accessibility to prediction and measurement Susceptibility to hazardous substances
37 Another Scientific Management Decision Point Risk assessors and risk managers agree on: Measurement endpoints Site investigation methods Data reduction and interpretation techniques Move to next steps
38 Portland Harbor BERA Measurement Endpoints We have 31 measurement endpoints The 31 measurement endpoints have a combined 49 lines of evidence
39 End Products of Ecological Risk Assessment Which ecological receptors are at risk? What chemicals pose unacceptable risks? Where within the site are areas of unacceptable risk found? Uncertainties in the risk assessment Recommend cleanup numbers protective of ecological receptors Often described as a threshold for effects on the assessment endpoint as a range between concentrations posing no ecological risk and the lowest contaminant concentrations identified as likely to produce adverse ecological effects
40 Risk Management for Portland Harbor Last Step of the BERA Done by risk managers (project managers), not risk assessors (I don t get to pick the final cleanup values or the remedy) Evaluates several factors in addition to ecological risks (e.g. human health risks) Risk management decision finalized, described and justified in Record of Decision for the site
41