Potential Climate Change Impacts on the Chesapeake Bay
|
|
|
- Marilyn Norman
- 5 years ago
- Views:
Transcription
1 Potential Climate Change Impacts on the Chesapeake Bay Raymond Najjar, Christopher R. Pyke, Mary Beth Adams, Denise Breitburg, Carl Hershner, Michael Kemp, Robert Howarth, Margaret R. Mulholland, Michael Paolisso, David Secor, Kevin Sellner, Denice Wardrop, and Robert Wood Estuarine, Coastal and Shelf Science, 86, 2010, 1-20

2 Climate change and estuaries Precipitation, evapotranspiration Runoff Winds, Heat & CO 2 Sea-level rise

3


4 Chesapeake outline Climate and hydrology Watershed sediment and nutrient fluxes Bay physics, biogeochemistry, vascular plants, fish, and shellfish Policy & research implications
5 Climate and hydrology
6 Annual IPCC Emissions scenarios HIGHER A1FI (CO 2 = 940 ppm) HIGHER A2 (CO 2 = 840 ppm) actual emissions pre-industrial CO 2 = 280 ppm LOWER B1 (CO 2 = 550 ppm) Commonly proposed target: 20% of current emissions by 2050 estimated warming of 2 C. Source: Nakićenović & Swart (2000)
7 Chesapeake Bay is warming Source: CBP & VIMS archive, Kaushal et al. (2010)

8 Bay watershed temperature projections by various climate models 2100 projections under A2 emissions scenario Najjar et al. (2009)


9 Multi-model-average Bay watershed temperature projections under various emissions scenarios


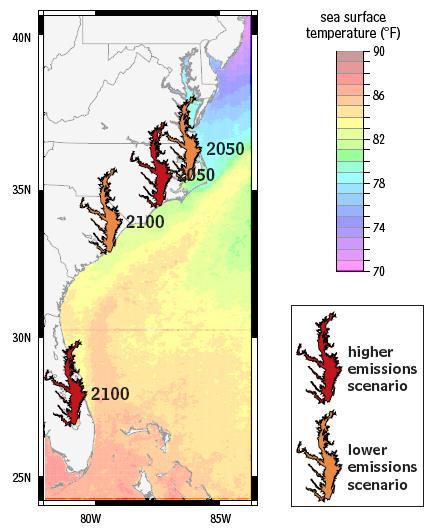
10 Moving estuary analogue: summer temperature change A2 Boesch (2008) B1
11 Bay watershed precipitation projections by various climate models 2100 projections under A2 emissions scenario Najjar et al. (2009)


12 Future changes in mid-atlantic streamflow Delaware River at New Hope, PA FindTarget.com Very uncertain: -40% to +30% by late century Due to compounded uncertainty in evapotranspiration and precipitation change Likely increases in winter and spring flow Likely more episodic
13 Sea level change in Chesapeake Bay Rates ~ 3-4 mm yr -1 (Global ~2 mm yr -1 )
 Chesapeake: 0.7 to 1.")
14 Global sea-level change Added semi-empirical model uncertainty Added GCM uncertainty Historical observations and model Different greenhouse gas scenarios Rahmstorf (2007) Chesapeake: 0.7 to 1.6-m rise by 2100 (includes subsidence)
15 Watershed sediment and nutrient fluxes
16 Annual sediment load to Bay as function of annual flow ( ) +130% +30%
 synthesis of 16 Northeast US watersheds Fraction of net anthropogenic nitrogen inputs (NANI) to a watershed")
17 Howarth et al. (2006) synthesis of 16 Northeast US watersheds Fraction of net anthropogenic nitrogen inputs (NANI) to a watershed that is exported to its estuary +65% +15% But warming could decrease NANI (Schaefer and Alber, 2007)
18 Impacts on the Bay

19 Modeled Salinity in the Chesapeake Bay 2-m sea-level rise 1-m sea-level rise Current sea level Li et al. (2010)
, Hilton et al.")
20 Estuarine physics Increase in: Salinity Tidal range Summer stratification Residual circulation Salinity variability Due to an increase in: Sea level Sea level Spring streamflow Spring streamflow Multiple factors Sources: Zhong et al. (2008), Hilton et al. (2008), Hagy (2002)
 January-May Average Susquehanna River Flow (m 3 s")
21 Annual hypoxic volume days (10 9 m 3 days) Hagy et al. (2004) January-May Average Susquehanna River Flow (m 3 s -1 )


22 Multiple impacts on bottom-water dissolved oxygen Higher spring flows Higher temperature Higher CO 2 More stratification More photosynthesis More respiration Lower oxygen solubility Decreases in bottomwater oxygen
 in the lower Choptank estuary Analysis by M.")
23 Secchi depth Submersed aquatic vegetation (SAV, primarily Ruppia maritima) in the lower Choptank estuary Analysis by M. Kemp streamflow
24 Eelgrass coverage near Gloucester Pt SAV Coverage (%) Moore & Jarvis (2008) Distance from shoreline (m)

 SAV decrease")
25 Multiple impacts on Eelgrass Higher spring flows Higher temperature Higher CO 2 Decreased clarity Decreases in bottom-water oxygen (Palacios and Zimmerman, 2007) SAV decrease SAV increase
")
26 Wu et al. (2009)
: 1700 km 2 land in VA and MD lie below 0.")


 Development limits")
27 Bay vascular plants: wetlands Wu et al. (2009): 1700 km 2 land in VA and MD lie below 0.7-m contour; ~half is wetlands Greater sea level variability more frequent flooding Rate of sea-level rise is increasing; not clear if accretion rates can keep up CO 2 increases accretion rates of S. Olneyi (Megonigal 2008) Development limits landward migration Salinity and temperature also important

 Miller et al.")
28 Impact of ocean acidification on oyster larvae (C. virginica) calcification pco 2 (matm) Miller et al. (2009) Smithsonian Marine Station
 and negative (oyster")
29 Shellfish Acidification has the potential to reduce calcification of some shellfish Commercially important soft clam Mya arenaria near southern distribution limit Over-wintering impacts positive (juvenile survival, blue crabs) and negative (oyster pathogens)
30 Science summary Climate projections by 2100: warmer (2-6º C), wetter winter and spring, greater storm intensity, higher sea level ( m). Precipitation (and streamflow) projections are generally within interannual variability; temperature is not Future fluxes of water, nutrients, and sediments from watersheds highly uncertain
 Likely Impacts: Increase in submergence of estuarine wetlands Increase in salinity variability Increase in harmful")
31 Science summary (cont.) Likely Impacts: Increase in submergence of estuarine wetlands Increase in salinity variability Increase in harmful algae Increase in hypoxia Reduction of eelgrass Substantially altered interactions among trophic levels

32 Policy implications Climate change is likely to dramatically alter Chesapeake Bay and efforts to restore it Climate change and impacts over next 30 years nearly independent of emissions adaptation is critical Climate change and impacts beyond 2040 depend strongly on emissions over next 30 years mitigation is critical
 that can capture the likely non-linear responses of the Chesapeake Bay system to climate variability")
33 Research needs Improved precipitation and streamflow projections for the Bay watershed Whole-system monitoring and modeling (supplemented by process studies) that can capture the likely non-linear responses of the Chesapeake Bay system to climate variability and change.

34 Thank you
35 References Boesch, D.F., (editor) Global Warming and the Free State: Comprehensive Assessment of Climate Change Impacts in Maryland. Report of the Scientific and Technical Working Group of the Maryland Commission on Climate Change. University of Maryland Center for Environmental Science, Cambridge, Maryland. Hagy, J.D., Boynton, W.R., Keefe, C.W., Wood, K.V., Hypoxia in Chesapeake Bay, : Longterm change in relation to nutrient loading and river flow. Estuaries 27, Hilton, T.W., Najjar, R.G., Zhong, L., Li, M., Is there a signal of sea-level rise in Chesapeake Bay salinity? Journal of Geophysical Research 113, C09002, doi: /2007jc Howarth, R.W., Swaney, D.P., Boyer, E.W., Marino, R., Jaworski, N., Goodale, C., The influence of climate on average nitrogen export from large watersheds in the Northeastern United States. Biogeochemistry 79, Kaushal, S.S., Likens, G.E., Jaworski, N.A., Pace, M.L., Sides, A.M., Seekell, D., Belt, K.T., Secor, D.H., Wingate, R., Rising stream and river temperatures in the United States. Frontiers in Ecology and the Environment doi: / Miller, A.W., Reynolds, A.C., Sobrino, C., Riedel, G.F., Shellfish face uncertain future in high CO2 world: Influence of acidification on oyster larvae calcification and growth in estuaries. PLoS ONE 4, 1-8. Najjar, R.G., Pyke, C.R., Adams, M.B., Breitburg, D., Hershner, C., Kemp, M., Howarth, R., Mulholland, M., Paolisso, M., Secor, D., Sellner, K., Wardrop, D., Wood, R., Potential climate-change impacts on the Chesapeake Bay. Estuarine, Coastal and Shelf Science 86, Najjar, R.G., Patterson, L., Graham, S., Climate simulations of major estuarine watersheds in the Mid- Atlantic region of the United States. Climatic Change 95, Rahmstorf, S., A semi-empirical approach to projecting future sea-level rise. Science 315, Schaefer, S.C., Alber, M., Temperature controls a latitudinal gradient in the proportion of watershed nitrogen exported to coastal ecosystems. Biogeochemistry 85, Wu, S.-Y., Najjar, R.G., Siewert, J., Potential impacts of sea-level rise on the Mid- and Upper-Atlantic Region of the United States. Climatic Change 95, Zhong, L., Li, M., Foreman, M.G.G., Resonance and sea level variability in Chesapeake Bay. Continental Shelf Research 28,

36 Extra Slides


37 Projected surface temperature changes (A1B, minus ) Multi-model ensemble mean Meehl et al. (2007)

 15-model mean.")

38 Projected surface runoff changes (A1B, minus ) Meehl et al. (2007) 15-model mean. Stippling: >80% of models agree on sign of change.
 Meehl et al.")
39 Change in precipitation intensity (A1B, minus ) Meehl et al. (2007)
 High emissions (A2) 10 5 Low emissions (B1) High emissions (A2) 0-5 -10 2046-2065 2081-2100 Lambert & Fyfe")
40 Percent change Changes in extratropical winter storms in the Northern Hemisphere Total storms Intense storms Low emissions (B1) High emissions (A2) 10 5 Low emissions (B1) High emissions (A2) Lambert & Fyfe (2006)
41 Precipitation mm month PA precipitation: GCMs vs. observations Precipitation Model Average Observed Jan Feb Mar Apr May Jun Jul Aug Sep Oct Nov Dec Month Shortle et al. 2009

42 Mid-Atlantic temperature and precipitation change synthesis Interannual variability Najjar et al. (2009)

 1991-2000 average 1º C")
43 Fish and Shellfish Temperature-O 2 synergistic impact on fish Habitat suitability for young-of-theyear Atlantic sturgeon in bottom waters of the Chesapeake Bay during July (Niklitschek and Secor, 2005) average 1º C warming