Why all (Urban) Hydrology is Social Hydrology? Evidence from Bangalore, India
|
|
|
- Maximilian Austin
- 5 years ago
- Views:
Transcription
1 Why all (Urban) Hydrology is Social Hydrology? Evidence from Bangalore, India * D.Malghan, V. Mehta, R. Gowswami, E. Kemp-Benedict, S. Muddu, D. Wong (*To whom all correspondence must be addressed: dmalghan@iimb.ernet.in, dmalghan@princeton.edu) Trottier Institute for Sustainability in Engineering and Design, McGill University October 29 th 2014
2
3 Social Hydrology in Bangalore 101 Bangalore, Background Drivers: (Short-term) average rainfall: 850 mm City Area: ~ 700 Sq. Km Total rainfall: 1630 MLD (million liters a day) Bangalore, Anthropogenic Drivers: Surface water import: 1400 MLD (85% of rainfall) Groundwater extraction:?? Artificial recharge rates:??


4 Metabolic Urbanism: What do we not see on these maps?
5 Bangalore (like any other city) is a living organism This is from my nephew s 1 st grade science book Living things breathe Living things need food Living things excrete Living things grow (usually only for a part of their lives) Living things die
6 The Problem We understand a lot about Bangalore s circulatory system The flow of rupee and (especially) dollar through the city. The circulatory system is what economics and business is interested in. However, what about the digestive system? What does Bangalore consume? What does Bangalore excrete?
7 What are these metabolic flows? Food (Organic waste and sewerage) Energy (air pollution) Water (BWSSB) Metals and plastic (recyclable waste) Metabolic flows share a two-way relationship with the circulatory system
8 Three ways to characterize metabolism Social Justice How are the flows distributed between different people in the city? Ecological sustainability What volume of flow is sustainable? Economic Efficiency How are the flows distributed between different activities in the city?
9 Bangalore as a living organism is sick and unhealthy on all three counts The political economy of distribution is fraught with inequities on multiple dimensions Most metabolic flows are not physically sustainable The flows are often not economically efficient either
10 How has the city grown? Year Population (million) Density (persons per sq. km) Built-up area (% urban footprint) ,465 20% ,990 26% ,997 39% ,545 69% ,142 Na 2014 ~ 9.3 ~ 13,280 ~75% Sources: Census (2011); Iyer et al (2007); Mehta et al (2013)

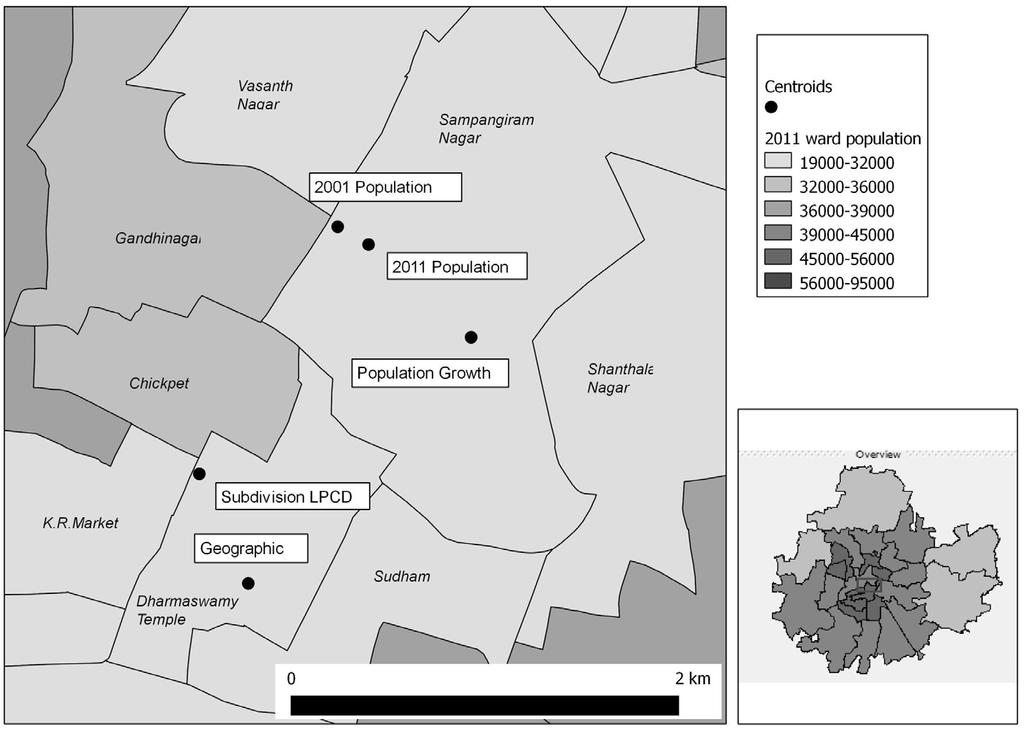
11 Where has the city grown?

12 Where has the city grown?

13
14
15

16
17 Source: BWSSB Surface Water Supply
18

19

20
21
22


23


24 Biophysical links Hessargatta L. Yelahanka L. T.G.Halli Bellandur L..
25 The water balance: people + ecosystem Natural state (no people) Altered state (people) pumping Stream flow ~ 10% Net Groundwater discharge ~ 10% Evaporation ~ 80% Surface watershed Rain 100% Percolation (Rainfall Recharge) ~ 10% Groundwater Aquifer Stream flow Net Groundwater discharge? Evaporation Rain Surface watershed External Water Supply Percolation (Rainfall Recharge + Leakage + Return)? Groundwater Aquifer
26 Biophysical impact: groundwater Plausible recharge scenarios: city as one unit Mm/y Natural Natural + Leakage Natural + Leakage + Return flow Rainfall recharge Piped supply Leakage (30%) Net pumping (150lpcd Domestic) Return Flow (30% of domestic consumption) Net recharge

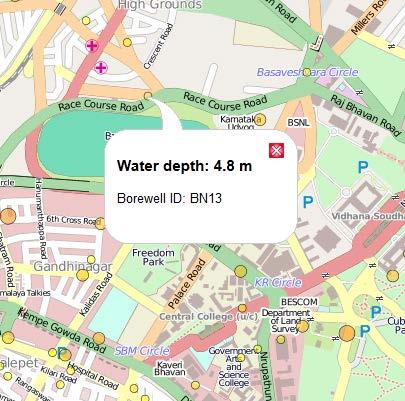
27 human-biophysical feedbacks Plausible change in groundwater head

28 human-biophysical feedbacks Plausible change in groundwater DEPTH; MONTHLY ANIMATION

29 Human-biophysical feedbacks: water quality Source: CGWB

30
31
32
33
34 Biophysical impact: Energy and Emissions Energy consumption from public water supply: Pumping from river sources and through the distribution network requires a total of 60 booster pumps, 52 reservoirs in the city 277 and close to 6000 km of pipeline. The total energy consumed is approximately 50 GWH/month Electricity charges alone account for 280 crore rupees annually (~9.2 million USD) ~ 450 Kilo-tones CO2 emissions (at 0.75 tco2/mwh)
35 Biophysical impact: Energy and Emissions Energy consumption from only domestic water use? Public supply ~ 220 GWh (less uncertain) Pvt pumping = 164 GWh/y (more uncertain) City-wide assumptions for private pumping (probably worst case) 150m constant depth 65% efficiency of pumping 150 lpcd total actual consumption Visit our online scenario explorer
36 Biophysical impact: Energy and Emissions CO2 from domestic water use Public supply = 165 Kt/yr Pvt pumping (worst case) = 118 t Co2/yr However, private pumping energy and emissions depend heavily on groundwater water depth. Range of 15kT/yr-118kt/yr Visit our online scenario explorer

37 Water: domestic consumption, million liters/year From public supply From private self-supply (pumping)
38 Energy consumption for domestic water supply, MWh/year From public supply From private self-supply (pumping)

39 Per Capita CO2 Emissions from domestic water consumption, kg/y From public supply From private self-supply (pumping)
40 Total Per Capita CO2 Emissions from domestic water consumption, kg/y
41 Uncertainties Uncertain knowledge today We do not know extraction rates and demand by source, other than piped supply (e.g., tankers, private borewells, local water bodies), or how much is being pumped from what depth We do not know leakage rates from piped supply with certainty We only have partial information about the groundwater level We do not know return flows and consumptive use Uncertain futures Changing economic opportunities (high-tech, manufacturing) Growing population and expanding city Changes in the Cauvery and Arkavathy watersheds beyond the city boundaries Attitudes toward reclaimed water, PPP arrangements, etc.
42 Uncertain Futures: Scenarios Evaluate system performance over a range of plausible conditions; different from traditional design event approach Explicitly recognize that critical uncertainties highimpact and high-uncertainty drivers and events influence the system Rely upon two way communication with stakeholders to capture their understanding of the system and the way in which they evaluate competing goals Can result in robust decisions strategies that are least likely to fail across a range of plausible futures

43 Don t let expectations of the future be dictated by your experience of the present
44 Scenarios vs. Sensitivity Analysis Scenarios are distinguished from each other by critical uncertainties Critical uncertainty: High uncertainty High impact Impact Low High Critical Trends Scenarios Uncertainties Perturbations Variations Low Uncertainty High
45 A list of possible values for each of the critical uncertainties Scenario Possibilities Typically 2-4 per critical uncertainty Should be distinct possibilities
46 For each critical uncertainty, choose one possibility Each combination of possibilities labels a scenario Building a Framework

47 The User s Mental Model Becomes Part of the Model
48 Control Panel Mockup for Scenario Explorer
49 Output Example

50 Tools for Integrated Water Resources Management Will retail customers practice conservation? Demand side models Will recreation remain compatible with future operations? Recreational use surveys with future projections Will groundwater remain viable? Groundwater flow and transport models Will hydropower management change in response to shifts in the market? Energy policy analysis with energy sector forecast models Will the hydrology change? Hydrology models with land use projections How will climate change? Climate models How much will new residential construction increase demand? Regional economic models Will industrial discharges change? Regulatory and emerging technology analysis with industry Will this fish be listed for protection? Habitat and species lifecycle models with Ecosystem databases Can we tap into a new supply? River hydraulic and contaminant transport models with water Will agriculturecompete for shared water supplies or become a potential source? Agricultural production models with water rights database

51 WEAP Network Schematic GIS Tool Model Building Intuitive GIS-based graphical interface Scenario Building Graphs & Maps


52 Putting it All Together