Section 1 - Introduction...7. Section 2 - Raw Water Supply Section 3 - Water Treatment Section 4 - Water Distribution System...
|
|
|
- Marshall Strickland
- 5 years ago
- Views:
Transcription

1
2 Table of Contents Section 1 - Introduction Population Growth Service Area Past Population Projected Population Growth Water Demands Past Water Demands Future Water Demands Utility Elements...10 Section 2 - Raw Water Supply Existing System Description Future Needs and LOS Planned Improvements...14 Section 3 - Water Treatment Existing System Description Planned Improvements Treatment Plant Operations...17 Section 4 - Water Distribution System Existing System Description...18 City of Durango Comprehensive Plan Update 2
3 4.2 Future Growth Scenarios Water Demands Model Creation Evaluation Criteria Level of Service (LOS) City of Durango Standards and Specifications AWWA M Evaluation Results Minimum Pressures Maximum Velocities Fire Flows Recommended Infrastructure Existing System Improvements Plan Plus Scenario Improvements Growth Centers Scenario Improvements Compact Growth Scenario Improvements Ridges Basin Impacts to the Distribution System...31 Section 5 - Wastewater Collection Population Wastewater Flow Sewerage Facilities...37 City of Durango Comprehensive Plan Update 3
4 Section 6 - Wastewater Treatment City of Durango Wastewater Treatment Plant South Durango Sanitation District...38 Section 7 - References...39 City of Durango Comprehensive Plan Update 4
5 List of Figures Figure Water Distribution System... 8 Figure Service Area Population... 9 Figure Historical Treated Water Demands Figure Water Systems Figure Water Availability Figure Existing Water Distribution System Figure Existing Water System (2005 Demands) Minimum Pressures Figure Existing Water System (2005 Demands) Maximum Velocities Figure Existing Water System Available Fire Flow Figure Existing Water System (2005 Demands) Capital Improvements Plan Figure Plan Plus Growth Scenario Capital Improvements Plan Figure Growth Centers Scenario Capital Improvements Plan Figure Compact Growth Scenario Capital Improvements Plan City of Durango Comprehensive Plan Update 5
6 Table of Tables Table Historical Population Trends... 7 Table Future Growth Scenarios... 9 Table Historical Treated Water Demands... 9 Table Projected Treated Water Demands Table Additional Raw Water Supply Required Table Raw Water Supply Capital Improvements Table Existing WTP Components Table Future Raw Water Supply and Finished Water Production Rates Table Water Treatment Facility Capital Costs Table Storage Tank Details Table Demand Allocation Table Capital Improvement Plan Existing System Table Infrastructure for 1997 Plan Plus Scenario Table Infrastructure for Growth Centers Scenario Table Infrastructure for Compact Growth Scenario City of Durango Comprehensive Plan Update 6
7 Section 1 - Introduction The City of Durango is updating its Comprehensive Plan. Boyle Engineering has been retained by the City to assist in evaluating the water and wastewater systems. The purpose of this report is to identify the needed infrastructure to serve the future needs for the City. This section provides basic information regarding historical population, water demands and the water and wastewater utility elements of the City systems. 1.1 Population Growth Service Area The City of Durango currently provides water service to the areas shown on Figure The future service area is also shown on Figure Past Population The past population within the City limits of Durango and La Plata County based on US Census Bureau data is shown in Table Table Historical Population Trends Year Durango LaPlata County ,530 19, ,333 19, ,649 27, ,430 32, ,722 38, ,922 43, * 15,501 47,452 *Estimated by US Census Bureau City of Durango Comprehensive Plan Update 7
8 215 Union Blvd. Suite 500 Lakewood, CO W W W. B O Y L E E N G I N E E R I N G. C O M City of Durango Water Distribution System Existing Water Piping Future Service Area Existing Service Area FIGURE 1.1.1
9 Figure Service Area Population 25,000 20,000 Population 15,000 10,000 5, Projected Population Growth Year Boyle Engineering evaluated three options for growth in the Durango water planning area. These options are as follows: Table Future Growth Scenarios Growth Scenario Build-Out Population 1997 Plan Plus 44,883 Growth Centers 49,279 Compact Growth 39, Water Demands Past Water Demands The City has experienced the following historical water demands from its water treatment facility. Table Historical Treated Water Demands Average Max Day Demand Demand (MGD) (MGD) Annual Usage (BG) Year City of Durango Comprehensive Plan Update 9
10 Figure Historical Treated Water Demands Treated Water Demands (billon gallons) Future Water Demands Year Three future growth scenarios were evaluated for the City s Comprehensive Planning effort. During planning efforts the City and its consultants assigned land use classification within areas of the City s service area. Water usage for each type of land use assigned and is detailed in Section 3 Water Distribution System. The three growth scenarios are generally described as follows: Table Projected Treated Water Demands Treated Water Maximum Daily Demand (MGD) Ratio Max Day to Average Day Treated Water Average Daily Demand (MGD) Per Capita Water Usage (gpcd) Growth Scenario Build-Out Population 1997 Plan Plus , Growth Centers , Compact Growth , Utility Elements The major elements of the water and wastewater systems have been evaluated. These include raw water supply, water treatment, water distribution, wastewater collection and wastewater treatment. The criteria for evaluation, level of service (LOS) requirements, analysis for each element and recommended capital improvement plans are discussed. Figure includes a schematic view of major elements of the City s existing and planned water and wastewater systems. City of Durango Comprehensive Plan Update 10

11
12 Section 2 - Raw Water Supply The City has completed several studies over the last twenty-five years to evaluate methods for obtaining future raw water supplies. The most recent work, Water Supply Alternatives Investigation and Preliminary Engineering Study, by Boyle Engineering was completed in This study evaluated alternatives for securing a total water supply to serve a population of 40,000 or equivalent to a total treated maximum daily demand of 22 MGD. The work of this study has been utilized to evaluate the impacts for the future growth scenarios. Seven alternatives were originally evaluated ranging from participation in the Animas La Plata (ALP) Project to construction of facilities completely independent from the ALP Project. Early in the study it was identified that alternatives that included participation in the ALP project were far better economically than alternatives that did not involve participation in ALP. At this time the construction had begun on the ALP project and the remaining focus of the study was directed at the ALP alternatives. At the completion of the study one alternative was recommended and the City began implementation of this alternative. This section summarizes the key elements of the City s existing raw water supply system and the status of the implementation of the City s raw water supply program. 2.1 Existing System Description The City s raw water supply system relies on water from two sources: the Florida River and the Animas River. Currently, raw water is obtained preferentially from the Florida River, representing a supply of about 8.7 CFS. Water from the Florida River is conveyed by pipeline to Terminal Reservoir. Water needs in excess of this amount are obtained from the Animas River. Water from the Animas River is diverted at the 10 MGD (expandable to 15 MGD) Santa Rita pump station. The Santa Rita pump station pumps raw water from the Animas River to Terminal Reservoir through a 30-inch diameter pipeline. Water rights are available to the City to fully satisfy demands for the highest growth scenario population of 49,279. However, during periods of extreme drought there is potential that downstream bypass obligations prevent the City from diverting the needed water supply and additional storage is needed. Terminal Reservoir is a raw water storage reservoir having a nominal capacity of about 232 acrefeet (75.6 million gallons). The reservoir is situated at an elevation of about 6,950 feet. Terminal Reservoir provides water to the City s 14 MGD water treatment plant, situated adjacent to the reservoir. Treated water flows by gravity into the City s primary treated storage facility. City of Durango Comprehensive Plan Update 12
13 2.2 Future Needs and LOS The previous work identified a need for additional water supplies from the Animas River and more raw water storage. Figure shows a plot of the available supplies from the Florida River and Animas Rivers along with the City s demands for a future population of 40,000 for both average years and during the driest years on record. Figure Water Availability Supply and Demand - Average Year 4000 Average Flow (af/month) Demand Florida Supply Animas Supply Total Supply 0 Jan Feb Mar Apr May Jun Jul Month Aug Sep Oct Nov Dec Supply and Demand - Dry Year 4000 Average Flow (af/month) Demand Florida Supply Animas Supply Total Supply 0 Jan Feb Mar Apr May Jun Jul Month Aug Sep Oct Nov Dec City of Durango Comprehensive Plan Update 13
14 In most average years there is sufficient water in the two rivers to meet the City s needs without additional storage. However, in drought years similar to 2002, there are times when there is not sufficient water available in the two rivers to meet the City s needs. For the purpose of this analysis it has been assumed that the desired LOS is for the City to have sufficient raw water supply to meet projected peak demands at all times. Based on the 2003 study the City purchased on option to obtain 3,800 AF of supply (equivalent to 1,900 AF of depletions) to provide water supply for a population up to 40,000. Since some of the growth scenarios project populations greater than 40,000 the City will need to acquire additional storage under these scenarios. Based on driest years on record the City will need the following additional water supply and storage from the Animas River in a similar dry year. Table Additional Raw Water Supply Required Current City Option Additional Supply Needed Growth Scenario ALP Depletions (AF) ALP Supply to be Purchased (AF) ALP Depletions* (AF) ALP Supply to be Purchased* (AF) 1997 Plan Plus 1,900 3, ,300 Growth Centers 1,900 3,800 1,200 2,400 Compact Growth 1,900 3, * If additional ALP Participation cannot be purchased, this supply will need to come from other sources, such as a new Horse Gulch Reservoir. 2.3 Planned Improvements The most cost effective way to deliver raw water to the City s existing and future water treatment plants includes participation in the ALP project. Based on the 2003 study, the City has entered a contract to purchase 1,900 acre-feet of depletions (equivalent to 3,800 acre-feet of supply). The City has an option to purchase this water when it becomes available, which is currently projected for Additional water taken from the Animas River will be delivered using the Santa Rita pump station. The ALP project will consist of a diversion structure and the Durango pump station on the Animas River, just downstream of the City s Santa Rita pump station. The Durango pump station will pump water to the new Ridges Basin Reservoir. The reservoir will include an outlet pipe in the dam that will discharge water into one of the local drainage basins allowing flow back into the Animas River. By participating in the ALP Project, the City can obtain water from one of two methods. The Durango pump station is being constructed with a discharge pipe connection that the City can connect to its existing 30-inch pipeline leading to Terminal Reservoir. Under most conditions, the City can utilize one of the pumps in the station to pump water directly to Terminal Reservoir at approximately 14 cubic feet per second. This is anticipated to be the preferred mode of City of Durango Comprehensive Plan Update 14
15 operation, because the power cost of this pumping (due to connection to the Western Area Power Administration system) is projected to be significantly less than the local power provider supplying the Santa Rita pump station. The City can also obtain water from the Ridges Basin Reservoir. The best utilization of this water involves constructing a new water treatment plant downstream of Ridges Basin reservoir and constructing a 24-inch pipeline from the reservoir outlet to the treatment plant. Both existing and potential future components of the raw water supply system are shown in Figure Capital costs for the needed improvements along with the anticipated date needed for completion are listed in Table The City only has firm commitments for 3,800 AF of supply from the ALP Project. Additional supply would have to be obtained from other participants of the ALP Project, if they are willing to sell them. If additional ALP supply is not available, the City will have to proceed with their own reservoir supply project, such as the Horse Gulch alternatives identified in previous studies. For the purposes of this report, the cost of Alternative 7 in the 2003 report has been adjusted for 2006 costs and is used for estimating the additional supply costs outside of the ALP Project. However, additional study should be completed in the future to determine if that is the best source of water. Table Raw Water Supply Capital Improvements Anticipated Item Capital Cost (2006) 1 Completion Date Durango Pump Station Modifications - Paid in 2005 Piping from Durango Pump Station to existing pipeline $286, (Approximately 2,000 feet of 24 pipeline) Pipeline from Ridges Basin Reservoir to new water $1,100, treatment plant (approximately 7,600 feet of 24 pipeline) ALP Participation Current Commitment by the City $7,300, ,900 acre-feet of Depletions/3,800 acre-feet of supply 2 Future ALP Participation Anticipated Capital Cost Depletions Supply (2006) 1 Completion Plan (AF) (AF) Date Plan Plus Growth Scenario 650 1,300 $4,700,000 After 2030 Growth Centers Growth Scenario ,400 $8,600,000 After 2030 Compact Growth Scenario 0 0 $0 After 2030 Notes: 1. Capital Costs include engineering, administration, land acquisition and a 25% contingency. 2. ALP participation funding has been placed in escrow for payment upon completion. City of Durango Comprehensive Plan Update 15
16 Section 3 - Water Treatment 3.1 Existing System Description The City of Durango operates a conventional water treatment facility located at Terminal Reservoir. The existing facility was upgraded in 2006 to a design flow of 14 MGD. A summary of the physical characteristics of the Terminal WTP is included as Table Table Existing WTP Components Component Description Size Terminal Reservoir Volume 75.6 million gallons Maximum Water Depth 22 feet Rapid Mix Volume Train 1 1,565 gallons Volume Train 2 11,474 gallons Flocculation Basins Volume Train 1, 1 st stage 31,977 gallons Volume Train 1, 2 nd stage 31,977 gallons Volume Train 2, 1 st stage 68,845 gallons Volume Train 2, 2 nd stage 68,845 gallons Volume Train 2, 3 rd stage 68,845 gallons Sedimentation Basins Volume Train 1 298,450 gallons Volume Train 2 261,800 gallons Filters Surface Area (Filters 1 4) 497 square feet/filter Surface Area (Filters 5 8) 316 square feet/filter Clearwell Volume 300,000 gallons Storage Tank Volume 7.2 million gallons 3.2 Planned Improvements Future required production rates could be met through expansion of the existing water treatment plant, construction of a new water treatment plant, or a combination of new and expanded facilities. Table lists the estimated raw water flow and finished water production rates based on various future growth scenarios. City of Durango Comprehensive Plan Update 16
17 Table Future Raw Water Supply and Finished Water Production Rates 1997 Plan Plus Scenario Growth Centers Scenario Compact Growth Scenario Plant Influent (MGD) Finished Water (MGD) Plant Influent (MGD) Finished Water (MGD) Plant Influent (MGD) Finished Water (MGD) Terminal Ridges Basin Totals Production to sustain future growth would be phased with development in the service area. A new treatment facility downstream of Ridges Basin Reservoir could be either conventional or membrane treatment. With pretreatment unit processes and post treatment chemical addition, the conceptual level capital costs for a new treatment facility are estimated at around $2.0M per MGD of raw water treated. Facility Table Water Treatment Facility Capital Costs 1997 Plan Plus Scenario Growth Centers Scenario Compact Growth Scenario Plant Influent (MGD) Cost Plant Influent (MGD) Cost Plant Influent (MGD) Cost Ridges Basin 13.7 $27.5 M 17.6 $35.2 M 8.6 $17.2 M 3.3 Treatment Plant Operations Because the City s water demands vary significantly on a seasonal basis, it is envisioned that this new plant will serve as a peaking plant to meet demands above the capacity (14 MGD) of the Terminal treatment plant. During low flow periods, operation of the new plant may not be required, especially immediately after construction of the new plant. The City will likely complete the construction of this plant in phases to match growing demands as close as possible. The new treatment plant will receive its water supply from Ridges Basin Reservoir from a pipeline connecting to the dam outlet. Plant influent will be controlled through this pipeline to produce the required output. A storage tank is required at the plant site to balance the flow into the distribution system. The cost for this storage tank is included in the Water Distribution System section. City of Durango Comprehensive Plan Update 17
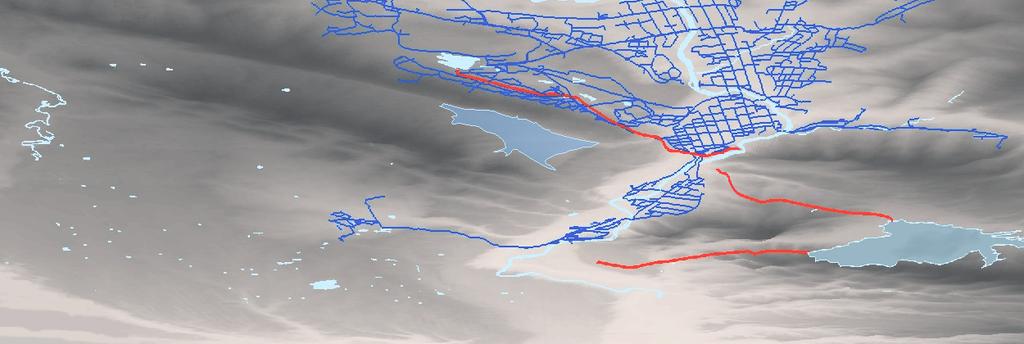
18 Section 4 - Water Distribution System 4.1 Existing System Description The City s water distribution system originates at a 7.2 million gallon water storage tank located at the existing water treatment plant site. The storage tank is supplied from the treatment plant s 300,000-gallon clear well. A relatively constant level is maintained in the storage tank to provide a consistent water supply to the distribution system. Four (4) pipelines, with diameters of 16 to 24 inches, carry water from the treatment plant tank to highly developed areas of the distribution system. The majority of the distribution system contains pipes with diameters ranging from 4- to 14-inches. The initial portions of the distribution system were constructed in the early 1900 s in downtown Durango, with additions being made as the town grew. A large majority of the piping in the distribution system is cast iron or ductile iron pipe. System storage is based on the operation and maintenance of 9 tanks with a storage capacity of 16.1 million gallons. The storage tank specifics are listed below. As highlighted in the table, five (5) booster pump stations operate within the system to move water to higher elevations. Figure shows the existing distribution system. Tank Table Storage Tank Details Storage Capacity Location Approximate Overflow Elevation WTP 7.2 City s Treatment Plant Site 6,911 Tanke Verde 3.0 North of Carol and East of W 3 rd Ave. 6,870 Wildcat Canyon 0.4 Wildcat Canyon / Hwy 160 6,855 South Durango 0.4 North of the Hwy 160 / Hwy 550 Jct. 6,770 Grandview* 4.0 North of High Llama Lane 7,136 Timberline* 0.1 Southeast of Whispering Pines Circle 7,120 Skyridge* 0.1 Southeast of Kennebec Drive 7,191 Hillcrest* 0.4 Southeast of Ophir Drive 7,105 Rockridge* 0.2 Northeast of Perins Vista Drive 7,111 * Note: Signifies tanks supplied utilizing a booster pump station. City of Durango Comprehensive Plan Update 18
19
20 4.2 Future Growth Scenarios Three future growth scenarios were evaluated for the City s Comprehensive Planning effort. The alternative growth scenarios are: 1997 Plan Plus (26.5 MGD, Max Daily Demand) Growth Centers (30.0 MGD, Max Daily Demand) Compact Growth (21.8 MGD, Max Daily Demand) 4.3 Water Demands Table shows demand allocation and lists maximum daily demand for the existing system and the three future growth scenarios. Diurnal curves were created based on peaking factor information provided by the City. Basin Existing Demands (MGD) Table Demand Allocation 1997 Plan Plus Scenario (MGD) Growth Centers Scenario (MGD) Compact Growth Scenario (MGD) A B C D E F G H I J K L M N O P Q R S T City of Durango Comprehensive Plan Update 20
21 U V W X Y Z AA Totals Model Creation In order to accurately evaluate distribution system hydraulics, a computer model was created utilizing GIS information and MWHSoft Inc. H2ONET 6.1 modeling software. Boyle received a distribution model from the City that included pipe size, pipe length, valves, fire hydrants, and associated elevations. Boyle conducted a cursory review of the model to confirm connectivity and to compare model attributes to existing GIS mapping. Figure shows the skeletonized model used as the basis for the hydraulic evaluations. 4.5 Evaluation Criteria Level of Service (LOS) The design criteria used in determining the ability or inability of the City of Durango s potable water distribution system to adequately deliver water demands, both normal supply demands and emergency fire demands, is based on the following documents: The City of Durango Development Standards for Public Improvements and Construction Specifications, Amended November Manual of Water Supply Practices, Distribution Network Analysis for Water Utilities M32, AWWA, 1 st edition, City of Durango Standards and Specifications Water Pressure 1. Water supplied to any new development shall not be less than 40 psi during peak hour consumption with all tanks operating one-half full. (City Development Standard, Section a.) It should be noted that 40 psi is not required under fire flow emergency conditions. City of Durango Comprehensive Plan Update 21
22 2. Water supplied to any new development shall not be greater than 110 psi under static conditions. Any new development unable to meet this requirement must supply individual pressure-reducing valves. (City Development Standard, Section b.) 3. Pressures in any main line shall not be greater than 180 psi under static conditions. (City Development Standard, Section c.) AWWA M32 Fire-flow demand and pressures According to the Insurance Services Office (ISO), fire flow demands should be superimposed on the average demand of the maximum day. Based on discussions with the City s staff, the fire flow criteria will be: 1. Residential Areas 1,500 gpm with a residual pressure of 20 psi 2. Non-residential Areas 2,500 gpm with a residual pressure of 20 psi Peaking Factors Typical ranges of peaking factors in distribution systems are as follows: 1. Peak hour / max day = Minimum hour / max day = System Deficiencies 1. Pipes having velocities greater than 5 feet / second under maximum daily demands will be considered deficient. 2. Pipes having head losses greater than 10 feet / 1000 feet of pipe under maximum daily demands will be considered deficient. 3. Under maximum daily demands, pipes with large diameters (16-inches and greater) will be considered deficient if head losses exceed 3 feet / 1000 feet. It should be noted that the criteria listed above does not need to be met under fire flow emergency conditions. 4.6 Evaluation Results The hydraulic computer model was set to evaluate system performance over a 7-day period. Longer evaluation periods, also called extended period simulations (EPS), are useful in City of Durango Comprehensive Plan Update 22
23 determining the adequacy of system performance. An EPS allows system trends to be evaluated such as diminishing storage over time or the time of day that low pressures occur. It also allows for the accurate evaluation of system controls, such as pump run times and pressure reducing valve (PRV) settings. The evaluation of the City s distribution system evaluated the following performance characteristics. 1. Minimum Pressure during the EPS 2. Maximum Velocity during the EPS 3. Available Fire Flow with a 20-psi minimum residual pressure during the maximum average daily demand Minimum Pressures Based on the City s development standards, new construction should be designed and constructed to ensure a minimum water pressure of 40 psi is available to users. Minimum pressures during the 7-day extended period simulation (EPS) are shown on Figures which shows the existing system meets new construction criteria Maximum Velocities According to AWWA s M32, pipes with velocities in excess of 5 feet/second are considered deficient. Figure shows approximate maximum velocities in the existing distribution system. Based on the hydraulic modeling, it appears the existing system does not have any significant velocity concerns Fire Flows The hydraulic model was run to identify the available fire flow while still maintaining a 20-psi minimum residual pressure in the system. Generally accepted fire flow analyses place fire flows superimposed on maximum average daily demands. Figure shows the available fire flow under existing conditions. City of Durango Comprehensive Plan Update 23
24
25
26
27 4.7 Recommended Infrastructure Existing System Improvements Based on the hydraulic modeling analysis, the existing water distribution system functions well. Much of the system benefits from storage being delivered from higher elevations that results in adequate system pressures. The only of operational concern is the mixed commercial/light industrial developments near Tech Center, Burnett, and Rock Point Drives. With the installation of looped piping, these developments could be given added fire flow protection. Figure shows the pipes needed to meet the operational criteria for the existing system. Table lists the improvements and the anticipated capital cost. Table Capital Improvement Plan Existing System Item Length (ft) Diameter (in) Cost/LF Total Cost Tech Center Drive $85 $212,500 Total $212, Plan Plus Scenario Improvements Table 4.7.2, lists water infrastructure improvements needed to support the 1997 Plan Plus growth scenario. Figure shows the location of these improvements. Table Infrastructure for 1997 Plan Plus Scenario Facilities Item Capacity Cost Total Cost Wildcat Canyon (Second Tank) 400,000 gal. $1.00 per gal. $400,000 Wildcat Canyon Pump Station 160 HP $750/ HP $120,000 Basin V Booster Station 40 HP $750/ HP $30,000 Upgrade to Grandview Pump Sta HP $750/ HP $1,275,000 Ewing Mesa Storage Tank 4.5 M gal. $1.00 per gal. $4,500,000 Ridges Basin WTP Storage Tank 6 M gal. $1.00 per gal. $6,000,000 Subtotal $12,325,000 Piping Item Length (ft) Size (in) Cost/LF Total Cost Florida Rd Upsizing 2, $85 $247,000 Florida Rd 250 Street Looping $55 $132,000 Riverview/Florida, Basins N, S Upsizing 8, $85 $757,000 23rd Upsizing $55 $50,000 City of Durango Comprehensive Plan Update 27
28 Montview Crestview Looping $55 $31,000 Crestview Upsizing $55 $39,000 College/160 Upsizing 3, $120 $468,000 College 160 Looping $55 $14,000 Wildcat Canyon / Tech Center Drive 3, $85 $267,000 Wildcat Canyon / 160 Installation 10, $130 $1,387,000 East 8th Avenue 1, $85 $102,000 CR 237 / Basin J Supply Feed 2, $85 $213,000 Ewing Mesa 5,700 8 $55 $314,000 6, $85 $583,000 3, $130 $416,000 14, $145 $2,146,000 Basin V / La Posta Road Area 13, $85 $1,156,000 3, $130 $429,000 5, $175 $1,015, ,000 8 $55 $5,940,000 Basin Y / Grandview Area 2, $85 $230,000 15, $85 $1,275,000 31, $130 $4,030,000 14, $145 $2,030,000 1, $145 $160,000 1, $160 $272,000 7, $175 $1,365,000 Subtotal $25,068,000 Subtotal Facilities and Piping $37,393,000 Engineering & Administrative (20%) $7,479,000 Contingency (25%) $9,349,000 Total $54,221,000 City of Durango Comprehensive Plan Update 28
29 4.7.3 Growth Centers Scenario Improvements Table 4.7.3, lists water infrastructure improvements needed to support the Growth Centers Scenario. Figure shows the location of these improvements. Table Infrastructure for Growth Centers Scenario Facilities Item Capacity Cost Total Cost Wildcat Canyon (Second Tank) 400,000 gal. $1.00 per gal. $400,000 Wildcat Canyon Pump Station 160 HP $750/ HP $120,000 Basin V/La Posta Rd Booster Station 40 HP $750/ HP $30,000 Upgrade to Grandview Pump Sta HP $750/ HP $1,275,000 Ewing Mesa Storage Tank 4.1M gal. $1.00 per gal. $4,100,000 Ridges Basin WTP Storage Tank 8 M gal. $1.00 per gal. $8,000,000 Subtotal $13,925,000 Piping Item Length (ft) Size (in) Cost/LF Total Cost Florida Rd Upsizing 2, $85 $247,000 Florida Rd 250 Street Looping $55 $132,000 Riverview/Florida, Basins N, S Upsizing $85 $757,000 23rd Upsizing $55 $50,000 Montview Crestview Looping $55 $31,000 Crestview Upsizing $55 $39,000 College/160 Upsizing 3, $120 $468,000 College 160 Looping $55 $14,000 Wildcat Canyon / Tech Center Drive 3, $85 $267,000 Wildcat Canyon / 160 Installation 10, $130 $1,387,000 East 8th Avenue 1, $85 $102,000 CR 237 / Basin J Supply Feed 2, $85 $213,000 S. Bodo, Basin U Misc. Looping 4,300 8 $55 $237,000 5,700 8 $55 $314,000 Ewing Mesa 6, $85 $583,000 3, $130 $416,000 14, $145 $2,146,000 City of Durango Comprehensive Plan Update 29
30 13, $85 $1,156,000 Basin V / La Posta Road Area 3, $130 $429,000 5, $175 $1,015, ,200 8 $55 $5,731,000 18, $85 $1,573,000 Basin Y / Grandview Area 28, $130 $3,718,000 15, $145 $2,248,000 1, $160 $272,000 7, $175 $1,365,000 Subtotal $24,910,000 Subtotal Facilities and Piping $38,835,000 Engineering & Administrative (20%) $7,767,000 Contingency (25%) $9,709,000 Total $56,311, Compact Growth Scenario Improvements Table 4.7.4, lists water infrastructure improvements needed to support the Compact Growth Scenario. Figure shows the location of these improvements. Table Infrastructure for Compact Growth Scenario Facilities Item Capacity Cost Total Cost Basin V Booster Station 100 HP $750/ HP $75,000 Upgrade to Grandview Booster Station 1250 HP $750/ HP $938,000 Ewing Mesa Tank 4 M gal. $1.00 per gal $4,000,000 Ridges Basin WTP Storage Tank 4 M gal. $1.00 per gal. $4,000,000 Subtotal $9,013,000 Piping Item Length (ft) Size (in) Cost/LF Total Cost Florida Rd Upsizing 2, $85 $247,000 Florida Rd 250 Street Looping $55 $132,000 Riverview/Florida, Basins N, S Upsizing 8, $85 $757,000 23rd Upsizing $55 $50,000 Montview Crestview Looping $55 $31,000 Crestview Upsizing $55 $39,000 College 160 Looping $55 $14,000 City of Durango Comprehensive Plan Update 30
31 East 8th Avenue 1, $85 $102,000 CR 237 / Basin J Supply Feed $55 $138,000 S. Bodo, Basin U Misc. Looping 4,300 8 $55 $237,000 5,700 8 $55 $314,000 Ewing Mesa 6, $85 $583,000 3, $130 $416,000 14, $145 $2,146,000 13, $85 $1,156,000 Basin V / La Posta Road Area 3, $130 $429,000 5, $175 $1,015, ,200 8 $55 $5,731,000 18, $85 $1,573,000 Basin Y / Grandview Area 28, $130 $3,744,000 16, $145 $2,393,000 1, $160 $272,000 7, $175 $1,365,000 Subtotal $22,884,000 Subtotal Facilities and Piping $31,897,000 Engineering & Administrative (20%) $6,380,000 Contingency (25%) $7,975,000 Total $46,252, Ridges Basin Impacts to the Distribution System If the Ridges Basin Water treatment plant is constructed as discussed in Section 3, the distribution system may require additional improvements under all three growth scenarios. This is due to the elevation of the likely Ridges Basin treatment plant site, which is significantly lower than the existing Terminal Reservoir plant. The distribution system is currently divided into two pressure zones at the Bodo PRV shown on Figure If water demands from growth occur downstream of the Bodo PRV then the Ridges Basin water treatment plant can serve these demands by gravity. However, if the demands located upstream of the Bodo PRV exceed the capacity of the Terminal Treatment plant (14 MGD), then a booster pump station will be needed to deliver water from the Ridges Basin treatment plant to the higher pressure zone located on the upstream side of the Bodo PRV. City of Durango Comprehensive Plan Update 31
32
33
34
35
36 Section 5 - Wastewater Collection 5.1 Population The population served by the Durango wastewater collection system in 2005 was 17,000. The population served by the South Durango Sanitation District wastewater collection system in 2005 was less than 1,000. The Durango wastewater collection system has grown from a service population in 1980 of 13,800 to the present population. Most of the commercial and industrial property around Durango is served by the Durango wastewater collection system including Fort Lewis College, the Central Business District and Bodo Industrial Park. The South Durango Sanitation District was formed in Prior to that time, residences in the area were served with individual waste treatment facilities. The area south of Bodo Industrial Park is served by the South Durango Sanitation District including the properties around Wal- Mart. In 2006 Mercy Hospital relocated to the Grandview area, which is serviced in part by the South Durango Sanitation District. The entire population of the Durango wastewater collection system is served by the 3 MGD wastewater treatment facility located approximately one mile south of City Hall. The entire population of the South Durango Sanitation District is served by the 0.3 MGD wastewater treatment facility four miles south of City Hall. The existing wastewater collection system is typical of most city systems consisting of both gravity sewers and several force mains from lift stations. The gravity sewers exist in sizes from 6 inches diameter to 36 inches. The materials of the pipe vary widely throughout the system depending on the location of the sewer and when it was installed. Pipe materials include reinforced concrete, welded steel, cast iron and polyvinyl chloride (PVC). 5.2 Wastewater Flow Wastewater flows to the existing 3 MGD plant operated by the City amounted to an annual average daily flow of 1.98 MGD in In 2006 the average daily flow dropped to 1.82 MGD, owning primarily to the relocation of Mercy Hospital. Wastewater flows to the South Durango Wastewater Treatment plant averaged 0.10 MGD in There is no significant inflow or infiltration to the Durango wastewater collection system. It is unlikely that there is an opportunity to reduce per capita flows to the collection system. Similarly, there is little inflow or infiltration to the South Durango collection system and there is little chance of reducing per capita flows to that collection system. There is little change in wastewater flows from month to month in Durango. Annual variation in flows to the Durango wastewater system are the result of increased flows from tourist activities from May through August, and decreased flows from Fort Lewis College from May through City of Durango Comprehensive Plan Update 36
37 August. Flows to the South Durango Sanitation District treatment facilities are not greatly affected by tourism or college activities and the result is relatively little change in flows to the plant over the year. 5.3 Sewerage Facilities The wastewater collection system of the City includes 90 miles of lines. The wastewater collection system for the South Durango Sanitation District includes 12 miles of lines. No sewer lines in either system have flows that exceed or are approaching the capacity of the system. System upgrades to the South Durango collection system, including a replacement of the interceptor that serves the Wal-Mart area, is scheduled for construction in Lines to serve the proposed future development in the Grandview area were completed in There are three mains that feed the Durango wastewater treatment plant, the Animas River interceptor, the South Durango-Goeglein sewer main and the Bodo Park force main. The South Durango Sanitation District prepared a master plan in 2002 describing the proposed sewer system improvements and wastewater treatment facilities needed to service the district over the next 50 years. Two of the three mains that serve the Durango wastewater treatment plant, the Animas River interceptor and the Bodo Park force main are adequately sized to accommodate projected growth in the Durango sewer collection system. The South Durango-Goeglein sewer main is not adequately sized to accept the flows expected from the Ewing Mesa area of the City. City of Durango Comprehensive Plan Update 37
38 Section 6 - Wastewater Treatment 6.1 City of Durango Wastewater Treatment Plant The Durango Wastewater Treatment Plant is sized to treat 3 MGD. The flows in 2005 were 1.98 MGD. The hydraulic capacity of the piping at the plant is in excess of 6 MGD. It is the ability to meet CDPHE permit limitations that sets the capacity of the plant. The Durango Wastewater Treatment Plant is designed to provide secondary treatment of wastewater flows and is not designed for nutrient removal. Changes in regulations that may require nutrient removal or removal of other constituents beyond the capability of secondary treatment may require modifications to the treatment facilities. State regulations require that planning for expansion of treatment works begin when the flows to the treatment facility reach 80% of the capacity of the facility. The City of Durango should begin planning for expansion of the treatment facilities in South Durango Sanitation District The South Durango Wastewater Treatment Plant is sized to treat 0.3 MGD. The flows in 2005 were 0.1 MGD. The plant has been designed to allow for expansion in increments to a capacity of 1.0 MGD in the near future, however there is adequate area at the site of the existing plant to support a plant of greater capacity. The capital improvement plan for the expansion of the plant and collection system is based on cost estimates prepared in 2002 and requires payments of plant investment fees in the amount of $8,000 per single family equivalent connection. The financing of expansion of the wastewater treatment plant capacity may determine the rate at which facilities will be available for use. Wastewater capacity could limit the development potential within the Durango Planning area served by the South Durango Sanitation District. City of Durango Comprehensive Plan Update 38
39 Section 7 - References Boyle Engineering, 2003, Water Supply Alternative Investigation and Preliminary Engineering Study for Durango, Colorado Black and Veatch, Master Plan (BVMP) Report on Water Supply and Treated Water Facilities, for Durango, Colorado. Black and Veatch, 1982, Master Plan Report on Sanitary Sewer System, for Durango, Colorado. FLC Planning Group, LDR International and Vandegrift & Associates, Durango Comprehensive Plan Update. Gronning Engineering Company, Final Report, Water Supply Study, City of Durango. Harris Water Engineering, City of Durango Water Supply Feasibility Study, Report of Findings & Recommendations. U.S. Bureau of Reclamation, Animas La Plata Project, Colorado New Mexico. Final Supplemental Environmental Impact Statement (FSEIS), Vols. I and II. San Juan Engineering, Inc. 2002, South Durango Sanitation District Wastewater Masterplan. San Juan Engineering, Inc. 2003, Pre-Design Report for the 300,000 Gallon per Day Wastewater Treatment Plant Expansion for the South Durango Sanitation District. Colorado Department of Public Health and Environment, September 30, 2005 Public Notice of Completed Applications and Tentative Determination to Issue Waste Discharge Permit, for the City of Durango, Colorado. City of Durango Comprehensive Plan Update 39