Geopolitics, global demand and the quest tfor energy security
|
|
|
- Shona Walsh
- 5 years ago
- Views:
Transcription
1 Geopolitics, global demand and the quest tfor energy security Tuesday, April 27, 2010; 12:15 2:15 PM Moderator: Brian Sullivan, Anchor, Fox Business Network Speakers: Aris Candris, President and CEO, Westinghouse Electric Company Wesley Clark, General (ret.), U.S. Army; former Commander, NATO Anne Korin, Co-Director, Institute for the Analysis of Global Security; Chair, Set America Free Coalition Jay Pryor, Vice President, Business Development, Chevron R. James Woolsey, Venture Partner, VantagePoint Venture Partners; of Counsel, Goodwin Procter LLP; former Director, Central Intelligence Agency

2 Non-OPEC output: Headed for a dip in Incremental non-opec production Key non-opec increments, Canada Brazil U.S. GOM Kazakhstan U.S. ethanol & NGL Azerbaijan China Australia Other Europe Norway U.S. other crude U.K. Mexico Source: IEA.
3 Historic oil prices for the past 5 years Nominal and inflation adjusted prices Dollars per barrel Real price Nominal price 0 Jan-05 Jul-05 Jan-06 Jul-06 Jan-07 Jul-07 Jan-08 Jul-08 Jan-09 Jul-09 Jan-10 Source: U.S. Energy Information Administration, Short Term Energy Outlook, April 2.010
4 Historical oil prices, 40 years Nominal and inflation adjusted prices Dollars per barrel Real price Nominal price Source: U.S. Energy Information Administration, Short Term Energy Outlook, April 2010
5 Oil accounts for one-third of global primary energy consumption 2008 Global primary energy consumption Hydro electric 6% Nuclear energy 6% Oil 35% Source: BP Amoco's. Coal 29% Natural gas 24%
6 Oil reserves concentrate in politically unstable regions Total proved reserves (2008): 1.26 trillion barrels Asia Pacific 3% Others 1% North America 6% Latin America 10% Africa 10% Sources: BP Amocos, Milken Institute. Former Soviet Union 10% Middle East 60%
7 How Americans demand energy Total U.S. energy consumption by sector Total U.S. energy mix Electricity generation 40% Residential and commercial 11% Sources: U.S. Energy Information Administration. Transportation 28% Industrial 21% Renewable 7% Natural gas 23% Nuclear 9% Coal 24% Petroleum 37%
8 How Americans use petroleum and natural gas Petroleum use by sector Natural gas use by sector Residential and commercial 5% Industrial 23% Electricity generation 1% Transportation 71% Electricity generation 29% Transportation 3% Industrial 34% Sources: U.S. Energy Information Administration. Residential and commercial 34%


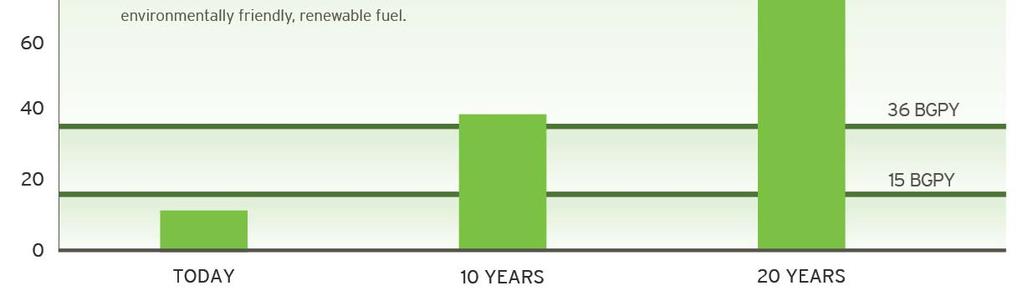
9 Planned incorporation of biofuels resulting from Europe s Renewable Energy Roadmap bioethanol 10% by 2020 Source: European Commission. The impact of a minimum 10% obligation for biofuel use in the EU-27 in 2020 on agricultural markets. April 30, 2007.
10 2008 and 2009 world ethanol production estimates Country Millions of Gallons USA 9,000 10,600 Brazil 6,472 6,578 European Union China Canada Other Colombia India Australia Total 17,245 19,530 Source: F.O. Lichts, Renewable Fuels Association.
11 China is the biggest government investor in green energy by far... Green stimulus spending by country, 2009 US$ billions 250 $ Breakdown of U.S. green stimulus spending Low carbon 6% Rail 10% $112 $31 $23 Water waste 15% Energy efficiency 25% Gid Grid 12% Renewables 32% $14 $12 $7 $3 $2 $2 China U.S. S. Korea EU Germany Japan France Canada Australia U.K. Source: HSBC, 2009
12 Even though U.S. energy consumption is far greater Comparison of Chinese and U.S. energy statistics Vehicles per 100 population 2 80 Residential electricity consumption (TWh) GHG emissions per capita (tco2e) Cumulative CO2 combustion emissions (Gt) , Current GHG emissions (GtCO2e) One Thing Leads to Another Population (millions) 7.5 1, Sources: CIA Factbook, IEA CO2 Emissions Report, WRI CAIT, IEA World Energy Statistics
 (Actual) (Target) Tax incentives Proportion of RE in National cost-sharing 8% 16% 17% national energy mix (%) Planning for renewable energy transmission Hydropower (GW) 120 172 300 Support")
13 Chinese government also creating a highly supportive environment for clean tech Renewable energy targets: Additional policy support: National pricing regulations National Targets (Actual) (Actual) (Target) Tax incentives Proportion of RE in National cost-sharing 8% 16% 17% national energy mix (%) Planning for renewable energy transmission Hydropower (GW) Support for wind Wind power (GW) Feed-In Tariffs (FITs) Biomass power (GW) Turbine bidding favoring domestic Photovoltaic power manufacturers Six 10+ GW farms bases by 2020 (GW) Support for solar Major provincial and city plans Rumors of a national PV FIT underway Source: Research by the Lawrence Berkeley National Laboratory, presented at REFF-West, September 2009.
14 Investment in clean energy may have plateaued for now Quarterly financial investment in clean energy, 2004 to 2009 US$ billions Q1 '04 Q2 '04 Q3 '04 Q4 '04 Q1 '05 Q2 '05 Q3 '05 Q4 '05 Q1 '06 Q2 '06 Q3 ' Q4 '06 Q1 '07 Q2 '07 Q3 ' Q4 ' Q1 '08 Q2 '08 Q3 '08 Q4 ' Q1 ' Q2 '09 Q3 '09 Q4 '09 Source: New Energy Finance.

15 Natural gas: Can it be a game changer? Natural Gas: Fuel of the future. (March 29, 2010) U.S. Natural Gas Reserves May Have Doubled, Secretary Chu Says. (April 06, 2010) Sources: CNN Money, Bloomberg Business Week.
16 Natural gas is the cleanest of the major fossil fuels Pounds of CO 2 per million Btu Coal Diesel fuel (anthracite) & heating oil Source: U.S. Energy Information Administration. 117 Gasoline Natural gas 3,000 2,500 2,000 1,500 1, Pounds per billion Btu ,744 Nitrogen oxides 2,591 Sulfur dioxide Particulates 1, Natural gas Oil Coal


17 Today s grid: 164k miles of wire, 3000 utilities
18 What s wrong with the grid? Majority of electricity capacity infrastructure 30 years old or more, with transmission i bottlenecks Since 1990, demand for electricity up 25%, construction of transmission facilities down 30% Renewable energy inputs are limited due to the grid s age and distance from consumers Much of the new capacity will need to come from renewable resources Lack of security leaves the grid vulnerable Source: U.S. Department of Energy.
19 How can United States build the needed capacity by 2030? EIA estimate for additional capacity = 338 GW by 2030, costing 300 US$ billions Capacity (GW) Source: U.S. Energy Information Administration
20 The costs of U.S. wars First t Gulf War (1991): $61 billion spent War in Iraq (current): $747.3 billion spent and allocated War in Afghanistan (current): $299 billion spent and allocated Considering interest outlays, the Congressional Budget Office expects both current wars to top $2.4 trillion over the next 10 years. Sources: Reuters, Congressional Budget Office.,

21 The rise of Wahhabism Since the rise in oil prices in1973, the Saudi Arabia has spent $85-90 billion propagating Wahhabism The Saudi Government has allocated funds to build and maintain over 1,500 mosques, 202 colleges, 210 Islamic centers, and almost 2,000 schools for educating Muslim children in non-islamic countries in Europe, North and South America, Australia and Asia. Source: Alex Alexiev, "Terrorism: Growing Wahhabi Influence in the United States", Oregon Public Broadcasting The Najd Region is the birthplace of Wahhabism
22 Chevron Jay Pryor Jay Pryor Vice President, Corporate Business Development Chevron Corporation April 27, 2010


23 Demand inevitably follows growth Source: IEA Statistical Data, Global Insight Source: IEA Statistical Data, Global Insight


24 Fossil fuels indispensable for decades Source: EIA International Energy Outlook 2009 Source: EIA International Energy Outlook 2009


25 Long-term oil supply challenge 2010 Chevron Corporation 25


26 The U.S. energy mix no major changes 40.0% 2010 Chevron Corporation Source: EIA Annual Energy Outlook 2009 Reference Case


27 Efficiency: the best source of new energy Source: IEA Statistical Data

 3% 16%")


28 An enormous global resource base % of World Total 26% (U.S. = 24%) 3% 16% 20% 21% ,060 Oil Shale 4,056 Coal 8% 6% 295 Oil Sands 1,113 Natural Gas 1,158 Oil 7,682 billion barrels of proved oil equivalent reserves histogram scale = 500 BBOE Source: Oil & Gas Journal 2008, World Energy Council 2004, IEA Resources to Reserves

29 National oil companies dominate Source: Petroleum Intelligence Weekly PIW Source: Top 50, Petroleum Nov 2009 Companies with combined oil and natural gas reserves greater than 9.5 billion barrels oil equivalent Intelligence Weekly


30 Gorgon: a world-class natural gas project offshore N.W. Australia Energy delivered at scale $37 billion investment 15 MM tonnes/year LNG for export World s largest sequestration project 3.5 MM tonnes/year CO 2 sequestered Half the CO 2 of coal

31 Unconventional gas drives down U.S. imports Source: EIA, IEA & Chevron Analysis


32 Emissions track growth Source: IEA online statistical data; IEA World Energy Outlook 2009


33 IEA s $45 Trillion Road Ahead. What does it take to reduce CO 2 50% by 2050? 32 new nuclear plants per year PLUS 215 million square meters of solar panels per year PLUS Add carbon capture & storage to 55 coal power and natural gas plants per year PLUS 17,500 new wind turbines per year PLUS 2010 Chevron Corporation Deployment of nearly 1 billion electric or hydrogen fuel cell vehicles PLUS Double the world s energy efficiency and wide-spread zero emissions buildings Source: IEA Energy Technology Perspectives 2008


34 A vast undertaking: capturing carbon Scale of future CO 2 pipeline infrastructure will need to be comparable to today s oil & gas infrastructure. Source of Data: EIA s 2005 emissions Source of Data: EIA s 2005 emissions data; Carbon Dioxide Capture and Geologic Storage: A Core Element of a Global Energy Technology Strategy to Address Climate Change, a report of the Global Energy Technology Strategy Program, Pacific Northwest National Laboratory and the University of Maryland, April 2006


35 Fleet turn-over takes time... 35

36
37

38


39


40
41
42

43


44


45


46


47
48
49

50


51


52


53


54


55


56