Energy Network Transformation. Dr. Stuart Johnston Executive Director, Assets and Network Transformation
|
|
|
- Patience Black
- 5 years ago
- Views:
Transcription

1 Energy Network Transformation Dr. Stuart Johnston Executive Director, Assets and Network Transformation
2 Overview ENA scope and current focus Disruptive change driven by customers and technology Network businesses are responding Network Transformation Roadmap project

3 ENA Members The peak national body representing gas distribution and electricity transmission and distribution businesses throughout Australia. Twenty-six electricity distribution and transmission and gas distribution network companies are members of ENA.
4 Energy Networks Association Energy networks are the lower pressure gas pipes and low, medium and high voltage electricity lines that transmit and distribute gas and electricity from energy transmission systems directly to the doorsteps of energy customers. More than $100 billion in assets and almost 15 million customer connections nationally Total line length of distribution infrastructure is more than km Key focus areas include: the national and state government policy and regulatory environments key technical issues such as network safety and security of supply, skills and training, reliability and power quality and energy efficiency.

5 The traditional energy supply chain Source: AEMC Generation Transport Consumption

6 Technology is disrupting the traditional Energy business model In many aspects the pace of change in Australia is ahead of other countries Australian Energy businesses must act now
 to 28% (SA) of Energy - Shifting peak to 7.")
7 Upending our Energy System AEMO: Solar PV capacity to increase 500% to Output ranging from 9.3% (NSW) to 28% (SA) of Energy - Shifting peak to 7.30pm in SA and Qld Within 10 years, Solar PV output could exceed minimum demand in South Australia
8 Expected costs of solar panels and storage continues to drop The key transformation drivers competitive on-site generation and storage have each strengthened their competitive position since 2013 by about 20% Solar 2013 estimate Solar 2015 update Batteries 2013 estimate (right axis) Batteries 2015 update (right axis) $/kw $/kwh
9 Converging costs of centralised generation technologies SOURCE: Australian Power Generation Technology Cost Study 2015
. Only 3.72% of dwellings have rooftop solar.")
; and has the highest penetration of household PV.")
10 Australia leads the world in the penetration of household solar PV Germany has the highest solar generation per capita (0.47kW). Only 3.72% of dwellings have rooftop solar. By contrast, Australia places 6th on the solar generation per capita league table (0.19kW); and has the highest penetration of household PV. Australia has significant untapped potential for grid scale PV.

11
12


13 Areas of Focus Network Transformation Roadmap Stage 1 (2015) Stage 2 (2016)

")

 New")
")
")
14 3. Simplified map of NTR inclusions Pricing & Behavioural (WP5) Program-wide Modelling Customer Value (WP2) Business Models (WP3) New Market Operation & Automation Pro (WP9) Regulatory Frameworks (WP4) Technological Enablers (WP6-8) Stage 1 Stage 2


15 Future Grid Forum modelling update Set and forget Leaving the grid Rise of the Prosumer Renewables thrive

16 Electricity consumption will be flat to rising To project consumption, we start with AEMO and IMO s projection, and adjust for each scenario s on-site generation and electric vehicle adoption

17 Peak demand growth will also be subdued To project peak demand, we start with AEMO and IMO s projection, and adjust for each scenario s battery storage and other demand management adoption

18 Grid under-utilisation is still a risk Declining utilisation remains a risk but these results are around 5-10 percentage points better than in the 2013 modelling in the three worst cases, due to improved outlook for demand management

19 The outlook for networks costs is improved The improved outlook for utilisation means that the outlook for network costs has improved, with long term costs 3-10c/kWh lower across the scenarios

20 Cumulative system expenditure shares are diverse
21 Updated Future Grid Forum scenario analysis Fourth key finding The updated scenarios continue to reflect electricity networks performing an evolving range of critical roles by 2050 supporting diverse energy use and services for customers Networks grow modestly under all scenarios Networks roles range from leading to enabling Urban grid disconnection remains uneconomic until late 2030s A wider range of customer needs are met

22 Customer-orientation of Networks Future electricity customers may: be increasingly heterogeneous in their expectations be diverse across a broad vulnerable engaged empowered spectrum of market segments. continue to value solutions that provide secure and reliable electricity for an increasingly digitized and automated lifestyle and the expanding role of electric vehicles; and In some cases be willing to trade-off aspects of services that were traditionally standardised in return for a financial benefit.
23 Prospective 2025 Market Segments - Residential Segment Autonomous Empowered Engaged Vulnerable Tech focused Hands on (Active) Be my agent (Passive) Service dependent Descriptor desires and needs Independent: Desires complete control and highly granular cost management Can sometimes be motivated by cost or reliability reasons In many cases may leave the grid Empowered: Affinity with technology and high desire to be in control cost is important and customer needs to see return on investment Able to interact with market and buy/sell energy Active: Pushes for more information and options to reduce cost and enhance levels of control control leads to cost savings Passive: Desires ease and convenience from energy services, reduced cost and some access to data/information Will invest in cost saving measures if easy A portion value time and convenience over cost Dependent: Needs affordable network services May also include customers who are unable to choose to adopt new services or products because of agency/split incentive barriers for example renters, or those with a lack of access to capital
24 Prospective 2025 Market Segments Comm & Ind Autonomous Active Passive Vulnerable Focus on energy High Medium/High Low High/Medium Ability to act High Medium Medium Low Descriptor I want to act and I can I don t need to act I need to act but can t Highly empowered set of business customers who will be very interested in how technology can reduce their costs, improve their green image or improve operational efficiency Heavily focused on innovation and environment. They will seek highly configured and customised solutions and will spend more effort in research/engaging with complicated price structures or solutions In Control: Highly engaged and motivated to maximise savings and efficiency by engaging more with the energy system. This group is likely to be large Willing to invest in technologies and accept a higher level of complexity, so long as they can offset the additional time and (potentially) investment with a positive return on their investment, reflected either in ongoing cost savings and/or a positive environmental impact Extremely busy customers and have little time to understand their energy costs or needs Any extra complexity is a challenge for these end-users, who are busy maintaining or growing their business Require a simple set of solutions that take the worry and effort (time to manage, risk of interruption, potential cost savings or loss) out of energy will remain largely passive to the energy system Service dependent customers who are highly dependent on grid supply to keep their business running Need help because they are unable to engage with new technologies or offers and will have a high level of cost sensitivity Want to concentrate on running their business and keeping solvent, and increased energy costs or complexity are a barrier Like residential
25 Customer-orientation of Networks Future market segments are not perfect predictions of customers in 2025 but do enable future strategic options to be explored in detail An increasingly competitive operating environment means that a strong customer orientation will be vital for network businesses and their value-network partners to: Comprehend and anticipate changing customer expectations; Optimise existing services to foster social license, trust and loyalty; and, Innovate new electricity solutions and business models, often in concert with value network partners.

26 Challenges and Opportunities of Distributed Energy Resources Integration of Distributed Energy Resources requires a careful operational response to challenges such as voltage management, frequency regulation and network stability. However, well-integrated DERs can also provide solutions for addressing these network challenges and improving network efficiency. This is likely to require: New regulatory frameworks; Enhanced standards; and Commercial responses which unlock the potential of energy storage, demand response services and power electronics solutions.

27 The key role of Energy Storage in integrating Distributed Energy Resources Energy storage, in its many forms, is an incredibly versatile distributed energy resource. Storage can help to manage a large variety of challenges relating to the existing grid, and mitigate many of the additional challenges from the increasing penetration of distributed energy resources.
28 Key Findings - Standards Advances in Standards: A number of new technical standards have been identified that are critical to the efficient and safe deployment of technology enablers of the integrated grid. These include: Storage Safety Standards Electric Vehicle Standards Inverter Standards Protection Relay standards Smart Meter Standards
29 Key Findings - Other Integration Tools Intelligent Distributed Resources: Distributed energy resources, such as rooftop solar PV systems and embedded/distributed wind turbines, are already reducing customers electricity bills and providing significant benefits and cost savings to energy networks. The addition of smarter control, better storage, or both, enhances these benefits to improve power quality and increase reliability. Some key opportunities include: Adaptive Systems Demand Response and Prediction: are critical to predicting and controlling network loads in the integrated grid. If enabled appropriately, they can bring multiple benefits to both networks and customers. Smart Energy Resources such as power electronics Voltage Control
30 New Operating Principles for Progressive Business Models Future Business Model Progressive principles: Being able to integrate all types of generation. Enabling consumers to provide services back to the grid. Offering enhanced or optional services, such as microgrid services and other DER support services. Being agnostic about supply. Facilitating a retail market for consumers and third-party providers to buy and sell services. Foundational operating principles for the traditional grid model Maintaining a safe and reliable grid Increasing grid efficiency Optimizing asset utilisation Support / implement public policies Highly reliable & resilient energy services Identify most cost-effective ways of achieving outcomes

31 Advanced business models Accenture: Advanced business model responses by energy networks may see a focus on Platform-Enabled services, supported by key operating principles: Being able to integrate all types of generation; Enabling consumers to provide services back to the grid; Offering enhanced or optional services; Being agnostic about supply; and Facilitating retail markets.

32 Effective Tariffs and Incentives First Wave reform from 2017 NSPs meet their universal responsibility to all customer segments improve fairness and efficiency, with the right support and tools. Second Wave may see customers participate in new pricing options or markets, which are likely to be voluntary location-specific and dynamic in real time.

33 Priority Directions in Energy Policy & Regulation Key elements of Australia s energy regulatory framework are robust, however a managed rather than ad hoc - approach to regulatory reform is required to support: flexibility and innovation; the introduction of contestability; new approaches to risk allocation; and the transition to more fit-for-purpose regulation.

34 NTR Stage 2
35 Technical Focus of Stage 2 1. Grid Design & Operation Develop a functional description/specification of DSO functionality that are likely to be inherent in future network services Establish what is the optimum design and operating parameters of an inverter dominated power system of the future to allow for the likely reduction in the level of synchronous generation and the increase in non-synchronous generation. Identify the solutions to efficiently design, control, and operate grid connected and islanded/non-connected microgrids/minigrids. Balancing demand side response.
36 Technical Focus of Stage 2 2. Develop the most effective operating platform that allows full optimisation and coordination of the diverse range of connected Transactive Energy Systems utilises the networks most effectively network operation and control that alleviates the technical impacts and maximise the benefits of new demand side technologies Establish the optimal controls required to maximise overall system performance and maintain system stability and global optimisation. Focus on detailed technical issues including how energy storage can be optimised to mitigate system operability issues such as frequency and voltage stability, inertia and constraint management issues
37 Technical Focus of Stage 2 3. Technical enablers Roadmap to deal with gaps in industry standards and guidelines Establish what communication requirements needed to enable the full range of intended smart grid activities 4. Innovation Identify the key gaps in research and development required to enable the required operating platform to deliver the integrated grid of the future 5. Future Industry Workforce Requirements Establish a strategy to identify and facilitate the changes required to service the future skills and training requirements for the Electricity Supply Industry for 2027 and beyond.
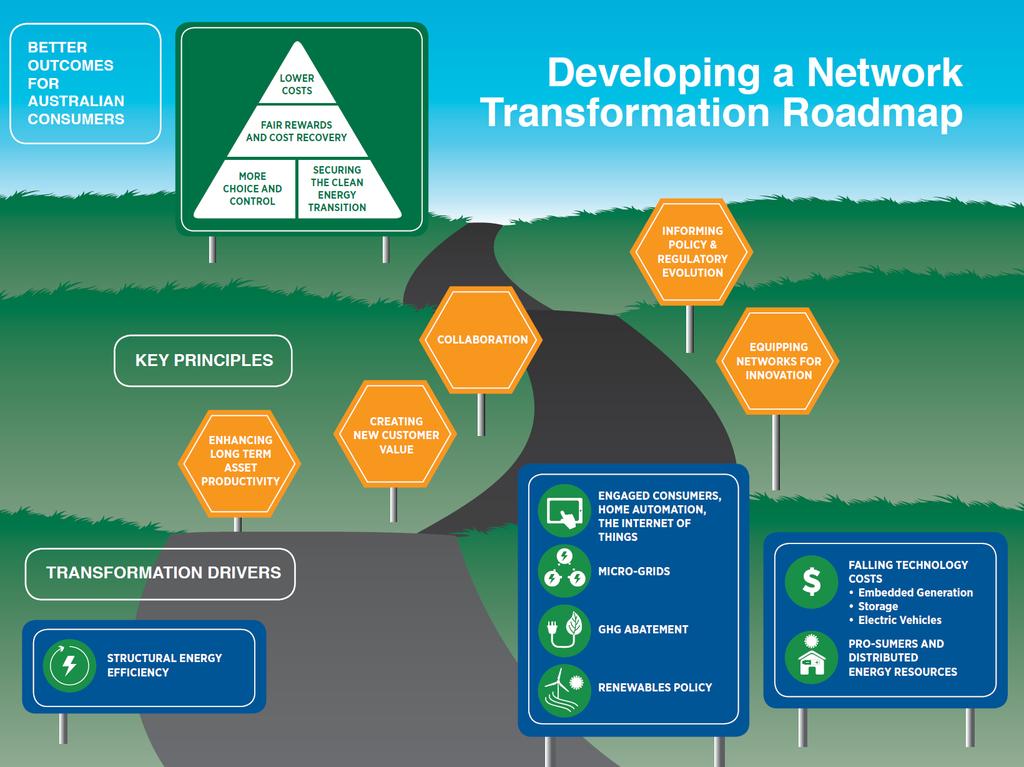
38 Roadmap objective and outcome Roadmap Outcome (Working Draft) Australia s electricity systems in the decade are resilient to divergent futures and characterized by: A balanced scorecard of long-term customer and societal value creation*; Whole-of-system efficiency, reliability and safety; and, Millions of end-users participating in and sharing the benefits of whole system optimisation through open and vibrant markets and appropriate protections. * As defined by the NTR Balanced Scorecard of: Lower electricity costs; Fair rewards and cost recovery; More choice and control; and, Securing the clean energy transition.
39 Thank You! Want to know more? For more information on the Electricity Network Transformation Roadmap Project, please contact Dr Stuart Johnston at ENA at or