Greenhouse Gas Emissions from Biomass Burning
|
|
|
- Evan Melton
- 5 years ago
- Views:
Transcription

1 Global Fire Greenhouse Gas Emissions from Biomass Burning Chris Justice Geography Department Chris Justice GOFC/GOLD University Fire of Maryland IT co-chair University of Maryland Fires in Southern Africa, August Land Use Fires in Myanmar Aqua, March
2 One of the GOFC/GOLD Fire IT GOALS i To generate operational fire emission product suites of known accuracy, providing annual and near realtime emission estimates with the available input data sets. (recognizes that emissions are modeled and the models are evolving) i Topic of discussion at the Fire Implementation Team (IT) workshop Thesaloniki, 2007 i Bottom line we are not there yet i To date for GOFC/GOLD this has been a long term agenda item (research>operations) could gather momentum in the framework of REDD i BUT we will need a substantial and concerted initiative to reach the goal

3 Calculating Emissions (Standard Approach): burned area fuel load combustion completeness emission factor -Average fuel loads, dynamic vegetation production models, -Satellite derived estimates of Net Primary Production, empirical relations for fuel types allocation - Average values, - Field based parameterizations based on fuel types and fuel moisture - Average values, - Field based parameterizations based on fuel types and fuel moisture Satellite Sources
4 Science emphasis to date on global budgets of fire emissions Biomass burning and fossil fuel emissions release ~10 15 g of carbon (C) to the atmosphere each year. Biomass burning constitutes ~36% of all global C emissions. - In 1998 High Northern Latitude CO fire emissions were 90% of *annual* emissions from combustion of fossil fuels in North America, Europe, and Russia (Kasischke et al. 2001) Region Central and northern South America Fire emissions average (10^15g C yr -1 ) 0.27 Southern South America 0.80 Northern Africa 0.80 Southern Africa 1.02 Southeast Asia 0.37 Boreal (north of 38 o N) 0.14 Other 0.13 Global 3.53 Source: Van der Werf et al., 2004
5 Examples of Satellite Based Global Estimates of Biomass Burning Emissions i Van der Werf et al., 2004 (Science) > 3.53 PgCyr -1 ( average) Global Fire Emissions Database version 2 (GFEDv2) for has improved seasonality i Ito and Penner, 2004 (JGR) > PgCyr -1 (year 2000) i Hoelzemann et al., 2004 (JGR) > 1.7 PgCyr -1 (year 2000) -Biofuel emissions not included
6 Thesaloniki Recommendation Intercomparison of model results A model inter-comparisons for global biomass burning emission estimates was recommended (GOFC-GOLD BIBEX Workshop 2002) - this has not occurred Model inter-comparisons often lead to data set improvement and convergence of methods

7 Similar approach at regional to local scales Method has been applied at the regional, national, local scale more appropriate for REDD applications Korontzi et al. RSE 2003
8 Biomass burning emissions for Alaska, Canada, and Conterminous U.S. in 2004 CO Emissions Turquety et al (Canada and U.S.) Weidenmyer et al (Canada and U.S.) Kasischke et al (Alaska only) 30.0 Tg 32.5 Tg 30.7 Tg Total Carbon Emissions van der Werf et al (Canada and Alaska) Kasischke et al (Alaska only) *represents 53% of burned area of vdw et al. 90 Tg 74 Tg*
9 Thesaloniki Recommendation Regional scale efforts to reduce emission uncertainties Finding: There is a need for specific activities in different regions to address major uncertainties in estimating emissions: 1. Improved mapping/estimation of spatial/ temporal variations in fuel loads 2. Improved mapping/estimation of fire severity and fuel consumption 3. Utilization of data available from fire management agencies
10 Thesaloniki Recommendation Regional scale efforts to reduce uncertainties in biomass burning emissions Status: A number of regional scale studies are needed to reduce uncertainties in estimating emissions Examples currently underway (among many others): 1. Tropical forests in Brazil 2. African and Australian savannas 3. Alaskan boreal forests Note all 3 studies are bottom-up approaches are linked to top-down modeling of Randerson et al
11 Combustion completeness as a function of land management 13 Burn Trajectories: Intermediate Scenario % biomass remaining after burn Jun Jul Aug Sep Oct Jun Jul Aug Sep Oct Jun Jul Aug Sep Oct Month of burning Crop 1yr 22 Crop 2yr 23 Crop 3 yr 24 Pasture 1 yr 25 Pasture 2 yr 26 Pasture 3 yr 27 Regrowth 2 yr 28 Regrowth 3 yr 29 Small 30 Crop 1.5yr 31 Pasture 1.5 yr 32 Regrowth 1.5 yr Trajectories derived from MODIS phenology, active fire, burn scars, and Landsatbased deforestation (PRODES) Morton et al.

12 Land Use Fires: Global Agriculture Fire Counts Jan Feb Mar Apr May Jun Jul Aug Sep Oct Nov Dec Month Korontzi et al. 2007
13 Satellite Burned Area Issues i Spatial Issues Area burned (Question of Scale) Coarse (Moderate) Resolution 1km-250m Moderate (High) Resolution 50m-10m i Temporal Issues Permanence of the scar as a function of Satellite repeat period and cloud cover Vegetation recovery (10 days to decades) Post fire weather conditions Reporting requirement Seasonal / Annual post fire assessment emissions / fire management Near Real Time ( air quality focus) i Accuracy Issues What is the required accuracy of area burned for emissions estimation? What is the error in area estimation a function of spatial resolution of the sensor algorithm size of the burn understrorey burning completeness of combustion at the patch scale (variability)
 colors show timing of the")
14 Savanna Woodland Systems larger burns Australia 500m burned areas 1 month 2002 Rainbow (ROYGBIV) colors show timing of the burn

15 MODIS Burned Area 500m Brazil, Southern Para, 500m burned areas 1 month 2002

16 Brazil, Southern Para, 1km active fires 1 month 2002
17 Satellite Burned Area i Emphasis in GOFC/GOLD Fire IT to date has been on developing global data fire data sets Three Multi-year Global Burned Area Products currently available L3JRC, Globcarbon, MODIS Burned Area i Several regional and continental products also available - e.g. GOFC Redlatif Latin America, Australia, Russia, Spain, Portugal i Considerable differences between them
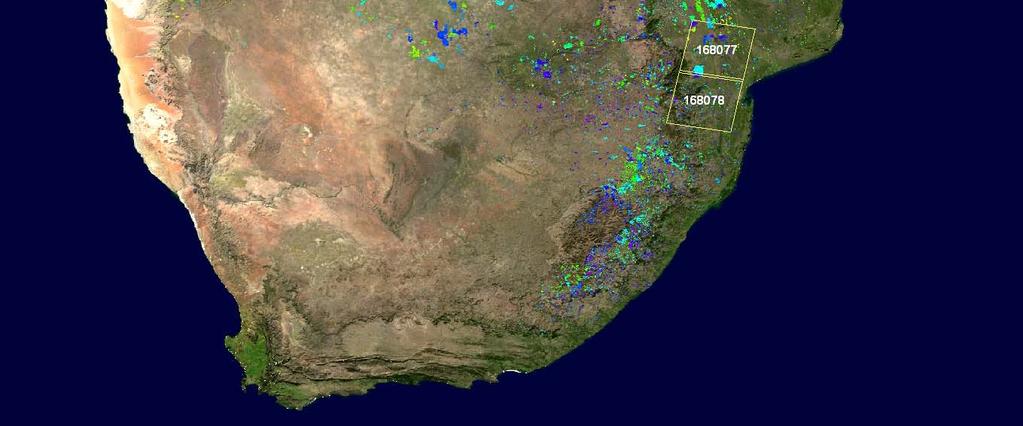
18 Thesaloniki Recommendation Global burned area products Finding: There is a need for a validated, global burned area data sets based on mapping of fire scars using finer resolution satellite imagery Status: Preliminary validation efforts underway need for open sharing of the validation data sets and the input data (accuracy of the validation data set) Intercomparison and accuracy assessment would benefit from a common validation approach and reporting GOFC/GOLD International Protocol submitted to CEOS CVWG on Land Product Validation GOFC/GOLD Regional Networks participating in an international validation effort Australia, S. America, S. Africa, India, Europe, others TBD


, woody savannas (light green), open shrublands")
, cropland/natural vegetation mosaic (olive brown), urban")
19 Landsat ETM+ validation scenes distributed from dry savanna to wet miombo woodland to quantify product accuracy over range of representative biomass burning conditions ETM+ scene ~185 * 185 km Each ETM+ scene has a local SAFNet collaborator 11 scenes = ~3% of southern African surface MODIS 1km land cover product: of the 17 MODIS land cover classes, predominant classes illustrated include: evergreen broadleaf forest (dark green), barren or sparsely vegetated (gray), woody savannas (light green), open shrublands (cream), grasslands (light brown), savannas (orange), croplands (yellow), cropland/natural vegetation mosaic (olive brown), urban (red). Inter-comparison and Validation

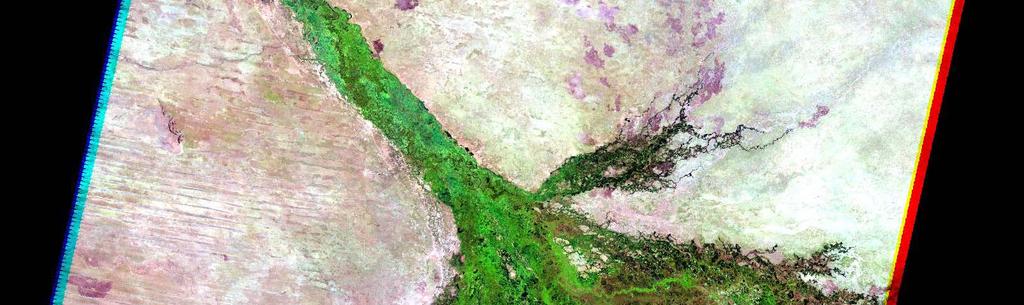
20 Landsat ETM+ Sept. 4th


21 Landsat ETM+ Oct. 6th Yellow vectors = ETM+ interpreted burned areas occurring between the two ETM+ acquisitions


22 MODIS 500m Burned Areas Sept. 4 to Oct. 6 White vectors = ETM+ interpreted burned areas occurring between the two ETM+ acquisitions
23 L3JRC A/S/O 2001 Inter-comparison
24 GlobCarbon A/S/O 2001 Inter-comparison

25 MODIS A/S/O 2001 Inter-comparison
26 Priorities to Improve Burned Area Products i Accuracy assessment and intercomparison needed in context of emissions - Sensitivity analyses of different burned area products for emissions estimation (e.g., Korontzi et al., 2004) i Define the accuracy requirements for burned area for emissions modeling i Special attention needed on Peatland burned area mapping inc. below ground (e.g., Siegert et al., 2004)
27 Calculating Emissions (Experimental Method): Combustion Rate vs. FRP SEVIRI measured FRP Roberts and Wooster Fire Radiative Power with MSG FRP generated every 15 mins Products being developed and evaluated

28 FRP and FRE Products under evaluation Govaerts et al
 Giglio et al.")
29 Global FRP Fire radiative power from MODIS active fires ( ) Giglio et al., 2006, JGR
30 Satellite-based Active Fire Approaches i Spatial Temporal Issues Active Fire > Fire Radiative Power Geostationary e.g. Severi Polar Coarse e.g. MODIS Polar High e.g. ASTER, BIRD i Quantify Errors of Omission / Commission of detection i How well are the fires located relate to fuel load i Active Fire Diurnal Cycle

31
 i Direct measures of trace gases (e.g. AIRS CO) McMillan et al.")
32 Other Satellite Based Experimental Methods for Emissions Estimation (cont d) i Direct measures of trace gases (e.g. AIRS CO) McMillan et al., GRL
33 Summary: Priorities to Improve Regional to Global Emissions Estimates i Establish burned area accuracies, standardized validation, reporting and products i Develop regional to global dynamic/seasonal fuel load estimates with annual resolution i Develop regional to global satellite based techniques for reliable fuel moisture assessment i Validate emissions models using direct satellite aerosol and trace gas estimates and atmospheric chemistry/transport models i Further explore new techniques for satellite based estimation of fuel consumed i Improve our understanding of the seasonal dynamics in emission factors and combustion completeness i Develop seasonal fuel chemistry databases for the prediction of important nitrogen, sulfur and halogen containing compounds released from fires
34 Emerging Developments related to biomass burning emissions estimation i CEOS WGCV LPV protocol for BA Val i Regional Networks facilitating global validation data set creation global effort needs supporting i Free access to Landsat data hopefully others will follow i MODIS Direct Readout Burned Area Algorithm being tested (Giglio) i Planning for new operational missions now including fire requirements NPP VIIRS, MTG, Post EPS VII But where are the operational high resolution sensors i Need agency commitments to support continued record of burned area and FRP products and their accuracy assessment ( validation ) emissions model intercomparisons (with common inputs) Further national and sub national scale methods i Refining GCOS Fire ECV requirements to include emissions i Refining GOFC/GOLD Sourcebook for Fire Emissions?
35 GOFC/GOLD Considerations for REDD Biomass Burning Emissions i What are the accuracy requirements for burned area REDD emissions estimation? Forests i Burned Area 50>10m scale data for forest clearing (area) i Better temporal coverage needed i Land use and fate of cleared forests are critical aspects i Critical uncertainties will need to be reduced Fuel load and characterization / Completeness of combustion Savanna Fire Management i Emissions reductions can be considered Early vs Late Season Burning Reduced Agricultural Burning Practice extensive emissions not large More of an air quality issue i For 30m>10m systems GEO/CEOS will need to establish - international Data Continuity - data and pricing policies to enable multiyear wall to wall