Wisconsin Water Use: Withdrawal Reporting and Inventory
|
|
|
- Reynard Newton
- 5 years ago
- Views:
Transcription

1 Wisconsin Water Use: Withdrawal Reporting and Inventory Presented to American Water Resource Association Wisconsin Section Conference Brookfield, WI Bob Smail Water Supply Specialist - Water Use Section Bureau of Drinking Water and Groundwater Wisconsin Department of Natural Resources


2 Water Withdrawal: Definition Taking water from a surface or ground water source making it unavailable for other purposes, even if only temporarily.

3 (Re)Starting a Reporting Program: Groundwater Protection Act and Great Lakes Compact 2003 Groundwater Protection Act 2003 WI Act 310, Required reporting for properties capable of withdrawing >100 kgpd of groundwater Environmental review of well applications in Groundwater Protection Areas Great Lakes Compact in WI Act 227, Water use program created Register all properties capable of withdrawing >100 kgpd of groundwater or surface water Water Use fees of $125 per property Scaled per gallon fee above 50 Mgy in GLB $1000 small business cap Lake Beulah WI Supreme 2011 Court Case DNR expanded environmental review to avoid impacts to all waters of the state Not formalized in rule or statute

4 Groundwater Sources Inventory: Data Migration and Source Registration Municipal and high capacity wells regulated for over 100 years WI Board of Health up to 1969 WDNR from 1969 to present High capacity wells automatically registered Implementing reporting and registration requirements required: Creation of a new system based on surface and groundwater withdrawals Migrating multiple file types and records to one registration system Determining status of wells Determining current ownership Current registered GW Sources 7,600 High Capacity Wells 4,150 Low Capacity Wells
5 Groundwater (GW) Sources: Growth in Construction of High Capacity Wells Expansion of High Capacity wells wells wells wells wells wells Average 150 new wells per year since 1960 Groundwater irrigated agriculture Emerges during prolonged dry period in 1950 s and 1960 s Average 90 new irrigation wells per year since 1960 Irrigation wells comprise 70% of the growth in high capacity wells after 1960
6 Groundwater (GW) Sources: Drivers of well construction and abandonment Drought and High Capacity Wells High capacity well completions usually spike in year following drought Record year for completions in 1977 following 3 year drought in 74 to 76. New wells and the 2012 Drought 307 high capacity wells approved in 2012 Over 100 application still under review Lake Beulah decision has increased time for review Application procedures are currently being evaluated and revised through LEAN process. Abandonments High capacity well abandonments undergo a sustained spike starting in 2007 New reporting efforts Fee collection

7 Surface Water Sources: Outreach, Collaboration and Source Registration Surface water (SW) withdrawals have been regulated in the past by other programs Chapter 30 irrigation CWA 316(b) Municipal systems Other withdrawals have not been regulated Cranberry producers Paper manufacturing Non-metallic mining Aquaculture Disconnected ponds Registration challenges Migrating historical data from other programs into one registration system Outreach Disconnected ponds Current registered GW Sources 822 SW withdrawals

8 Reporting and Fees: Improving inventory data through repeated contact Withdrawal reporting was reinstituted by WDNR in 2008 Response rates have increased each year. 70% in 2010 =91% in 2011 Already >80%, 11,000 sources for 2012 Water use fees were first charged in 2010 Fees along with repeated reporting requests have greatly improved quality of inventory and reporting data Current registered properties: 5,900 total 5,250 have only GW sources 450 have only SW sources 200 have both GW and SW sources

9 2011 Results: Total Statewide Withdrawals Total 12,580 Sources 826 SW 11,754 GW Total volume withdrawn = trillion gallons 11,418 reports received Top sector response rates: Power = 100% Municipal = 98% Paper Man. = 98% Aquaculture = 97% Lowest response rate was Non- Ag/non-Golf irrigation = 86% Unreported withdrawals were estimated based on capacity and use category Estimated withdrawal volume for unreported sources accounted for 0.59% of total volume Unreported sources were more likely to be low capacity wells

10 2011 Reporting Results: Monthly Variation Increased temperatures drive power, paper and municipal demand during the summer months Growing season drives agricultural irrigation in July and August Harvest and frost flooding for cranberries drives water demand in fall


11 2011 Groundwater Withdrawals: 213 Billion Gallons Statewide

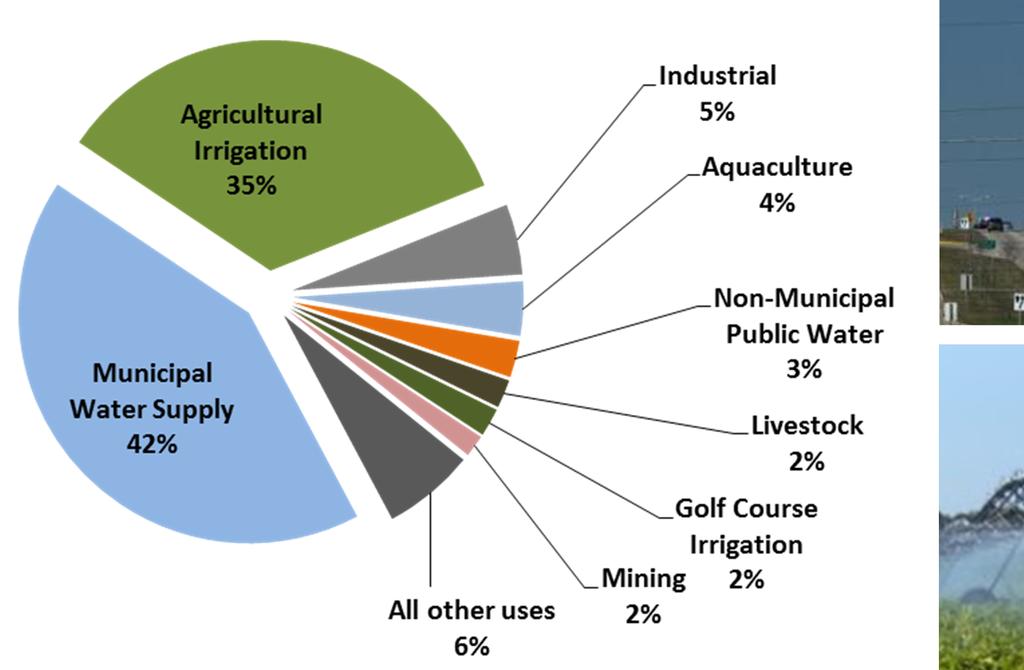
12 2011 Reporting Results: Groundwater Withdrawal Locations Groundwater withdrawals totaled 213 billion gallons from 11,754 sources Most concentrated in urban areas and vegetable-producing regions Sector Sources % 2011 Total BGY Municipal Water Supply % 90 Agricultural Irrigation % 74 Industrial 610 5% 11 Aquaculture 140 4% 8 Non-Muni Public Water % 5 Livestock 723 2% 4 Golf Course Irrigation 444 2% 4


13 2011 Surface Water Withdrawals: 1.94 Trillion Gallons Statewide

14 2011 Reporting Results: Surface Water Withdrawals Surface water withdrawals totaled 1,942 trillion gallons from 826 sources Most concentrated along Lake Michigan shoreline, Fox and Wisconsin rivers and in cranberry growing areas. Dominated by power production Sector Sources % 2011 Total BGY Power Generation % 1,644 Paper Production % 121 Municipal Water Supply % 105 Cranberry Production % 43 Mining % 12 Aquaculture % 9


15 Reporting and Inventory: Quality Assurance and Known Unknowns QAQC- Current Outlier analysis - withdrawal vs. capacity Source error detection and correction QAQC- Planned Benchmarking reported withdrawals against known withdrawals Collaborating with selected users to test validity of estimate parameters Cooperation with USGS Water Use research Outlier analysis - withdrawal vs. capacity by sector and spatial extent Disconnected pond withdrawals Limited DNR regulation of withdrawals Limited knowledge of non-registered pond withdrawals Inconsistent regulations in different counties Unregulated construction and approval violations Drill first, apply later Horizontal wells

16 Reporting and Inventory: Data availability and future plans Data aggregated at section level is publicly available upon request Data for specific sources, areas or sectors is available through a signed data request Requests can be facilitated through user provided GIS extents GIS source and withdrawal shapefiles can also be provided upon written request Currently integrating county parcel data with well ownership data Testing different methods for providing online section level data WDNR public GIS viewer Google Earth (.kmz files)


17 For more information: Bob Smail GEF 2 DG/ Robert.Smail@Wisconsin.gov Thank You!